Categorization based on cutpoints is a type of data transformation. If the source data for the data configuration does not contain a variable that categorizes values in a way that is needed for stratification or subsetting during a data mining run, you can create categories by defining cutpoints for the variable. You can define categories for only a continuous variable; that is, numeric or date variables.
For example, the source data contains Age, but not Age Group. The data miner wants to subset data by the following groups: 18 or younger, 19-65, and over 65. You can define a variable based on Age, and then categorize those age values into groups by specifying cutpoint values that indicate the range of each category.
1. In the
left navigation pane, click the Settings icon
(![]() ).
).
2. In the Configure System section, click Manage Configurations.
3. Click the
Row Action menu (![]() ) for the data configuration,
and then click Edit.
) for the data configuration,
and then click Edit.
4. To add a variable to represent the cutpoints, click the Add New Variable link. For more information, see Add or edit a data configuration variable.
5. In the Name field, enter the name of the variable.
Variable names display throughout the application, including when users select criteria for viewing data mining results, defining queries, or creating report definitions. For example, a column might be named SYMPTOM in the Oracle table, but renamed to appear as Event in the application.
6. In the Description field, type a description of the variable.
7. Next to the Table field, click Select Table/Column.
8. As the Column of source data, select the variable containing values that you want to map. The source column must contain numeric or date values.
9. Set Hide From Query Wizard to Yes. (Even if this setting is set to No, the mapped variable is not available in the Query Wizard.)
10. In the Data Transformation section, click User-defined cutpoints, and then click View/Edit.
11. To assist you in determining which categories to define, you can view column statistics about the distribution of values for the field in the entire source database.
12. In the first row, which starts with VALUE <=, in the Value column, enter the last value in the first category.
13. In the Label column, enter a label for the first category. For a date value, use the format, mm/dd/yyyy. For example, 12/14/2019.
14. In the next row, enter the last, or highest, value and a label for the second category. (You must enter the cutpoint values in ascending order.)
15. Continue defining categories until you are ready to define the last category.
16. For the last category, enter only a label. There is no need to enter a value. For example:
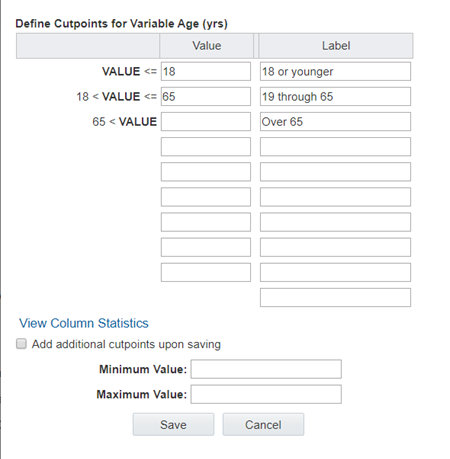
17. If you need to add more categories than you can currently fit on this page, check Add additional cutpoints upon saving. When you click Save, you can add more categories.
18. Optionally, enter values into the Minimum Value field and the Maximum Value field.
The minimum and maximum apply to the source values, not the transformed values. This option is useful if you want to exclude extreme values from inclusion in a data mining run. The excluded values are considered missing. They are assigned the value that the user sets for the user preference, Replace Missing Values with.
When specifying a minimum and maximum value for a date value, use the format mm/dd/yyyy, for example, 12/14/2019.
19. Click Save.
If you checked Add additional cutpoints upon saving, another row is added.
20. When you are finished specifying categories, clear Add additional cutpoints upon saving, and click Save.
The cutpoints for the variable are created. If you define cutpoints for a variable in a configuration for which there are existing runs that use the variable, users cannot drill down correctly in the run results until the runs are re-executed.