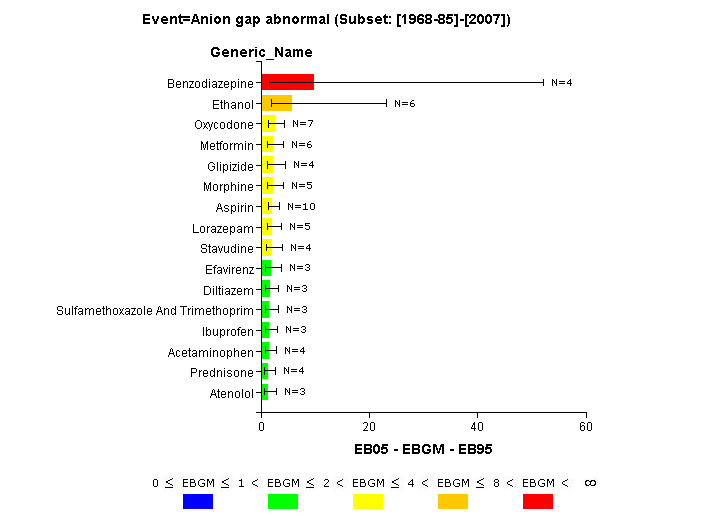
Confidence interval graphs are similar to bar graphs but also include a confidence interval or error bar superimposed on each bar to show the 5% and 95% confidence limits. A confidence interval graph is available for two-dimensional MGPS results and logistic regression results. You can choose a confidence interval graph to display the following scores:
· EB05-EBGM-EB95 for an MGPS data mining run.
· ER05-ERAM-ER95 for RGPS computations, if computed in an MGPS data mining run.
· ROR05-ROR-ROR95 for Reporting Odds Ratio computations, if computed in an MGPS data mining run.
· LR05-LROR-LR95 for a logistic regression run.
The graph key shows the statistical ranges that determine the bar colors. You can modify the graph key (specifically, the cutpoints and colors) on the Choose Graph page.
If the Notes check box is selected when you display the graph, a Notes section appears, and provides information on the selection criteria and display options used for the graph.
The following example is for a two-dimensional data mining run, with the Anion gap abnormal event selected: