Breakdown details are the specification of values for a breakdown variable. If a breakdown variable is a text or date variable, you can define breakdown details using individual selected values, distinct values, or grouped values. If a breakdown variable is a numeric variable, you define breakdown details using cutpoints. For an interactive report, you can define a query whose user-supplied values are used as breakdown details when the report is run.
Note: If there are 10 or fewer values for a column breakdown value, the application uses them by default as distinct values for the breakdown variable. For a row variable, the application uses all values by default as distinct values for the breakdown variable. You can modify these default breakdowns as needed.
1. In the left navigation pane,
hover on the Data Analysis icon
(![]() ), then click Report
Definitions.
), then click Report
Definitions.
2. On the Report Definitions page, accept the case series shown or click Browse to the right of Case Series to display the Select Case Series page and select a case series.
3. Click a
Report Definition's Row
Action menu (![]() ), then
click Edit.
), then
click Edit.
4. On the Edit Report Columns page, next to Breakdown Details, click Select.
5. Select the breakdown type by selecting the Every Distinct Value, Individual Values, Grouped Values, or Query Values radio button.
· To define breakdown details by distinct value, see Defining breakdown by distinct values. The report includes a column or row for every distinct (unique) value of the variable. This option uses the values available at the time you run the report, not at the time you define it.
· To define breakdown details by individual values, see Defining breakdown by individual values. The report includes a column or row for every value that you select. This option results in a static list of breakdown values that does not automatically adjust to changing source data.
· To define breakdown details by grouped values, see Defining breakdown by grouped values. The report includes a column or row for every group that you define.
· To define breakdown details by query values, see Defining breakdown by query values. This choice allows you to substitute values from the query that is run as part of an interactive report.
· To define breakdown details for a numeric variable, see Defining breakdown by cutpoints.
6. Click OK.
The performance of a report with breakdown details can depend on whether the analysis variable that you use comes from the same source table as the row variables. If the analysis variable is from the same table as the row variables, the performance of a report definition with breakdown details is much faster. This may be important when you are working with a sizeable case series (containing 5,000 or more cases). The speed difference is several orders of magnitude. When possible, select the analysis variable from the same table as the row variables.
For a breakdown variable, you can include a category for All values. The All column is not based on values for other columns in the report. For example, if the report shows counts, the All column is not a total of counts for the other columns.
In the following example, the same case may have PTs in both the Card SOC and Other SOCs:
|
SOC |
|||
|
Card |
Other |
Null |
All |
Sex |
Cases |
Cases |
Cases |
Cases |
|
N (U) |
N (U) |
N (U) |
N (U) |
F |
5000 |
11000 |
0 |
12000 |
M |
6000 |
13000 |
0 |
16500 |
The N (U) value for the All column and F row is not 5000 + 11000. The value in the All column is:
· 4000 who have a PT in the Card SOC and a PT in other SOCs.
· + 1000 who have a PT in the Card SOC only.
· + 7000 (computed as 11000 - 4000) who have a PT in any SOCs except Card.
· = 12000.
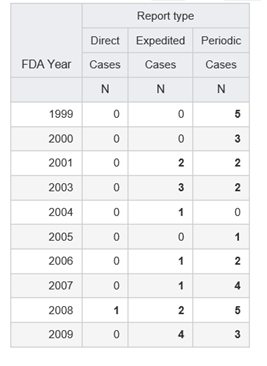
For example, you want a summary of the number of cases for each report type (direct, expedited, and periodic). For your report definition, you set up the FDA Year as the row variable and you specify Report Type as the column variable. You then need to specify the value you want to show for each report type; that is, the analysis variable. You specify CASE_ID as the analysis variable, label it as Cases, and select the Count aggregation method.