The attribute will be added as a node to the left hand pane:
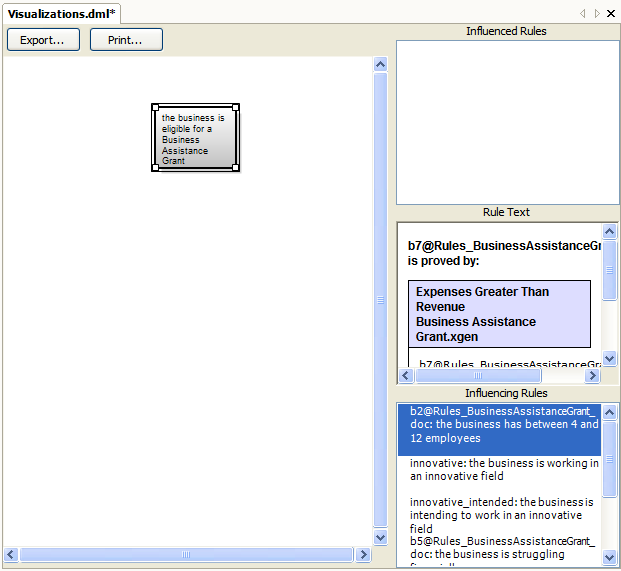
Note that the influenced/influencing rules and rule text for that attribute are displayed in the right hand boxes.
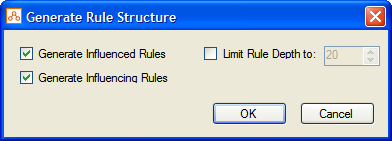
Click OK and the rule structure is generated:
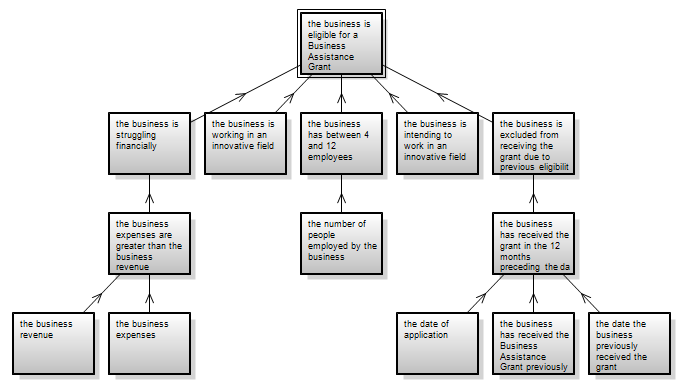
Rulebase visualizations are a handy way of displaying your rulebase, or a branch of your rulebase, in a tree structure which shows how the attributes influence one another. Visualizations can be printed, and also exported to Windows Media Format. Visualizations are created in visual browser files.
Create a new visual browser file
Create a rulebase visualization
Modify a rulebase visualization
Print a rulebase visualization
Export a rulebase visualization
Delete a rulebase visualization
To add a new visual browser file to your project:
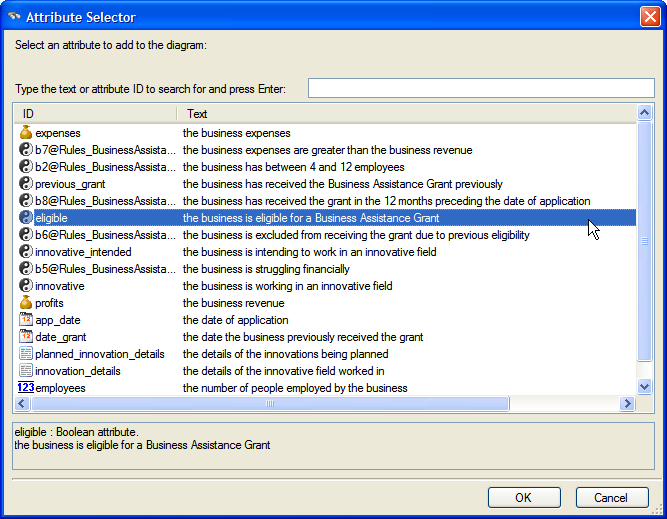
To create a rulebase visualization:
After you have created a rulebase visualization, there are many ways in which you can modify it.
When a rule structure is generated, Oracle Policy Modeling makes a best guess at the nicest way to present the tree. You may want to improve the appearance of the tree by moving the nodes around.
To do this, simply select a node and drag it to the desired location in the diagram. (The lines attached to the node move with it.)
You can change the display text, text font, text color and background color of any node in your rule structure. This is useful if you want to highlight important nodes in your tree.
To format a node:
To delete a node in your rule structure, select the node, right-click and select Delete Object.
You can hide relationships between nodes by selecting a node, right-clicking and selecting Hide Relationships... You can then specify which relationships you want to hide using the check boxes in the Hide Item Relationships check box.
You can select any node in your tree and regenerate (or generate for the first time) the rule structure for that node. Select the node, right-click and select Generate Rule Structure...
You can add labels to the rulebase visualization, and boxes that sit behind the diagram. This can be useful for identifying a group of nodes.
To add a label:
To add a box:
Labels and boxes can be moved to new locations in the diagram by selecting them and dragging them to a new position. Both labels and boxes can be deleted by selecting them and pressing the Delete key.
To print a rulebase visualization:
To export a rulebase visualization:
The rulebase visualization is saved in .wmf format (Windows Media Format).
When you save, the file automatically opens in Windows Picture and Fax Viewer. From here you can click the save button and save the image in a different format (BMP, JPEG, GIF, TIFF, PNG).
TIP: PNG is probably the best format to use as the other formats save the image with a black background which means the arrows in the diagrams are not visible.
To delete a rulebase visualization file:
TIP: To only remove the file from your Oracle Policy Modeling project (but not delete it from your file system as well), right-click it in Oracle Policy Modeling and select Remove from Project.