EventBridge
Oracle AI Database@AWS provides the capability to monitor your resources using Amazon EventBridge. Amazon EventBridge delivers a continuous flow of real-time data from applications and AWS services.
Amazon EventBridge forwards the data to different targets, such as AWS Lambda and Amazon Simple Notification Service. You can generate Oracle AI Database@AWS events from AWS and OCI service consoles.
For more information, see Monitoring Oracle Database@AWS events in Amazon EventBridge.
Prerequisite:
- You must have an existing Exadata Infrastructure. If you do not have an existing Exadata Infrastructure, you must create Exadata Infrastructure.
Note
The status of Exadata Infrastructure must be Available.
Setup Amazon EventBridge
These are the steps to monitor events from your Exadata Database and Autonomous AI Database resources in your Oracle AI Database@AWS, and send them to Amazon EventBridge.
- From the AWS console, select Amazon EventBridge from Services.
- Navigate to the Integration section, and then select Partner event sources. Confirm that you have an Active partner event source(s).
- Navigate to the Buses section, and then select Event buses.
Note
Your partner event source name must match with the event bus name. - From the left menu, select the Rules tab located under the Buses section.
- From the Event bus dropdown list, select your event bus name.
- Select the Create rule button to add rule(s) for publishing events from Event buses to CloudWatch. For more information, see Creating rules that react to events in Amazon EventBridge.
- In the Define rule detail step, complete the following substeps:
- Enter an unique Name.
Note
The Name can be up to 64 characters. It can include the following characters: 0-9, a-z , A-Z, dot (.), underscore (_) and hypens (-). - The Description field is optional.
- From the Event bus dropdown list, select the custom or partner event bus that you are created previously.
- By default, the Rule type is selected as Rule with an event pattern.
- Review your selection, and then select the Next button.

- Enter an unique Name.
- In the Build event pattern step, complete the following substeps:
- Select the All events option for your Event source.
Note
When the All events option is selected, EventBridge will send every event that comes to this event bus to this rule. - The Sample event section is optional. Expand the section, if you want to enter a sample event.
- The Event pattern section is optional.
- Review your selection, and then select the Next button.

- Select the All events option for your Event source.
- In the Select target(s) step, complete the following substeps:
- Select your Target types. EventBridge event bus , EventBridge API destination AWS service are available options. Select AWS service as a target.
- From the Select a target dropdown list, select CloudWatch log group.
- For the New log group field, enter a name.
- Review your selection, and then select the Next button.

- In the Configure tags step, complete the following substeps:
Note
This step is optional.- If you want to add a tag, select the Add new tag, and then enter a Key and Value.
- If you want to remove a tag, select the Remove button.
- In the Review and create step, review the information you have entered. If you have any invalid step, return to the step and make the required changes. Once you completed your review, select the Create rule button to complete the process.
- Once the rule is created successfully, you will view the following message.

- In the Define rule detail step, complete the following substeps:
- From the AWS console, navigate to CloudWatch to monitor events.
- Select the Log groups from the Logs section. The section lists all available log groups. From the list, you can select the link located under the Log group to view the Log group details.
- From the Log group details page, select the Log streams to see the events which are published to the target. To see the details of log streams, select the link from the Log stream list.
Perform Log Analysis with Amazon CloudWatch Log Insights
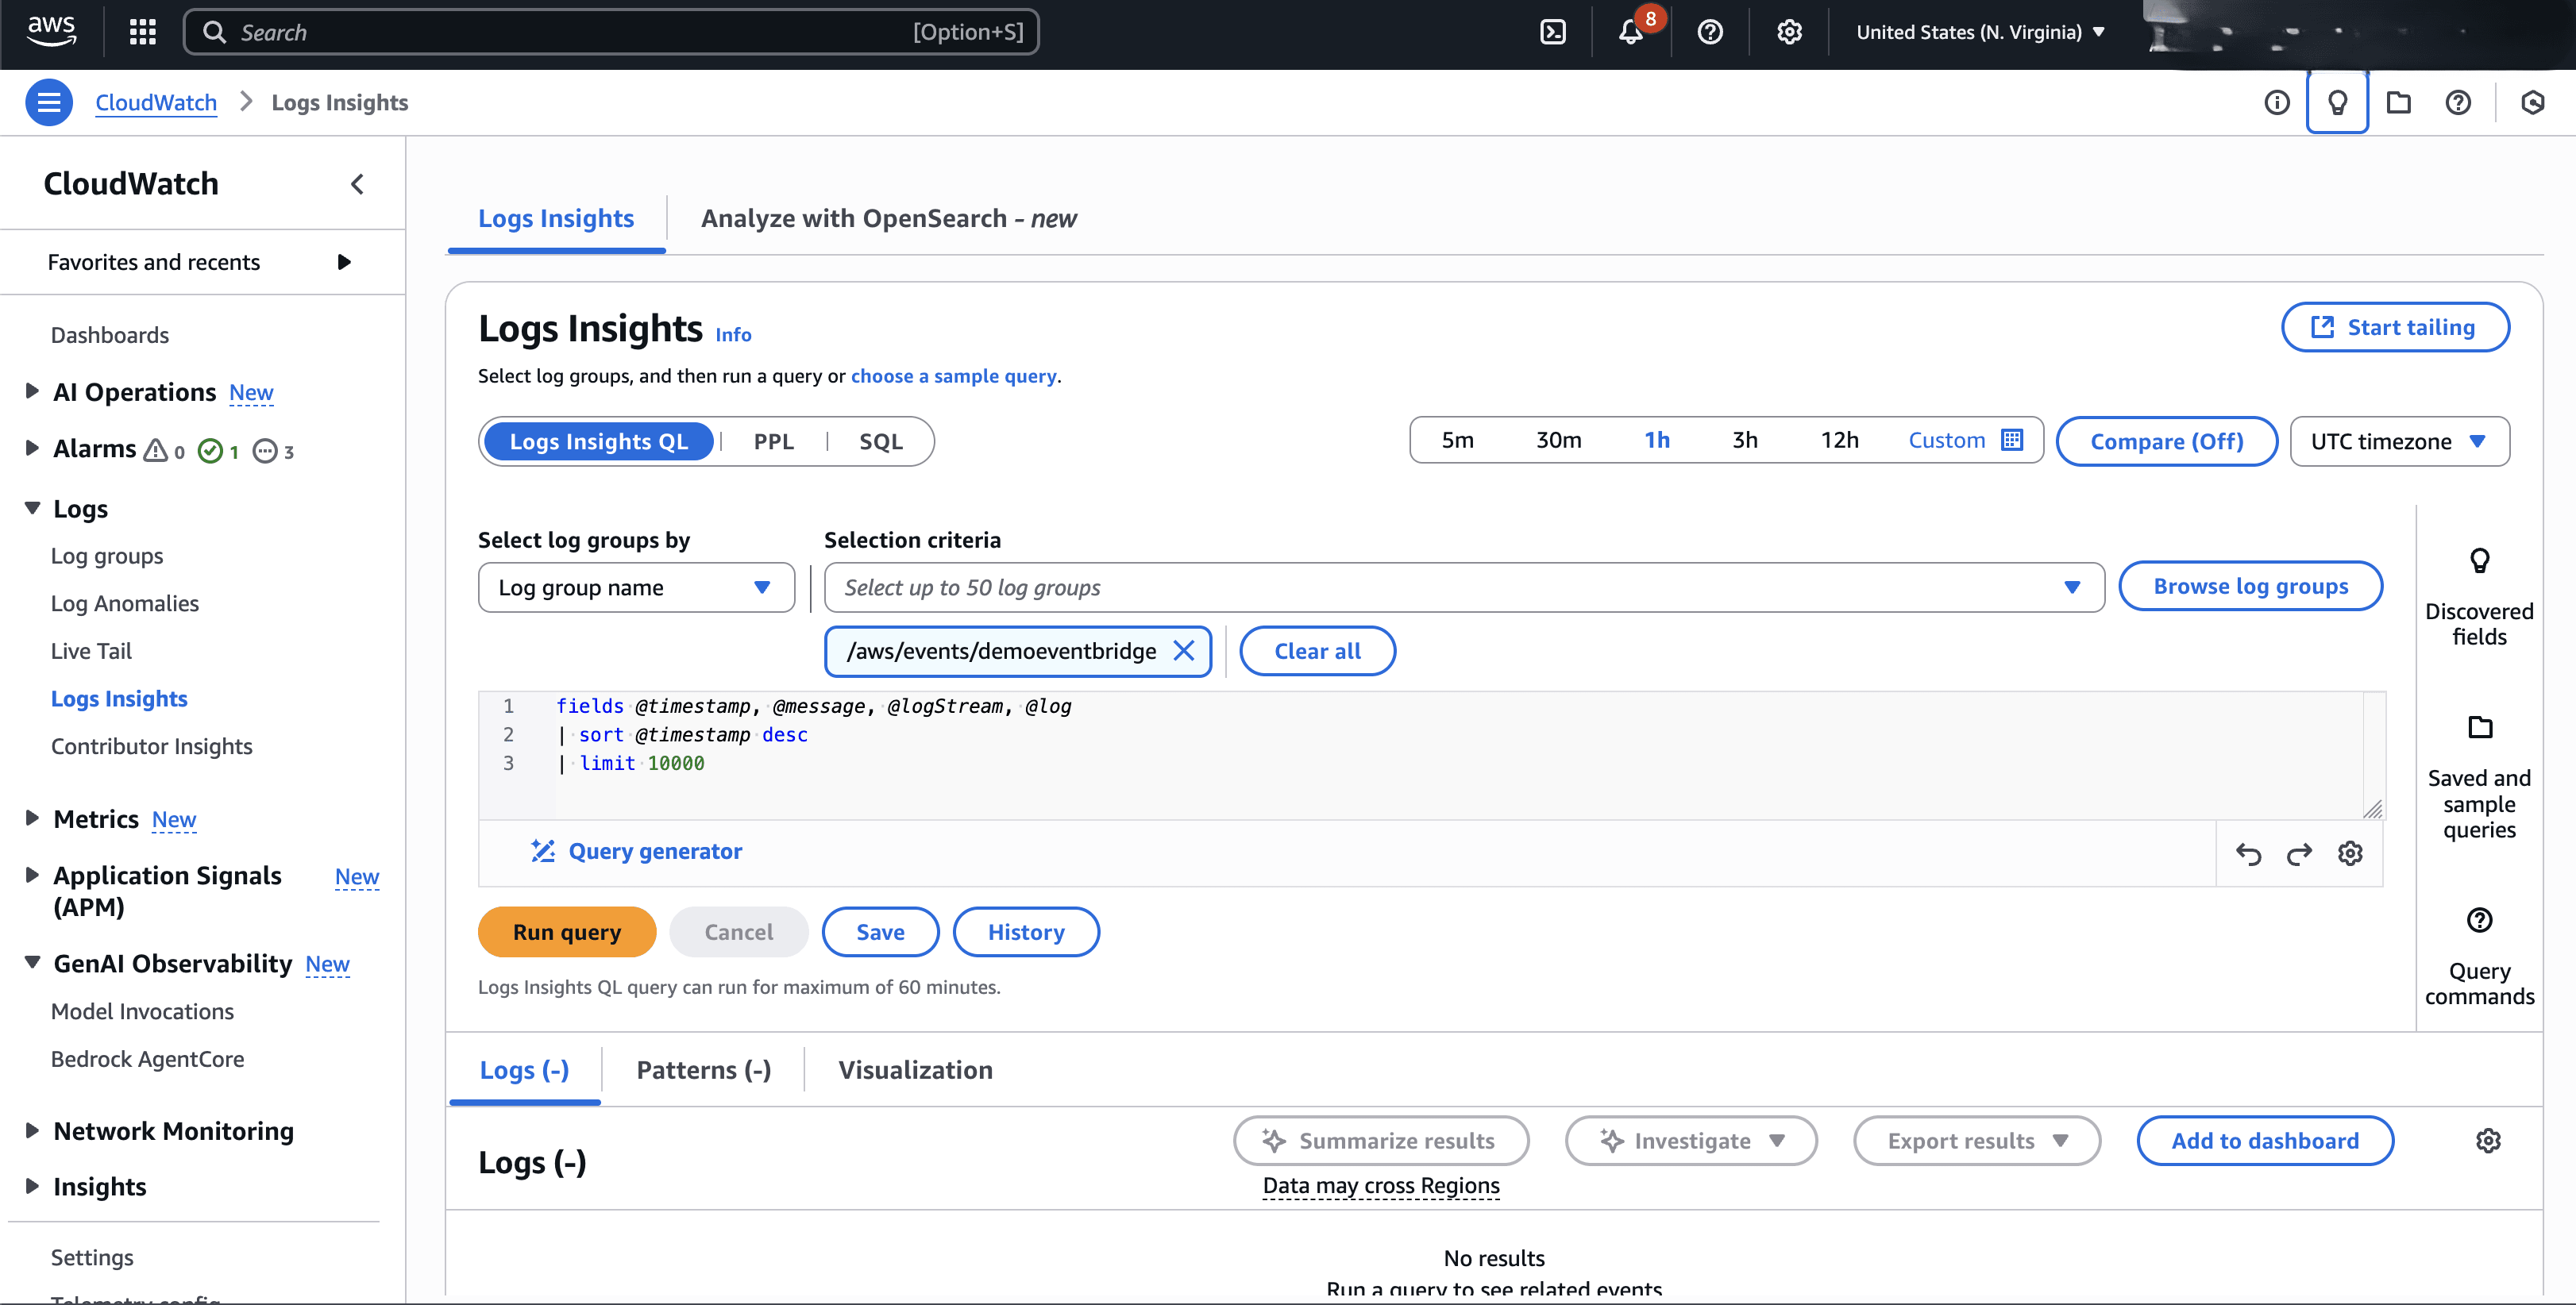
- From AWS console, navigate to CloudWatch.
- From the left menu, expand the Logs section, and then select Logs Insights.
- On the Log Insights page, select the Logs insights QL tab. Select the Log group name you created in the previous step.
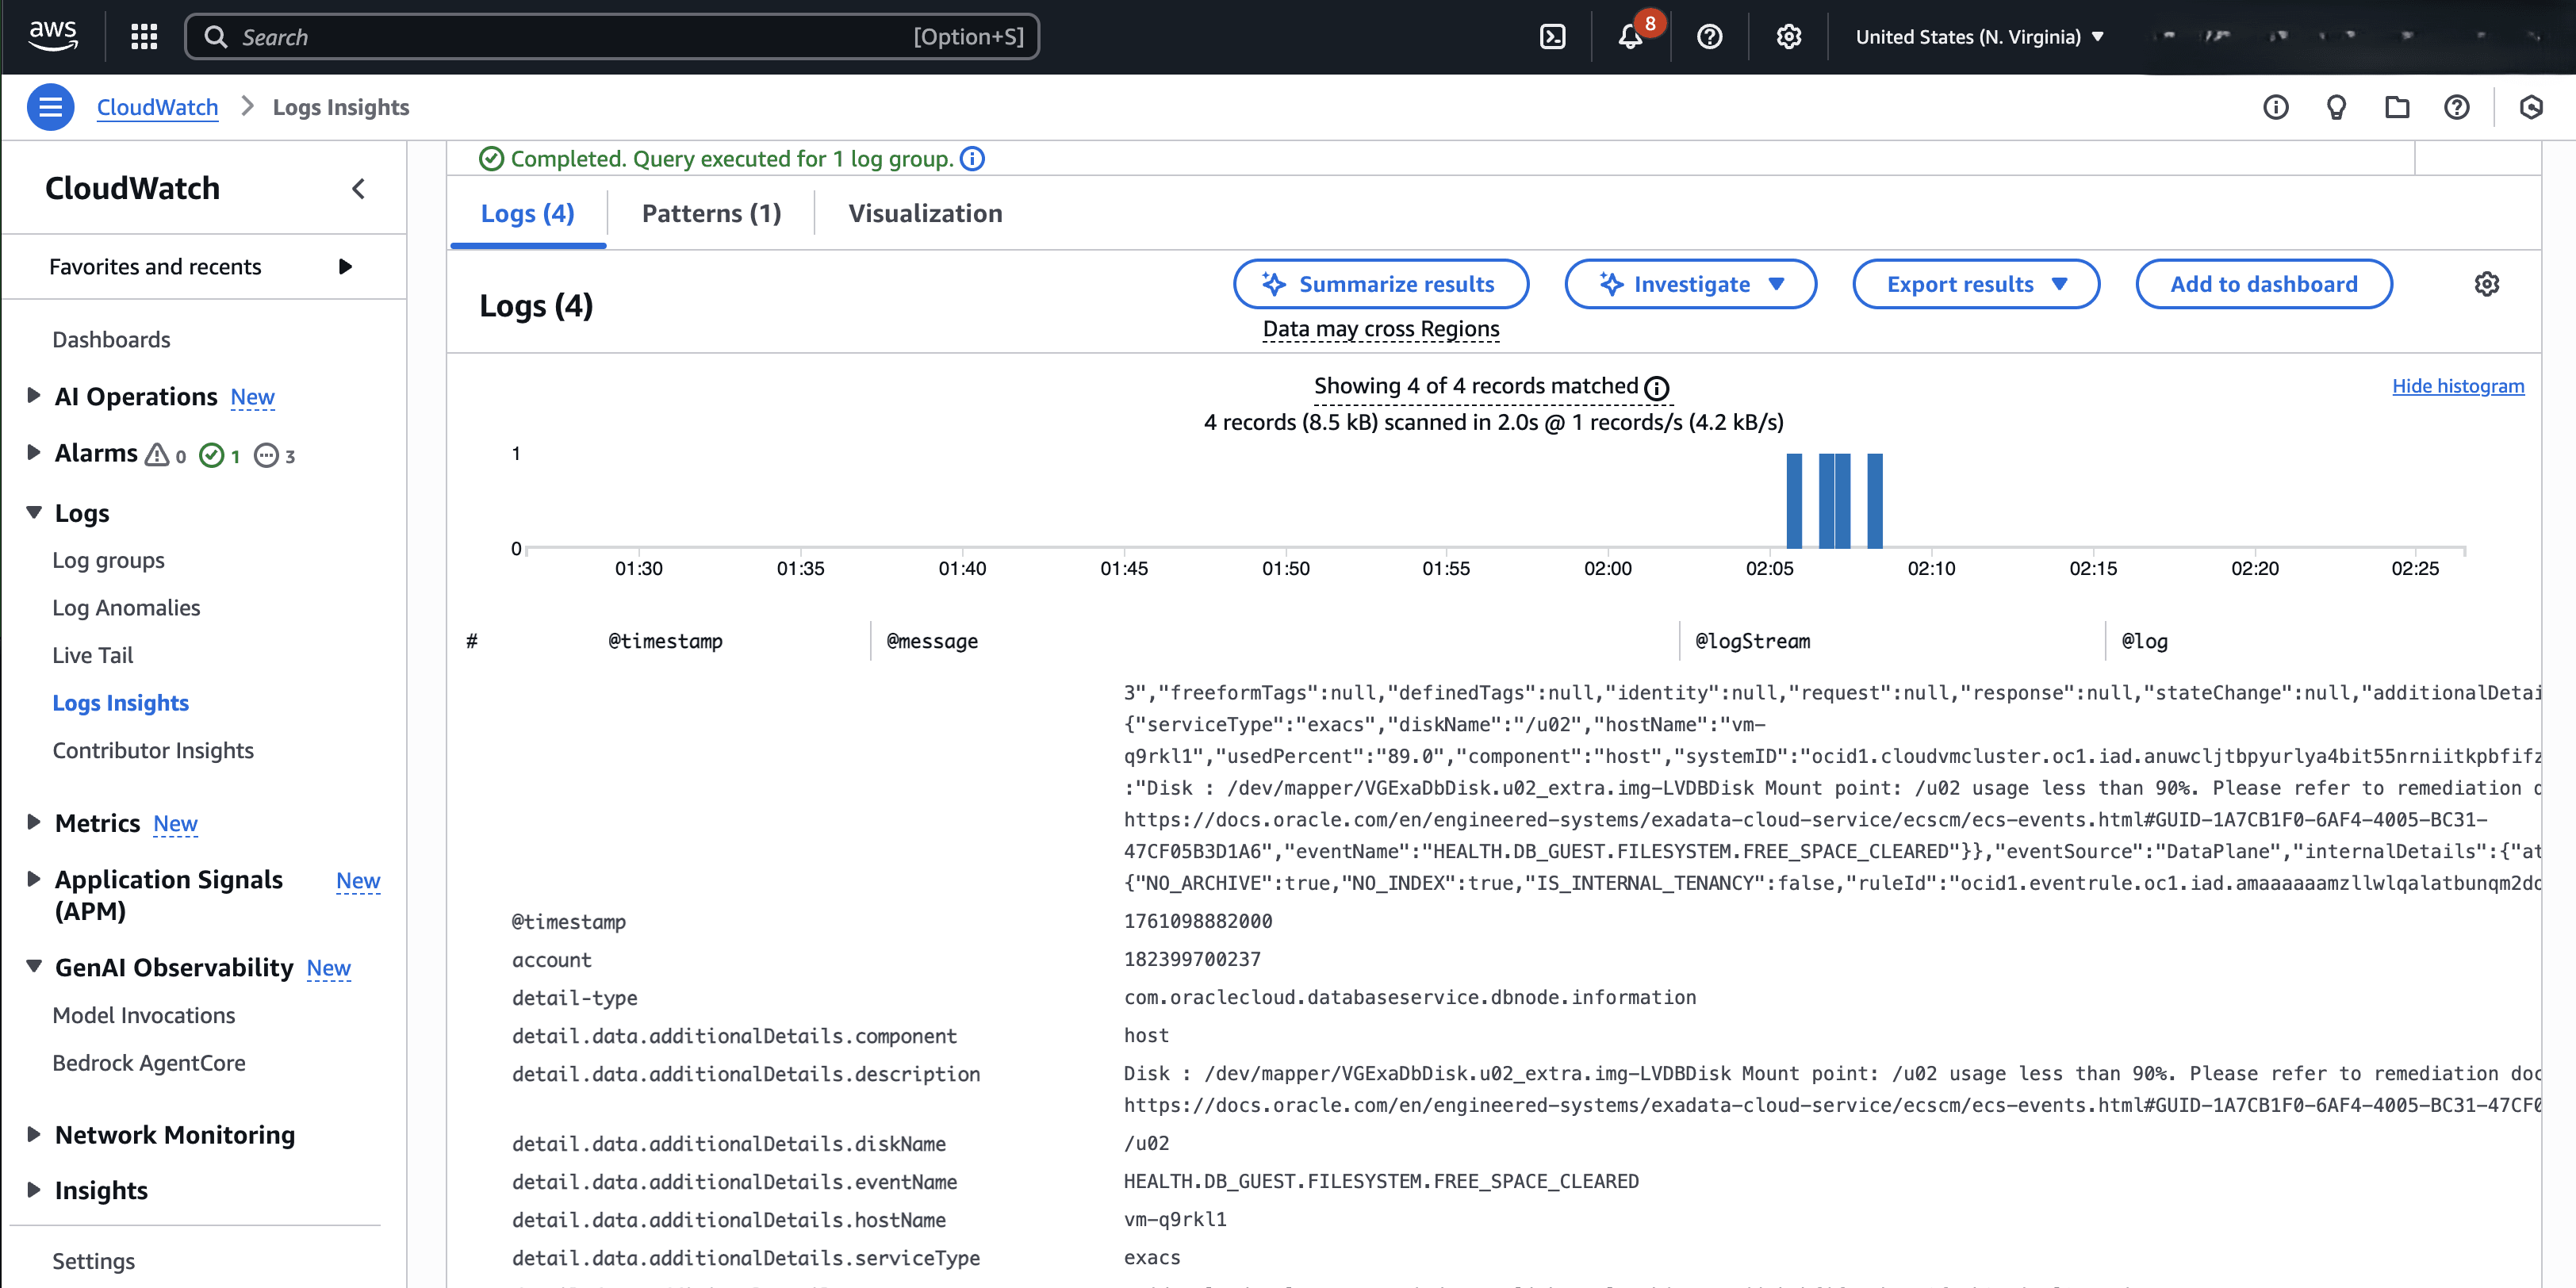
- Select the Run query button using the relevant fields.
Note
You can create field indexes to improve query performance and reduce scan volume. Field indexes help you quickly search large volumes of logs across multiple log groups and locate relevant logs more efficiently. For more information, see Create field indexes to improve query performance and reduce scan volume.
- You can select the logs returned by your query to view additional details.

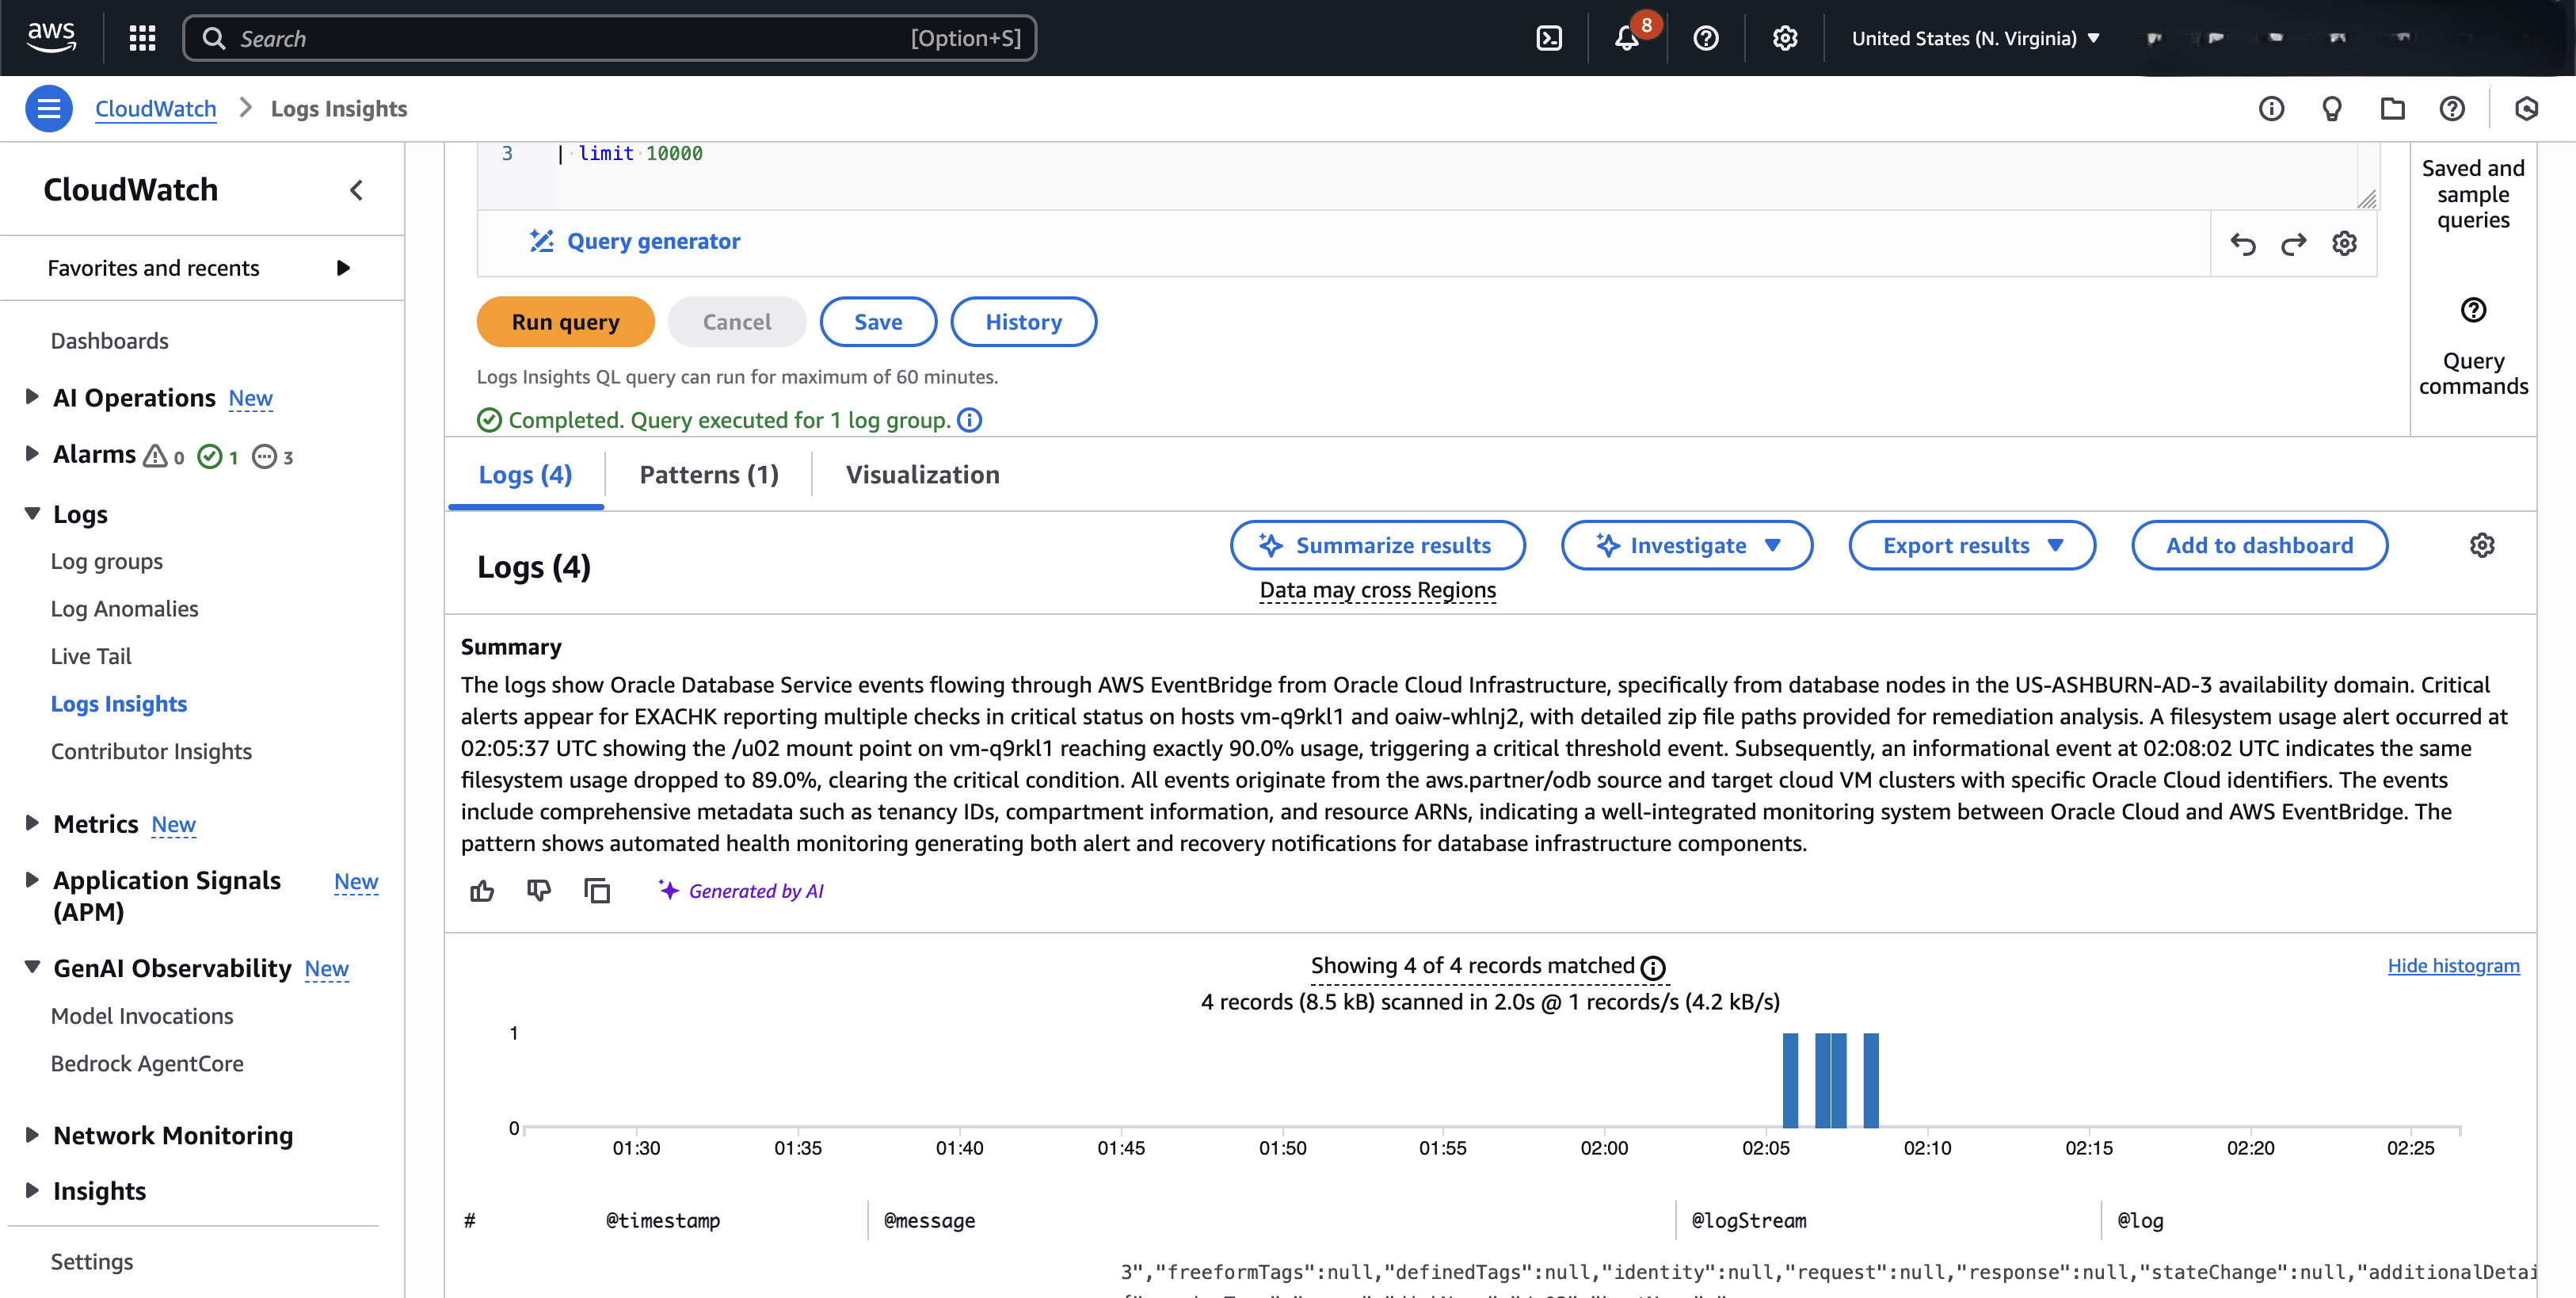
- Alternatively, you can select the Summarize results button to view a detailed summary of the logs generated by insights.

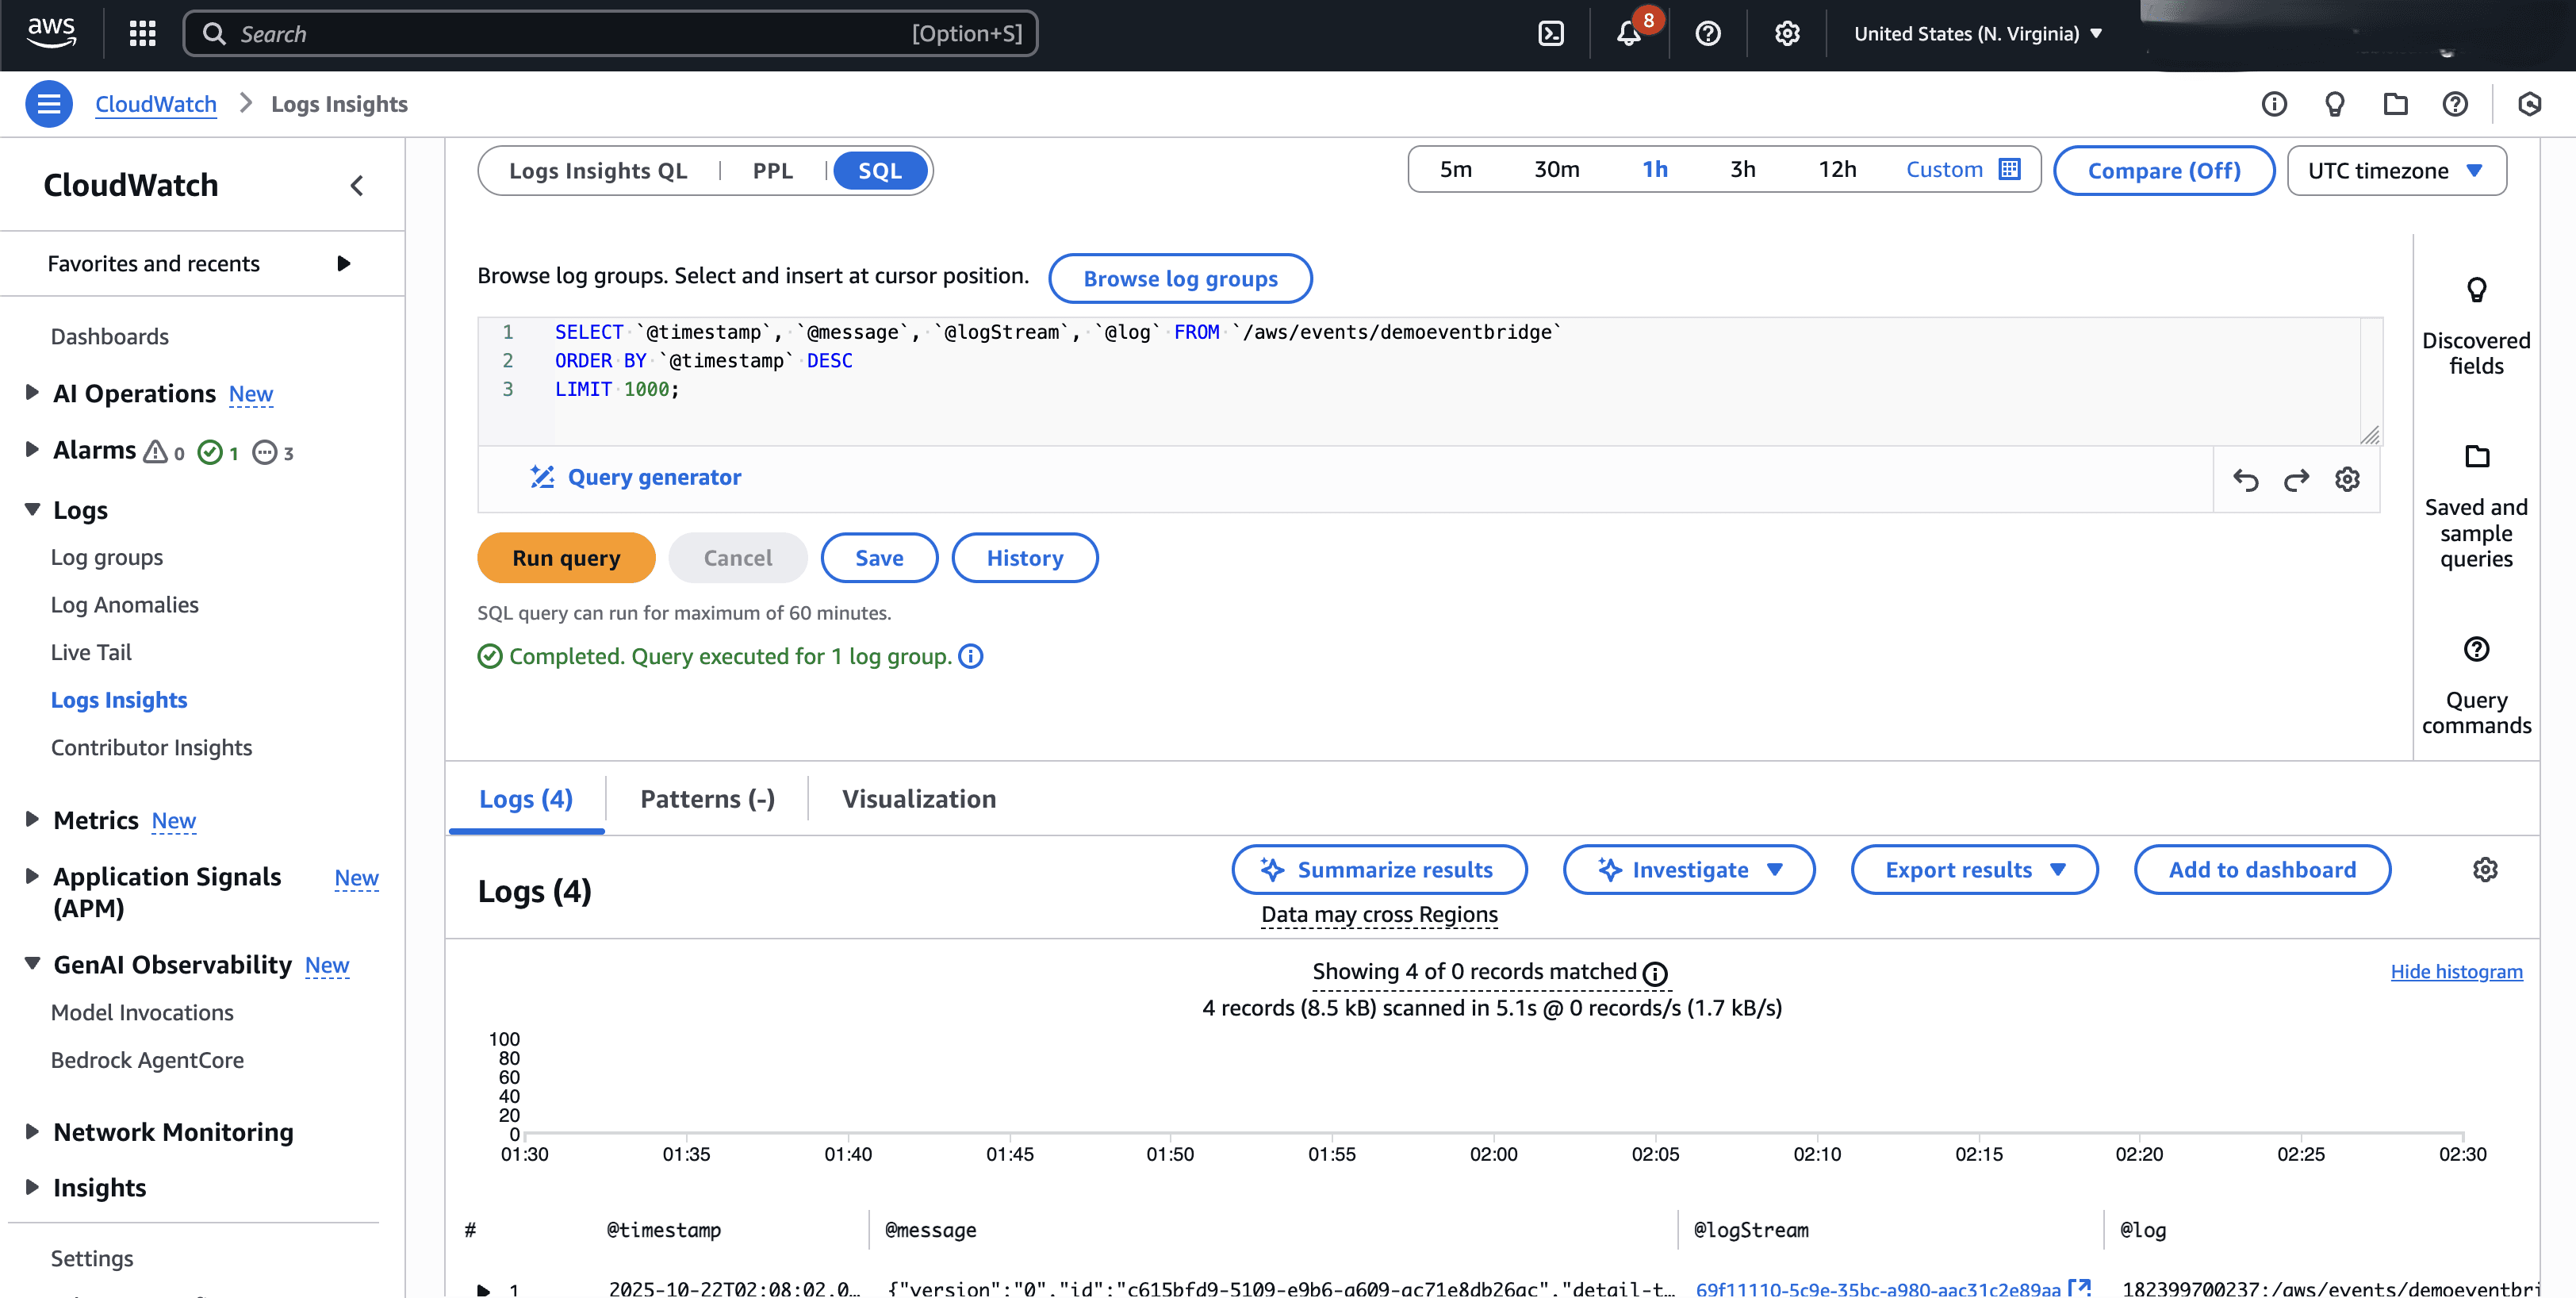
- If you are familiar with SQL, Logging Insights provides a SQL-like query language for ad-hoc queries and analysis. You can use familiar constructs such as
SELECT, FROM, WHERE, GROUP BY, HAVING,and other commands and functions. The language supports joins and correlations across log sources, including the use of sub queries, and offers comprehensive JSON, mathematical, string, and conditional functions for advanced analysis of log and security data.