| Oracle® Java Micro Edition Connected Device Configuration Runtime Guide Release 1.1.2 for Oracle Java Micro Edition Embedded Client A12345-01 |
|
 Previous |
 Next |
| Oracle® Java Micro Edition Connected Device Configuration Runtime Guide Release 1.1.2 for Oracle Java Micro Edition Embedded Client A12345-01 |
|
 Previous |
 Next |
One of the principal goals of CDC is to leverage conventional Java SE developer tools for use with CDC applications and devices. This chapter shows how to integrate the CDC Java runtime environment with Java SE developer tools like javac, jdb, and jvmtihprof, in addition to integrated development environments such as NetBeans.
javacCompiling Java source code is a separate process from execution. All that is needed is application source code, a Java compiler like javac and an appropriate Java class library to compile against. In this way, a developer can compile a Java application on a desktop system and later download it onto a target device for testing or deployment.
This chapter first reviews the API relationship between the CDC and Java SE platforms. Then it shows how javac compiles a Java class for the Java SE platform and how this process changes for CDC. Finally, it shows how to compile an example CDC program.
It is possible to take unmodified application software that was compiled for the Java SE platform and run it on a CDC Java runtime environment because the CDC Java virtual machine can load and execute Java classes that are compliant with the class specification for the Java SE platform.
Figure 6-1 describes the API relationship between the CDC and Java SE platforms. The two platforms have much in common, including most of the core Java class library. Differences between the CDC and Java SE APIs can cause discrepancies at runtime. These differences are based on the need to remove or change certain classes for memory, functionality or performance reasons.
Figure 6-1 CDC and Java SE API Compatibility
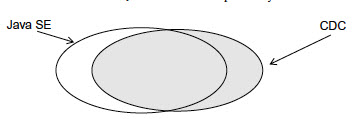
There are four major differences between the CDC and Java SE platforms:
Some Java SE packages, classes and methods have been removed because they are not appropriate for smaller devices. Compiling application source code against the Java SE class library may work, but the compiled classes may fail to run on a CDC Java runtime environment because the classes are not available at runtime.
Some packages like java.sql are present in the Java SE platform but not in CDC, though they may be added as an optional package. In this case, compiling application source code against the Java SE class library may work but running the compiled classes against the CDC Java runtime environment may not.
Most Java SE deprecated methods have been removed from CDC. For example, java.awt.List.clear() is deprecated in JDK version 1.1 and replaced with java.awt.List.removeAll(). In this case, compiling a Java SE application that uses this deprecated method against the CDC Java class library cause javac to fail to compile because it cannot find the deprecated method.
CDC includes CLDC compatibility classes that are not included in the Java SE class library. In this case, compiling CDC source code against the Java SE class library might cause javac to fail to compile because these compatibility classes are not present in the Java SE class library.
Therefore, in practice, it is best to recompile Java source code for a Java SE application against a CDC Java class library. Finally, the CDC Java class library is modular and can change based on the needs of a product design. Most of this modularity is based on profiles and optional packages. See Section 1.6, "Java ME API Choices" for an explanation of how CDC APIs can vary.
Figure 6-2 shows how javac compiles Java source code for the Java SE platform. When javac processes Java source code, it uses a Java class library to discover type information about the classes used in the source code. By default, this is the Java SE class library located in jre/lib/rt.jar.
Figure 6-2 Compiling Java Source Code for the Java SE Platform
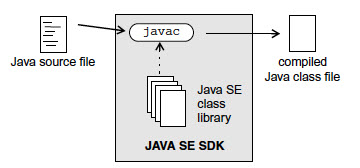
For example, when javac encounters a Java type reference like java.util.BitSet, it gets the type information from the Java SE class library at compile time. Later, at runtime, when the Java virtual machine creates an object of type java.util.BitSet, it also gets the type information from the Java SE class library.
The same javac compiler used for developing Java SE applications can be used to compile Java source code for the CDC Java runtime system. The key is to use a different target Java class library to compile against. Figure 6-3 shows how the javac compiler uses the -bootclasspath command-line option to specify an alternate target Java class library as a cross-compilation target.
Figure 6-3 Compiling Java Source Code for CDC
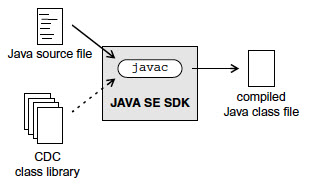
The mechanics of using javac to compile Java source code for CDC differ slightly from those used for the Java SE platform.
Section 1.5, "Java Micro Edition Technology Standards", Section 1.6, "Java ME API Choices", and Figure 1-2 show how the API functionality of a specific CDC product implementation can vary based on choices made at design time. Therefore, it is important to use a target development version of the CDC Java class library that represents the APIs available in the configuration, profile and optional packages on the target device.
|
Note: See the companion document CDC Build System Guide for information on how to build a target development version of the CDC Java class library which represents the combination of configuration, profile and optional packages for the target device |
javac Command-Line OptionsThe page http://download.oracle.com/javase/6/docs/technotes/tools/windows/javac.html describes the javac cross-compilation options. These are summarized in the following subsections.
-classpath classpathSets the user class search path, which is useful for compiling against third-party class libraries.
-bootclasspath classpathSets the system class search path. With javac, this option overrides the Java SE class library and specifies an alternate target Java class library for cross-compilation like the target development version of the CDC Java class library.
-extdirs classpathSets the extensions class search path for optional packages. The CDC default location is the lib directory, except for some security optional packages which are found in the lib/ext directory.
-source releaseSpecifies the version of Java source code accepted. In practice, this controls the use of Java programming language syntax that conflicts with identifier names. For example, J2SE 1.4 includes support for the assert keyword and J2SE 1.5 includes support for generics. Therefore, an int named assert is legal in 1.3 and illegal in 1.4. The release argument can be set to 1.3, 1.4, 1.5 (or synonym 5), or 1.6 (or synonym 6) for CDC application development.
You can remotely debug a CDC application with most debuggers that support the Java Virtual Machine Tool Interface (JVMTI) described in http://download.oracle.com/javase/6/docs/platform/jvmti/jvmti.html. The most likely choices are the NetBeans, Oracle JDeveloper, and Eclipse integrated development environments, but you can also use the Java SE jdb command line debugger or another compatible debugger. You run the debugger on a development host, and the application plus CDC on the target device. CDC and the debugger communicate over a network.
CDC debugging has the following limitations:
Only interpreted code can be debugged.
CDC-debugger connections must use sockets. Shared memory connections are not supported.
cvm in Debug ModeRegardless of the debugger you choose, you launch cvm running the application in the same way.
|
Note: For the Oracle Java ME Embedded Client, cvm is installed on your system in the following location:InstallDir/Oracle_JavaME_Embedded_Client See the Oracle Java Micro Edition Embedded Client Reference Guide for detailed information about launching |
cvm Debug Mode SyntaxExample 6-1 and Example 6-2 show how to launch cvm in debug mode on a target host. These examples assume that the target host runs a Unix-style operating system and that socket networking is operational. Make adjustments as necessary for your target host. For the Oracle Java ME Embedded Client, see the Oracle Java Micro Edition Embedded Client Reference Guide for the appropriate command syntax and suboptions used to launch cvm in debug mode.
For a list of debug suboptions, run cvm -agentlib:jdwp=help or refer to http://download.oracle.com/javase/1.5.0/docs/guide/jpda/conninv.html.
Example 6-1 cvm Listens for Connection from Debugger
% cvm -agentlib:jdwp=transport=dt_socket,server=y,address=port -Xdebug ...
Example 6-2 cvm Connects to Debugger
% cvm -agentlib:jdwp=transport=dt_socket,server=n,address=host:port -Xdebug ...
When launching cvm in debug mode, observe the following requirements:
-agentlib:jdwp and the transport and address suboptions must be specified.
The transport value must be dt_socket.
Set server to y to direct cvm to listen for a connection from the debugger (the most likely case). Set server to n to direct cvm to attach to a listening debugger.
If server=y, set port to the socket port on the target host at which cvm listens for a connection. If server-n, set host:port to the host and socket port at which the debugger waits for a connection from cvm.
-Xdebug disables the compiler so the virtual machine interprets the application's bytecodes.
cvm Debug Mode ExampleExample 6-3 shows a simple example of launching cvm as a server to debug a HelloWorld application.
cvmAlthough this section describes the NetBeans debugger, other IDE debuggers that are compatible with the Java Virtual Machine Tool Interface (JVMTI) can be used similarly. This section first describes the most common arrangement in which cvm acts as a server for the debugger, then the converse case.
Load the NetBeans project you want to debug and create a debugger operation, such as a breakpoint. Figure 6-4 shows an example.
Ensure that the project's compiled class files are accessible to the target host and that the class files correspond to the source files loaded in the IDE.
On the target host, launch cvm with server=y and, for this example, address=8000, similar to the example in Section 6.2.1.2, "cvm Debug Mode Example".
In NetBeans, choose Debug > Attach Debugger.
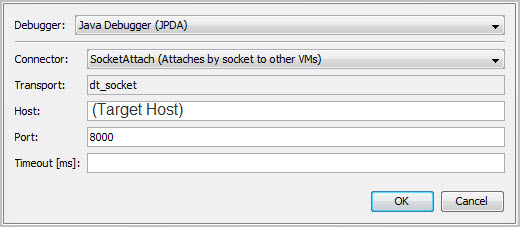
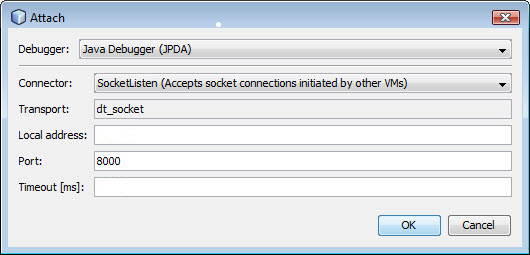
Set up the Attach Debugger dialog as shown in Figure 6-5.
Substitute the target host name for (Target Host).
Figure 6-5 Attach Debugger Dialog (Debugger as Client)
The debugger connects and indicates that execution has stopped at the breakpoint as similar to Figure 6-6.
Figure 6-6 Debugger Connected and Stopped at Breakpoint
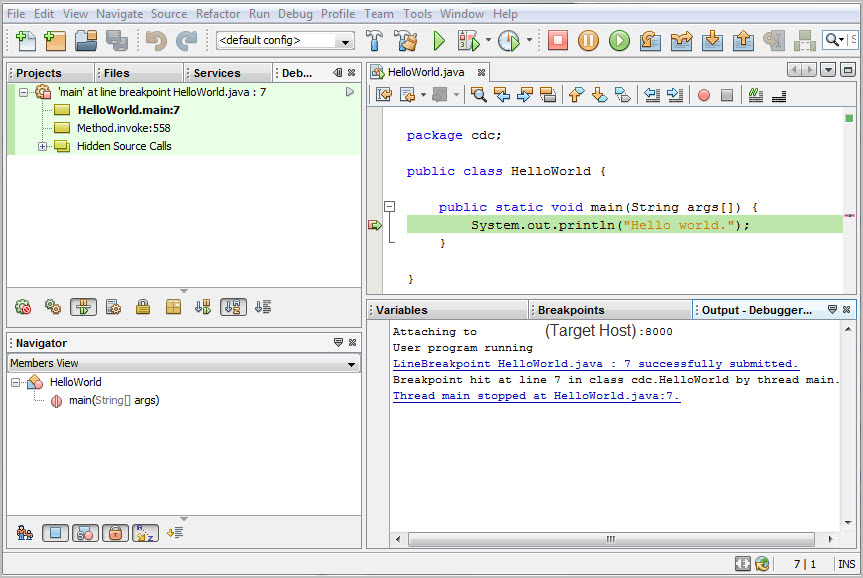
If you want the debugger to be the server, complete the Attach Debugger dialog similar to Figure 6-7. After clicking OK, launch cvm on the target host with server=n and address= the debuggers' host and port.
Figure 6-7 Debugger as Server Attach Debugger Setup
cvm with jdbAfter launching cvm as a debug server (see Section 6.2.1.2, "cvm Debug Mode Example") on the target host, you can connect to it with the jdb command line debugger using syntax similar to Example 6-4. The jdb command is in JavaSEinstall/bin/.
Profiling is the acquisition of runtime performance data for an application on a target runtime system. Understanding the runtime behavior of an application allows the developer to identify performance-sensitive components when tuning an application's implementation or selecting runtime features. cvm profiling provides reports that include CPU usage, heap allocation statistics, and monitor contention profiles. See http://java.sun.com/developer/technicalArticles/Programming/HPROF.html for more information.
This section describes two profiling options using a HelloWorld example application:
This section describes how to profile remotely with the NetBeans IDE. The steps are:
Calibrate the Profiler Agent (a one-time operation)
Before you begin, ensure that the project's compiled class files are accessible to the target host and correspond to source files loaded in the IDE. Also be sure that the profiler agent native classes are accessible on the target host. For platforms directly supported by CDC (see the Build Guide), the build creates the profiler agent as a .so or .dll library called profiler interface. For platforms that use a CDC port, the details of the profiler agent are platform-specific.
|
Note: This section covers only the basics of remote profiling. Read the NetBeans online help if you need more information on the subject. This section was created with the NetBeans version 6.7.1 IDE. |
On the target host, calibrate the profiler agent by issuing commands equivalent to those shown in Example 6-5 or, for the Oracle Java ME Embedded Client, see the Oracle Java Micro Edition Embedded Client Reference Guide for commands and procedures used on both Linux and Windows platforms.
Calibration measures the profiler agent overhead so it can be subtracted out of measurements obtained in a profiler run. To run the NetBeans calibrator, the target host must have access to the files jfluid-server.jar and jfluid-server-cvm.jar. These are NetBeans libraries modified for CDC so they consume less target device file system space. The location of these files is target host-dependent.
In the following example, use set CVM_HOME=yourCVM for the Windows operating system. Use export CVM_HOME=yourCVM for Linux operating system.
Example 6-5 Calibrating the Profiler
% set CVM_HOME=yourCVM
% $CVM_HOME/bin/cvm \
-classpath $CVM_HOME/lib/profiler/lib/jfluid-server.jar:\
$CVM_HOME/lib/profiler/lib/jfluid-server-cvm.jar \
-Djava.library.path=$CVM_HOME/bin \
org.netbeans.lib.profiler.server.ProfilerCalibrator
Profiler Agent: JNI On Load Initializing...
Profiler Agent: JNI OnLoad Initialized successfully
Starting calibration...
Calibration performed successfully
For your reference, obtained results are as follows:
Approximate time in one methodEntry()/methodExit() call pair:
When getting absolute timestamp only: 3.085 microseconds
When getting thread CPU timestamp only: 3.1022 microseconds
When getting both timestamps: 5.2254 microseconds

Approximate time in one methodEntry()/methodExit() call pair
in sampled instrumentation mode: 0.7299 microseconds
cvm with the Profiler AgentLaunch cvm with the profiler agent using a command equivalent to that shown in Example 6-6 for a Linux target host or, for the Oracle Java ME Embedded Client, see the Oracle Java Micro Edition Embedded Client Reference Guide for the appropriate commands used to launch cvm with the profiler agent.
Example 6-6 Launching cvm with the Profiler Agent
% set CVM_HOME=yourCVM
% $CVM_HOME/bin/cvm -Xmx32M -agentpath:profilerInstallDir/lib/deployed/cvm/linux/libprofilerinterface.so=profilerInstallDir/lib,5140 -cp /home/mydir/myclasses.zip HelloWorld
Profiler Agent: Initializing...
Profiler Agent: Options: >profilerInstallDir/lib,5140<
Profiler Agent: Initialized successfully
Profiler Agent: Waiting for connection on port 5140 (Protocol version: 9)
5140 is the default NetBeans profiler port, which you can change in NetBeans Tools > Options > Miscellaneous > Profiler.
libprofilerinterface.so is a shared native code library. For Windows hosts, it is libprofilerinterface.dll. Building CDC creates the file.
Load the project to be profiled, and choose Profile > Attach Profiler.
The Attach Profiler dialog appears, similar to Figure 6-8.
Near the bottom of the dialog, click define.
The Select Target Type screen appears, similar to Figure 6-9.
Set the values as follows, then click Next>:
Target Type: Application
Attach method: Remote
Attach invocation: Direct
The Remote System screen appears, similar to Figure 6-10.
Enter the target host's name or IP address, select its operating system and Java virtual machine from the drop-down, then click Next>.
The Review Attach Settings screen appears, similar to Figure 6-11.
Figure 6-11 Review Attach Settings Screen
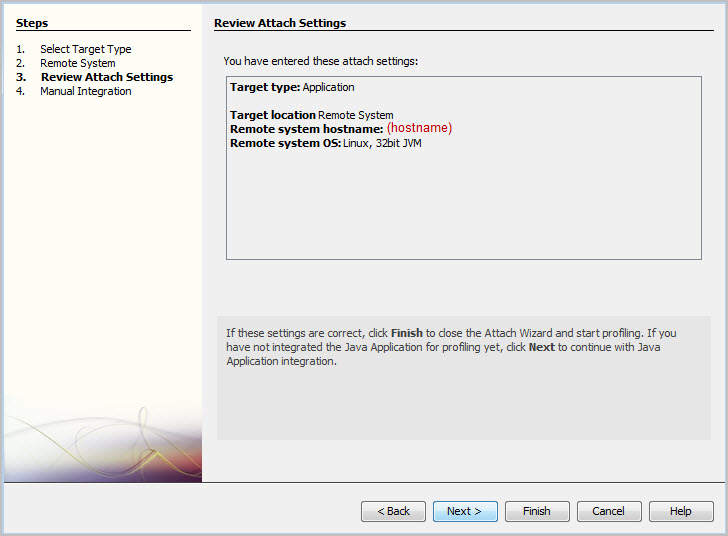
Verify that the settings are correct, then click Next>.
The Manual Integration screen appears, similar to Figure 6-12.
In the Manual Integration screen, click Finish.
In the Attach Profiler dialog click Attach.
Profiling results begin to appear, for example, the heap profile shown in Figure 6-13.
Subsequent profiling runs are simpler because the NetBeans IDE remembers settings:
On the target host, start the application with the -agentpath option shown in Example 6-6.
In the NetBeans IDE, choose Profile > Attach Profiler.
In the Attach Profile dialog, click Attach.
jvmtihprofExample 6-7 is a simple profiling example that creates a file of profiling data for a HelloWorld application.
Example 6-7 Using jvmtihprof
% cvm -agentlib:jvmtihprof -Xbootclasspath/a:./lib/mysamples.jar -classpath /home/mydir/myclasses.zip HelloWorld
Hello world.
Dumping Java heap ... allocation sites ... done.
The -Xbootclasspath option specifies the location of mysamples.jar, which is required for profiling. In this example, no output file name is given, so the profile data is in the default file java.hprof.txt.
The -agentlib:jvmtihprof option controls profiling features. For example:
% cvm -agentlib:jvmtihprof=heap=all,cpu=samples,file=profile.txt ...
Table 6-1 lists the profiling options.
Table 6-1 Profiling Command-Line Options
| Option | Default | Description |
|---|---|---|
-agentlib:jmvtihprof[=option=value, ...] |
|
Run the VM with profiling enabled using options specified |
heap=dump|sites|all |
all |
Heap profiling |
cpu=samples|times|old |
off |
CPU usage |
monitor=y|n |
n |
Monitor contention |
format=a|b |
a |
ASCII or binary output |
file=name
|
java.hprof.txt |
Write data to file name and append |
net=host |
(off) |
Send data over a socket |
depth=size
|
4 |
Stack trace depth |
cutoff=value
|
0.0001 |
Output cutoff point |
lineno=y|n |
y |
Display line numbers in traces |
thread=y|n |
n |
Thread in trace |
doe=y|n |
y |
Dump on exit |