Creating Filters for Columns
A filter limits the results that are displayed when an analysis is run. Together with the columns that you select for the analysis, filters determine what the results contain. You specify filter criteria to display only the results that you want to show.
For more information, see About Filters and Selection Steps.
Creating Inline and Named Filters
In most cases, you create and include a filter "inline" for use in only one analysis. You can also create a named filter to reuse the filter across all analyses and dashboards. Unless you want to reuse the filter, create an inline filter.
For example, as a sales consultant, you can filter the results that are shown in an existing Brand Revenue analysis. In this way, you can see revenue for only those brands for which you are responsible.
To create an inline filter from the Selected Columns pane on the Criteria tab:
-
Open the analysis for editing.
-
On the Selected Columns pane of the Criteria tab, click Options beside the column name and select Filter.
The New Filter dialog is displayed. See Specifying Values for Filters.
To create an inline filter from the Filters pane on the Criteria tab:
-
Open the analysis for editing.
-
On the Filters pane of the Criteria tab, click Create a filter for the current Subject Area.
-
Select a column name from the menu.
The New Filters dialog is displayed. See Specifying Values for Filters.
To create a named filter:
-
On the toolbar, click New and select Filter.

Description of the illustration filtering06.gif
-
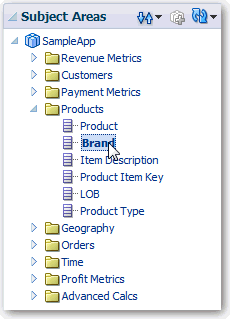
On the Subject Area pane, double-click a column.

Description of the illustration filtering08.gif
The New Filter dialog is displayed. See Specifying Values for Filters.
Specifying Values for Filters
You can specify the values for a filter that displays in an analysis to only those values in which you are interested. For example, in the Brand Revenue analysis, a filter can limit the analysis results to only the first quarter values in three years. As a result, you can discover how revenue performed year-to-year in these quarters.
To specify values for a filter:
-
Complete one of the procedures as described in Creating Filters for Columns.
-
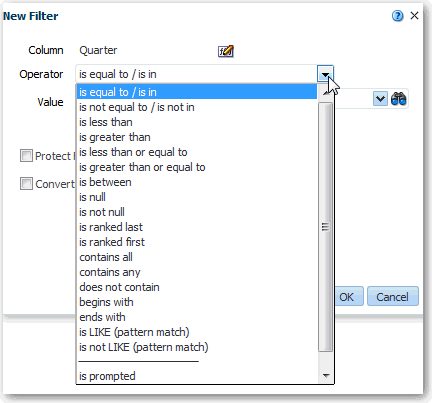
In the New Filter dialog, select the appropriate operator such as is equal to / is in. See About Prompted Filters for information about the is prompted operator.

Description of the illustration filtering11.gif
-
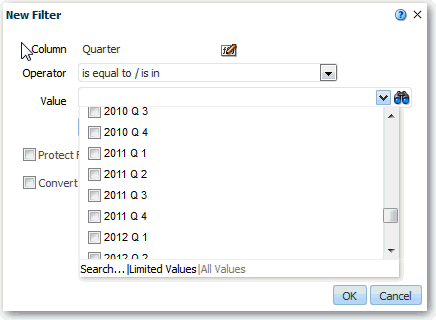
Select values from the list or click the Search icon to find more values from which to select.

Description of the illustration filtering12.gif
-
(Optional) Select Protect Filter to prevent prompts from overwriting the filter. For information, see Editing Filters for Columns.
-
(Optional) Select Convert this Filter to SQL. For information, see Editing Filters for Columns.
-
Click OK.
For inline filters, the filter is displayed in the Filters pane on the Criteria tab.

Description of the illustration filtering15.gif
For named filters, the filter is displayed in the Saved Filters pane.

Description of the illustration filtering14.gif
After specifying values, save the filter as named or inline, as described in Saving Filters.
Saving Filters
When you create an inline filter in the Filters pane, you can optionally save the inline filter as a named filter. When you save an inline filter as a named filter, other people on your team can use this filter in a new analysis. You can also create a named filter as a standalone object from the global header.
For example, you can save a filter for the Quarter column in a shared folder in the catalog. As a result, your manager has access to that filter. Suppose that you save the filter that limits quarters to 2011 Q1, 2012 Q1, and 2013 Q1. Your manager can use this filter in a Product Revenue analysis to find how products performed only during these quarters.
To save an inline filter as a named filter:
-
On the Filters pane on the Criteria tab, click More options and select Save Filters.
-
Specify a folder in the Oracle BI Presentation Catalog.
-
Click OK.
To save a named filter:
-
On the toolbar, click Save As.
-
Specify a folder in the Oracle BI Presentation Catalog.
-
Click OK.