About Views
A view is a visualization that helps communicate an outcome. Views enable you to look at results of analyses in meaningful, intuitive ways. Views give you different ways of looking at your data to help you discover patterns, trends, outliers, and other interesting characteristics of your data.
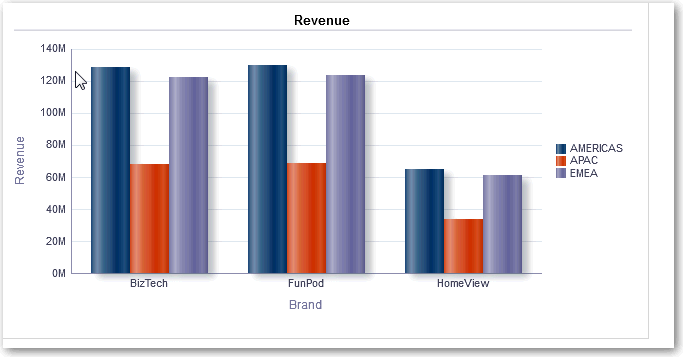
You can add a variety of views to the results, such as graphs and pivot tables that allow drilling down to more detailed information, explanatory text, a list of filters that were used to limit the results, and more. For example, you can include a bar graph view of revenue.

Description of the illustration views58.gif