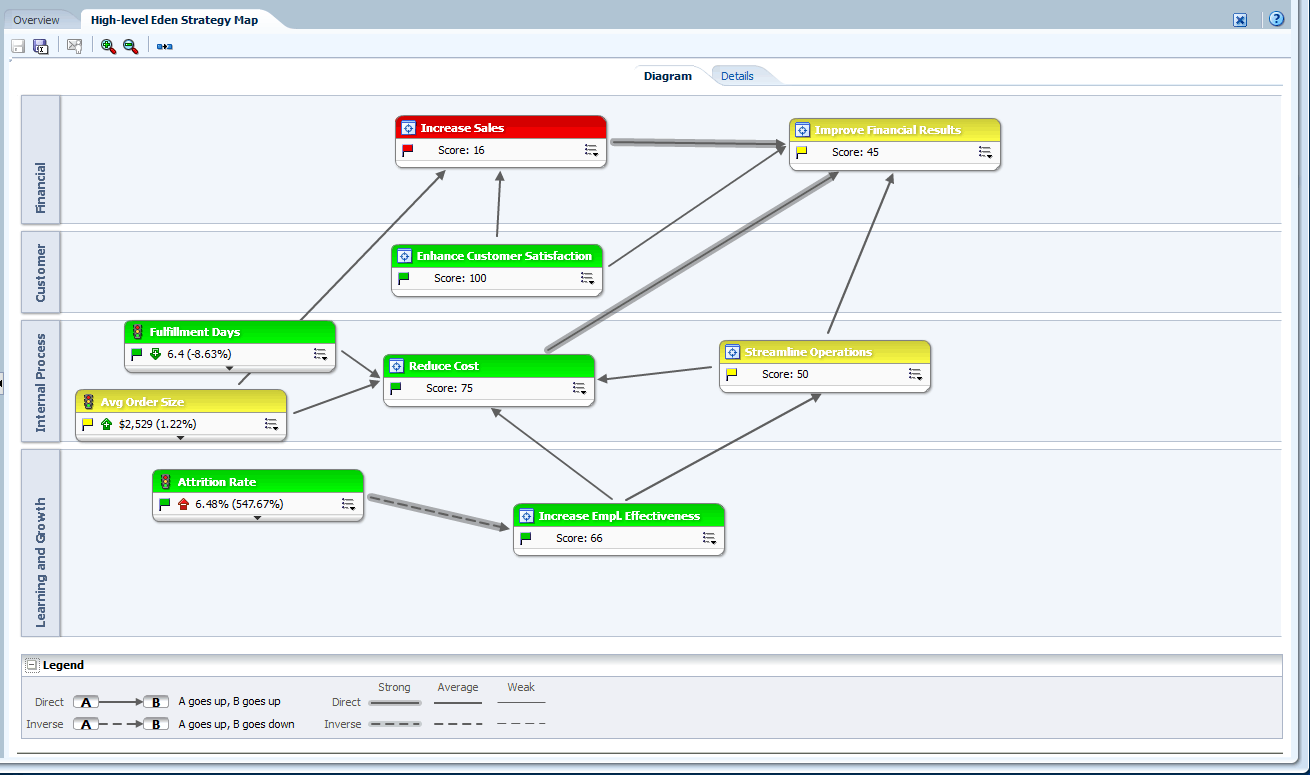
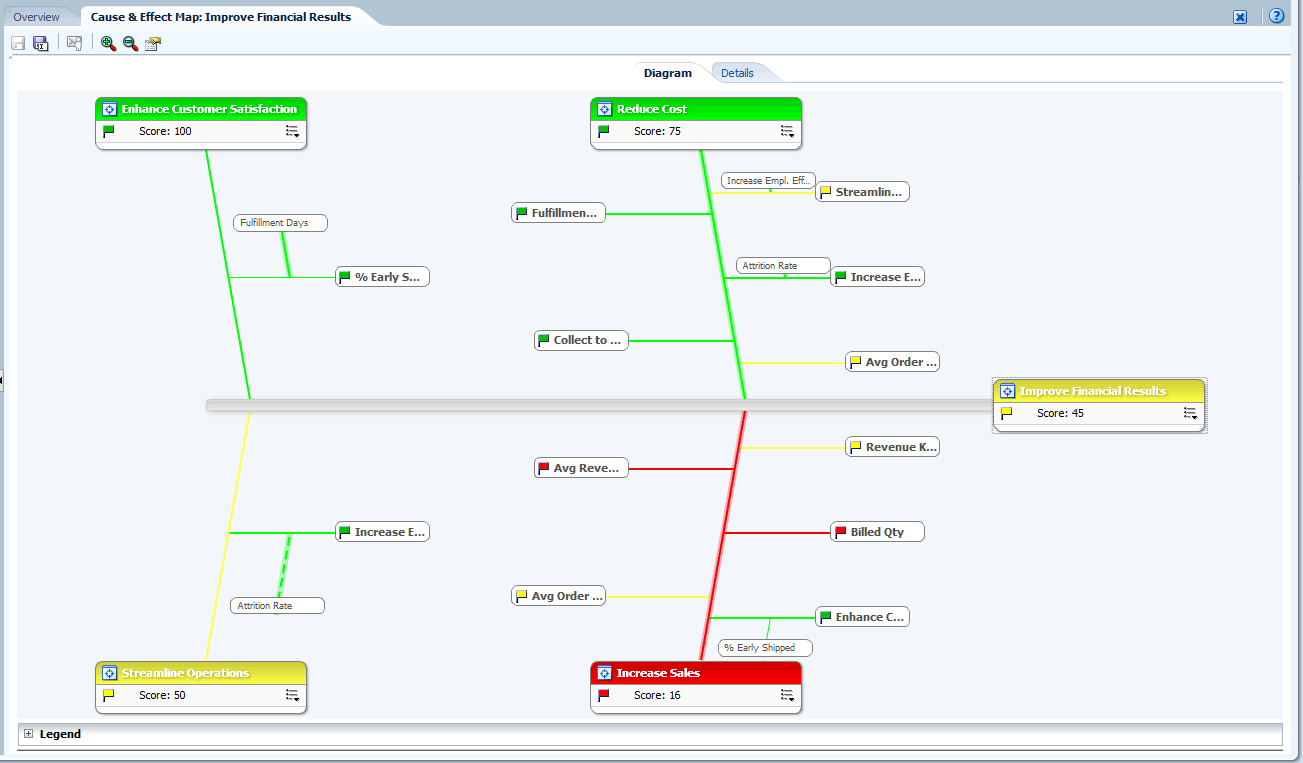
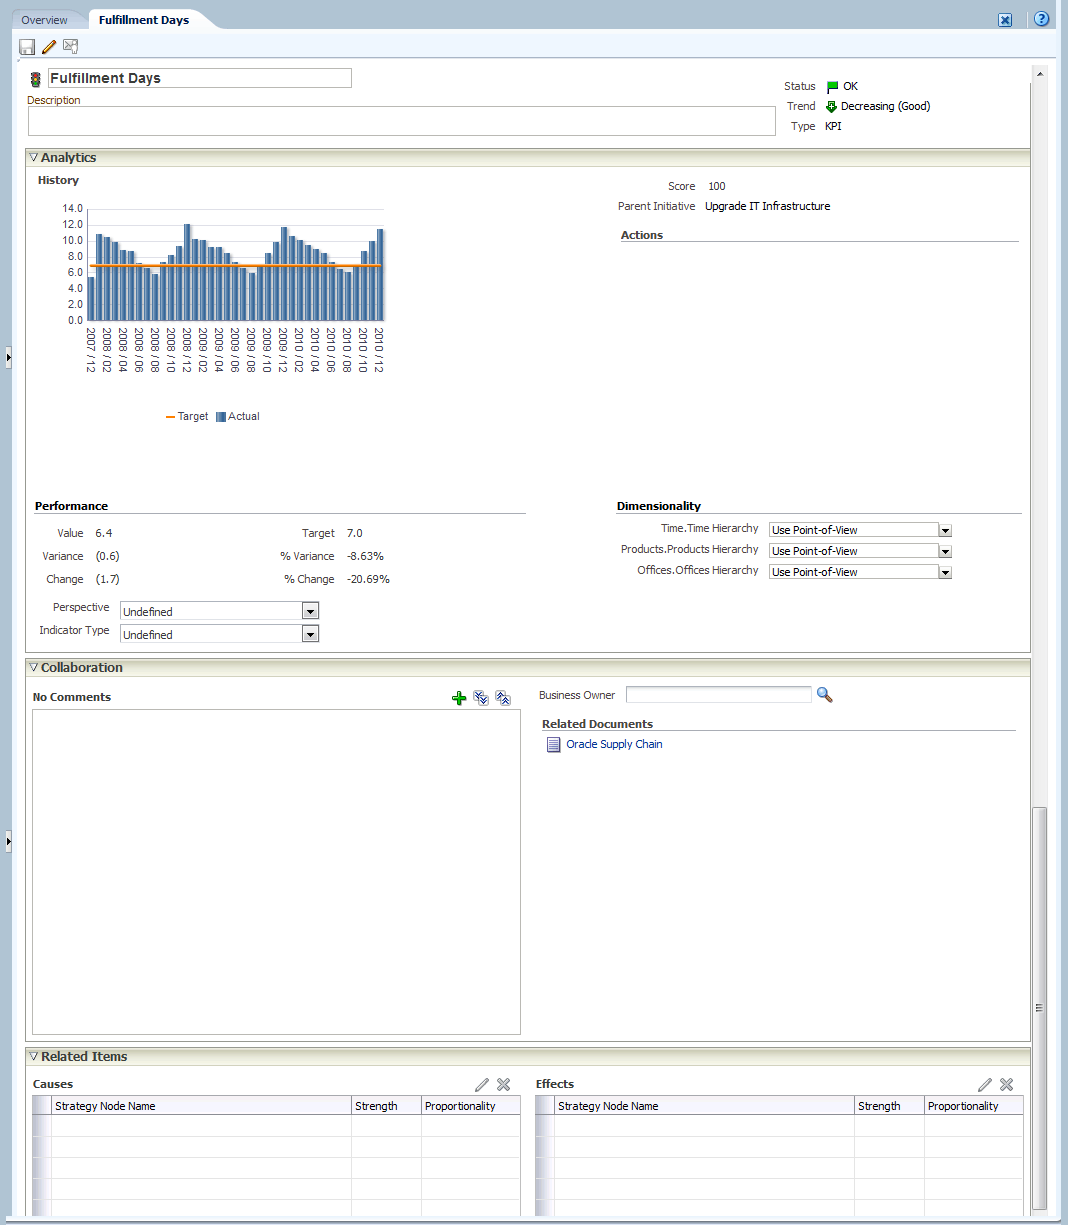
12 Scorecarding
This chapter provides information on Oracle Scorecard and Strategy Management in Oracle Business Intelligence Enterprise Edition. It describes scorecards and explains how to work with them to describe and communicate your business strategy. It provides details on the scorecard objects that you work with, including vision and mission statements, perspectives, objectives, initiatives, strategy trees, strategy maps, cause & effect maps, custom views, and watchlists.
This chapter includes the following sections:
-
"Understanding Initiative or Objective Performance Assessment"
-
"Assigning Weights to Child Objectives, Initiatives and KPIs"
What Is Oracle Scorecard and Strategy Management?
Oracle Scorecard and Strategy Management is a performance management tool that lets you describe and communicate your business strategy. You can drive and assess your corporate strategy and performance from the top of your organization down, or from the bottom up.
Oracle Scorecard and Strategy Management also enables you to either align your objectives and initiatives with traditional balanced scorecard perspectives, or to create your own to reflect your fundamental business competencies. See "What Is a Balanced Scorecard?" for additional information.
Use Oracle Scorecard and Strategy Management to:
-
Simultaneously define the objectives (that is, goals such as Decreased Operational Costs) and initiatives (that is, processes or tasks such as Form Cost Minimization Team) that form your strategy to which you assign KPIs to measure progress and performance. For more information on:
-
Objectives, see "What Are Objectives?"
-
Initiatives, see "What Are Initiatives?"
-
-
Align objectives and initiatives with customized or traditional perspectives (fundamental business competencies and areas such as finance or customer relations). This later enables you to depict the extent to which corporate strategy supports these perspectives. See "What Are Perspectives?" for additional information.
-
Define target numeric ranges to evaluate the values of KPIs within corporate or department-level objectives and initiatives. See "Defining Assessment Mappings for Scorecards" for additional information.
-
Graphically communicate strategy and strategic dynamics using strategy maps, cause & effect maps, custom views, and strategy trees. For additional information, see:
-
Discuss the implementation and status of objectives and initiatives by adding, reading, and replying to comments. See "About Comments" for additional information.
Best Practice:
Because you use KPIs in scorecards to measure progress and performance over time, you should include appropriate time dimensions when defining KPIs to be used within scorecards. For information on time dimensions, see your administrator.
What Is a Balanced Scorecard?
Traditionally, companies focus heavily on financially driven strategies without sufficiently considering other contributing perspectives. Because financial goals are usually backward looking, tending to be defined in terms of growth over historic numbers, they do not account for future market conditions or leverage objectives. Balanced Scorecard is a strategic management system that maps an organization's strategy into clear objectives, measures, targets, and initiatives, which are organized into four perspectives: Financial, Customer, Internal Business Processes, and Learning and Growth. These perspectives are typically framed by questions, such as "To achieve our vision, how should we appear to our customers?" or "To succeed financially, how should we appear to our shareholders?" As a methodology, Balanced Scorecard provides businesses with the language to define strategies that cater to multiple, relevant perspectives. Much in the way that financial statements (income statement, cash flow statement, and balance sheet) describe the financial health of an organization, Balanced Scorecard provides a framework to communicate the strategy in a consistent and insightful way. Figure 12-11 depicts a representation of these four perspectives.
"The four perspectives of the scorecard permit a balance between short-term and long-term objectives, between desired outcomes and the performance drivers of those outcomes, and between hard objective measures and softer, more subjective measures." (Robert S. Kaplan, David P. Norton, "Linking the Balanced Scorecard to Strategy," California Management Review Reprint Series, 1996 by the Regents of the University of California CMR, Vol 39, Number 1, Fall 1996).
Oracle Scorecard and Strategy Management provides four default perspectives that you can use to define strategies that holistically include all relevant perspectives and to define strategy structures that ensure stability and success in all perspectives.
These four default perspectives, which are in support of the Balanced Scorecard methodology devised by Dr. Robert Kaplan and Dr. David Norton, are:
-
Financial —Used to identify financial measures that help to answer this question: "How do we look to our shareholders?"
-
Customer — Used to identify measures that help to answer this question: "How do customers see us?"
-
Internal Process — Used to identify measures that help to answer this question: "At what processes must we excel?"
-
Learning and Growth — Used to identify measures that help to answer this question: "How can we continue to improve and create value?"
You can customize the perspectives provided or create your own to best align objectives, key initiatives, and KPIs with your business competencies.
Note:
Kaplan and Norton's four perspectives reflect a specific organizational strategy. These perspectives and strategies would not necessarily be suitable for government, public-sector, or nonprofit organizations; therefore, the objectives and key questions should be amended and supplemented to capture the desired strategies.
See "What Is Oracle Scorecard and Strategy Management?" for more information on Oracle Scorecard and Strategy Management.
Best Practice:
Treat the balanced scorecard as a living document. The process of assessing objectives, initiatives, and so on is reiterative. The process should provide not only quantitative, but qualitative insight into the health of your organization and should guide your organization in a timely fashion to achieving your desired results.
What Is the Scorecard Editor?
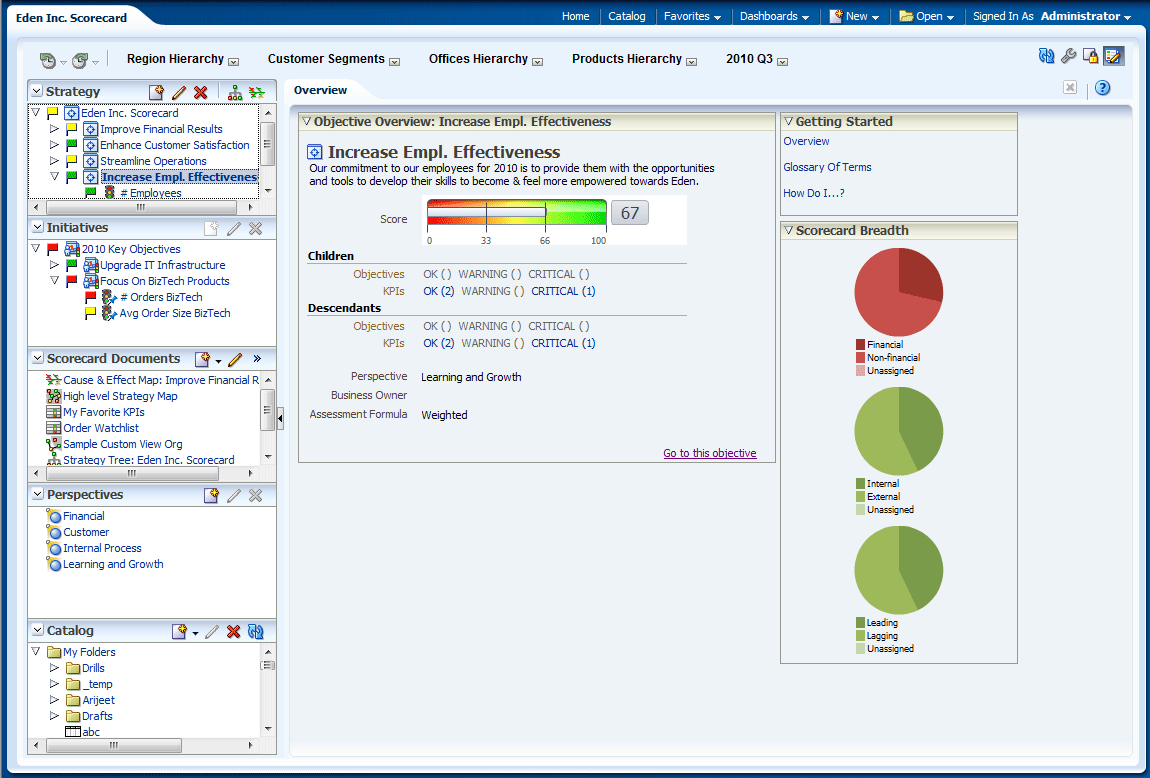
The "Scorecard editor" lets you create a scorecard of your entire organization or of individual departments. It consists of numerous panes and tabs:
-
On the left side of the editor are the panes that you use to create the objects that comprise your scorecard. For example, it includes the Strategy pane, which you use to create, organize, and leverage the objectives that form the strategic structure (also called the strategy tree) of the corporate entity (department, for example) that you want to evaluate.
-
On the right side of the editor is the tab area. When you first create a scorecard, you are presented with the Overview tab. This tab enables you to view summary information for the selected initiative, objective, or KPI.
As you create your scorecard objects, detailed tabs are generated dynamically for each object. For example, when you create an objective, a tab is generated for that objective. You use this tab to define the objective and to view detailed information about the objective, such as which KPIs are to be used to evaluate it and which initiatives drive it.
-
At the top of the editor are toolbar buttons and the point of view area. The point of view area displays the dimensions of the KPIs that are used in the scorecard to measure the progress and performance of initiatives and objectives. You use this area to pin (or set) values for the dimensions. When you pin a dimension, the data in the scorecard is filtered to give you a new point of view (that is, a new view of the data). See "About the Point of View Area" for additional information.
Figure 12-2 shows an example of the Scorecard editor for Eden Inc.
What Are Scorecard Objects?
Scorecard objects are items that you create or arrange to:
-
Represent and evaluate corporate strategy, including:
-
Objectives
See "What Are Objectives?" for additional information.
-
Initiatives
See "What Are Initiatives?" for additional information.
-
Perspectives
See "What Are Perspectives?" for additional information.
-
KPIs
See "What Are Key Performance Indicators (KPIs)?" for additional information.
-
-
Present and analyze corporate strategy, including:
-
Vision statements
See "What Are Vision Statements?" for additional information.
-
Mission statements
See "What Are Mission Statements?" for additional information.
-
Strategy trees
See "What Are Strategy Trees?" for additional information.
-
Strategy maps
See "What Are Strategy Maps?" for additional information.
-
Cause & effect maps
See "What Are Cause & Effect Maps?" for additional information.
-
Custom views
See "What Are Custom Views?" for additional information.
-
KPI watchlists
See "What Are KPI Watchlists?" for additional information.
-
Smart watchlists
See "What Are Smart Watchlists?" for additional information.
-
Agents
See "Creating Agents from KPIs" for additional information.
-
How Do I Create a Scorecard?
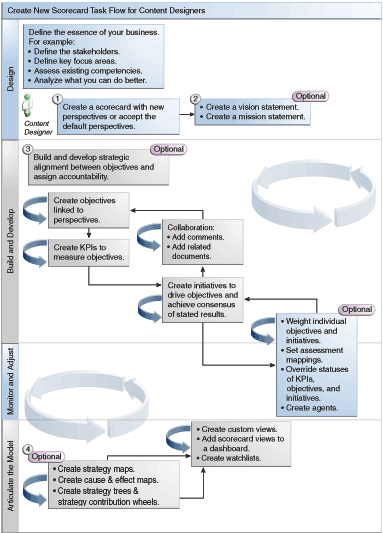
Because Oracle Scorecard and Strategy Management provides you with a wealth of scorecard objects with which to build your scorecard, an overall process flow and description is provided to guide you. It is recommended that you perform each task within the process flow in order. Figure 12-3 shows a graphic representation of the overall process flow to build a scorecard.
To create a scorecard, you perform the following tasks.
-
Create a new scorecard to contain the scorecard objects that you choose to represent, evaluate, present, and analyze your corporate strategy, such as objectives, initiatives, perspectives, and so on. See "Creating Scorecards" for additional information.
-
When you create a scorecard, you can accept the four default perspectives (see "What Is a Balanced Scorecard?") or you can create your own perspectives. Perspectives represent your key business competencies (for example, Research and Development or Financial) that you can use to align initiatives and objectives. See "What Are Perspectives?" and "Creating Custom Perspectives" for additional information.
-
-
Define the vision and mission statements that translate your corporate direction into over-arching strategic themes and thrusts that you later support by creating objectives. See "What Are Vision Statements?," "Defining Vision Statements," "What Are Mission Statements?," and "Defining Mission Statements" for additional information.
-
Create and arrange the objectives (goals or desired outcomes) for your entire organization, or for a department to develop a strategic alignment or causality between objectives. This includes assigning the KPIs that measure the progress and performance of objectives. Note that the top-level objective (that is, the root objective) in the Strategy pane represents the entity (your entire organization or a department) that you are scorecarding. See "What Are Objectives?" and "Creating Objectives" for additional information.
-
Create the KPIs that gather core business data (Product Sales, for example) and specify the KPI targets, target ranges, and actions. See "What Are Key Performance Indicators (KPIs)?" and "Creating KPIs" for additional information.
-
Create the KPI watchlists that you want to use to monitor KPIs. See "What Are KPI Watchlists?" for additional information.
-
Create and arrange the initiatives required to meet objectives. You also can assign KPIs to initiatives. See "What Are Initiatives?" and "Creating Initiatives" for additional information.
-
Use comments (also know as annotations) to associate explanatory text with the values of KPIs, objectives, or initiatives for a specific set of dimension values. See "About Comments" for additional information.
-
Refine and reiterate objectives and initiatives:
-
Weight individual objectives and initiatives to specify how they impact the overall performance of the entity that you are scorecarding. See "Understanding Initiative or Objective Performance Assessment" and "Assigning Weights to Child Objectives, Initiatives and KPIs" for additional information.
-
Set assessment mappings. See "Defining Assessment Mappings for Scorecards" for additional information.
-
If appropriate, override the status of KPIs, initiatives, and objectives. See "Working with Status Overrides" for additional information.
-
Create agents from KPIs. (Agents enable you to automate your business processes.) See "Creating Agents from KPIs" for additional information.
-
-
Depict relationships between objectives and articulate models by using strategy maps, cause & effect maps, and strategy trees.
See "What Are Strategy Maps?," "Creating Strategy Maps," "What Are Cause & Effect Maps?," "Creating Cause & Effect Maps," "What Are Strategy Trees?," and "Creating Strategy Trees," and for additional information.
-
Create custom views to further refine your strategy to help capture the essence of your business. See "What Are Custom Views?" and "Creating Custom Views" for additional information.
-
Create views into a scorecard based on criteria that you specify by creating smart watchlists. See "What Are Smart Watchlists?" and "Creating Smart Watchlists" for additional information.
-
Add scorecard views to dashboards. See "Adding Scorecard Objects to Dashboards" for additional information.
About Scorecard Privileges and Permissions
The ability to perform certain tasks when building KPIs, and KPI watchlists, or within Oracle Scorecard and Strategy Management (such as, creating scorecards or contacting owners) is controlled by privileges. Privileges are managed by the administrator. Refer to "Managing Presentation Services Privileges" in Security Guide for Oracle Business Intelligence Enterprise Edition for general information.
Many tasks require a combination of privileges. Three tables, "Privileges Required for KPI Tasks," "Privileges Required for KPI Watchlist Tasks," and "Privileges Required for Scorecard and Scorecard Object Tasks" in Security Guide for Oracle Business Intelligence Enterprise Edition:
-
List the task object (for example, action link or related document).
-
List the tasks and corresponding privileges that you can manage.
-
Assume that your administrator has given your user ID or group the permissions to read or write to the necessary catalog objects and folders.
Note:
These tables do not address permissions. To alter the permissions for the scorecard or elements within the scorecard (that is, which users have access to the scorecard or elements within the scorecard), you need Full Control permission on the scorecard. For information about permissions, see Chapter 13, "Managing Objects in the Oracle BI Presentation Catalog."
You should:
-
Review "Privileges Required for KPI Tasks," "Privileges Required for KPI Watchlist Tasks," and "Privileges Required for Scorecard and Scorecard Object Tasks" in Security Guide for Oracle Business Intelligence Enterprise Edition to ensure that you have sufficient privileges to accomplish your task, and if necessary contact your administrator to grant you additional privileges.
-
Have the appropriate permissions for the Oracle BI Presentation Services layer object to delete any of the scorecard, KPI watchlist, or KPI objects using the catalog browser. See "Setting Permissions for Presentation Layer Objects" in Metadata Repository Builder's Guide for Oracle Business Intelligence Enterprise Edition.
Using the Edit and View Modes in the Scorecard Editor
The "Scorecard editor" has two modes:
-
Edit mode — Enables you to create or edit mission statements, vision statements, initiatives, perspectives, objectives, KPIs, KPI watchlists, smart watchlists, and views, and create agents from KPIs.
Note:
You should not delete scorecard objectives, initiatives, or perspectives outside of "Scorecard editor" as that may result in scorecard issues.
-
View mode — Enables you to navigate and view mission statements, vision statements, initiatives, perspectives, objectives, KPIs, KPI watchlists, and views but not add or modify them. You also can add comments, override statuses, create agents from KPIs, and interact with smart watchlists.
In addition, the information that you can access and the tasks that you can perform in these modes depends on the following:
-
The privileges that are assigned to your account
-
The permissions that are associated with the individual scorecard objects and folders
See "About Scorecard Privileges and Permissions" for additional information.
Creating Scorecards
To create a scorecard:
-
In the global header, click New and then select Scorecard.
The "New Scorecard dialog" is displayed.
-
Specify a name for the scorecard.
-
(optional) Specify a description of the scorecard.
-
Select the location in which to save the scorecard.
-
Specify whether to use the default Balanced Scorecard perspectives. If you deselect the Use Default Perspective? check box, you must create your own custom perspectives with which you will associate initiatives and objectives. See "Creating Custom Perspectives" for additional information.
-
Click OK. The new scorecard is created. You can now perform the remaining tasks for creating a scorecard, as described in "How Do I Create a Scorecard?"
Opening or Editing Scorecards
To open or edit a scorecard:
-
In the global header, click Catalog to display the "Catalog page."
-
Navigate to the scorecard that you want to open or edit and click one of the following links:
-
Open — The scorecard is displayed in the "Scorecard editor" in view mode.
-
Edit — The scorecard is displayed in the "Scorecard editor" in edit mode.
See "Using the Edit and View Modes in the Scorecard Editor" for additional information on the view and edit modes.
-
-
Make the desired changes.
-
Save the scorecard.
Best Practice:
If you need your administrator to make a change to your metadata (for example, rename a dimension or delete a subject area), remove all references to the object within your KPIs and scorecards prior to contacting your administrator.
Viewing Overview Information
You can view summary information for initiatives, objectives, or KPIs.
To view overview information:
-
Open or edit the scorecard. See "Opening or Editing Scorecards" for additional information.
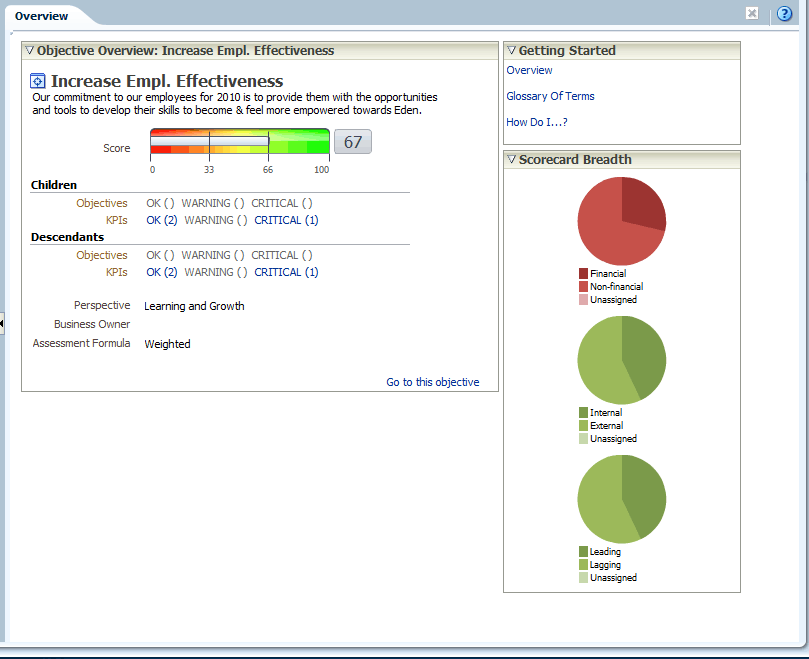
The "Scorecard editor: Overview tab" is displayed. Figure 12-4 shows an example of the Overview tab for an objective.
The Overview tab shows summary information for the root objective, which represents the entity that you are scorecarding, that is, the entire organization or a department.
-
To show summary information for:
-
A KPI, in the "Initiatives pane" or in the "Strategy pane," click the KPI.
-
An initiative, in the "Initiatives pane," click the initiative.
-
An objective, in the "Strategy pane," click the objective.
-
About the Point of View Area
The point of view area of the "Scorecard editor" displays controls for the dimensions of KPIs that are used in the scorecard to measure the progress and performance of initiatives and objectives. See "What Are Dimensions and Pinned Dimension Values?" for additional information on KPI dimensions.
Controls are displayed for each KPI dimension that is referenced in a scorecard with the exception of those that you explicitly prevent from being displayed. If the same dimension is referenced in more than one KPI, then a control can be shared by the KPIs. See "Setting Up the Point of View Controls" for additional information on how to set up the controls in the point of view area.
Figure 12-5 shows a point of view area that displays the Region Hierarchy, Customer Segments, Offices Hierarchy, Products Hierarchy, and 2010/Q3 dimensions.
Each control includes a label and a down-arrow button that displays a list of the dimension values from which you can select, and a Search link (see "Search Members dialog" for additional information). The label is either the database name for the dimension (by default), a user-friendly label (if specified for the control), or one or more values (if the dimension is pinned to a specific value or multiple values).
You use this area to temporarily pin or set values for the dimensions. When you pin a dimension, the data in the scorecard is filtered to give you a new point of view (that is, a new view of the data). This enables you to focus on specific data of interest to you, such as the area of business for which you are responsible.
The point of view area settings are temporary and are not persisted when the scorecard is saved. To persist pinnings, you can use the:
-
"Settings dialog: Dimension Settings tab" to affect all KPI usages within a scorecard.
-
Dimensionality area in the "Analytics pane" of the "Scorecard editor: KPI Details tab" to pin the values for a particular KPI usage.
-
"Add KPI dialog" (also displayed as the Edit Watchlist Entry dialog) in the "KPI Watchlist editor" to pin values for individual KPIs.
-
"Dimension Pinnings dialog" to pin values in a view that has been added to a dashboard.
-
"KPI editor: Dimensionality page" (also displayed as the Scorecard editor: KPI tab) to pin values in a KPIs definition. This approach is less flexible than when you let a KPI's definition be reusable in different contexts and pin only within views that reference the KPI.
The Scorecard editor also contains the Back and Forward buttons that enable you to move forward or backward through your point of view history to select a previous point of view or the point of view with which you started.
To temporarily pin a dimension:
-
Click the down-arrow button to the right of the dimension.
-
To:
-
Select a specific single value, click the value.
-
Select multiples values, click the Search link to display the "Search Members dialog," make your selections, and then click the OK button. Note that you can also select multiple values by pressing and holding the Ctrl key, and then clicking the desired values.
-
If the value is a hierarchical column, click the sideways triangle button to expand the levels. Press and hold the Ctrl key, and then click the desired values.
-
-
Click the down-arrow or outside the dialog box to close it.
The data is filtered and a new point of view is displayed.
Setting Up the Point of View Controls
You use the "Settings dialog: Dimension Settings tab" to set up the controls for dimensions in the point of view area of a scorecard.
Specifically, you can specify:
-
One or more default values for the dimension.
-
Whether a control for the dimension is to be displayed in the point of view area
-
The label to be displayed in the point of view area for the dimension.
See "About the Point of View Area" for additional information on the point of view.
To set up the point of view controls:
-
Edit the scorecard for which you want to set up the point of view controls. See "Opening or Editing Scorecards" for additional information.
-
Click the Scorecard Settings toolbar button in the Scorecard editor.
The "Settings dialog: Assessment Mappings tab" is displayed.
-
Click the Dimension Settings tab.
-
Set up the controls for each dimension as desired. To set up the control for a dimension:
-
Select the dimension and then click the Edit Row button to display the "Edit Dimension Settings dialog."
-
Specify the settings that you want.
-
Click OK.
-
-
Click OK.
What Are Vision Statements?
A vision statement is a short statement that describes what your organization wants to become sometime in the future. For example, it might be to become the most successful business in the South America Polypropylene Market. (A vision statement is optional.)
Often, from this statement, you define the key goals and priorities that form your mission statement. See "What Are Mission Statements?" for additional information.
See "Defining Vision Statements" for additional information on defining a vision statement.
Note:
Creating vision and mission statements requires a very specific set of privileges. If the vision or mission statement toolbar button is disabled, contact your administrator. See "Identifying Privileges for KPIs, KPI Watchlists, and Scorecarding" in Security Guide for Oracle Business Intelligence Enterprise Edition for additional information.
Defining Vision Statements
To define a vision statement:
-
Edit the scorecard for which you want to define a vision statement. See "Opening or Editing Scorecards" for additional information.
-
In the "Scorecard Documents pane," click the Create Object toolbar button and then select Create Vision.
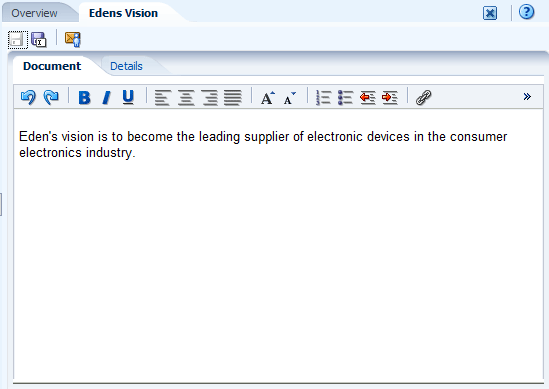
The "Vision tab: Document tab" is displayed. Figure 12-6 shows an example of a vision statement for Eden Inc.
-
Enter and format the vision statement. You can apply such formatting options as bold, italic, underlining, indents, justification, and font size changes.
-
Click the "Vision tab: Details tab."
-
Assign the business owner and specify related documents, as appropriate. See "Related Documents area" for additional information.
-
Click Save to display the "Save As dialog." In the Save As dialog, you can rename the vision statement rather than use the default name.
What Are Mission Statements?
A mission statement specifies the key business goals and priorities that are required to achieve your vision. (A mission statement is optional.)
See "Defining Mission Statements" for additional information.
You define your vision in a vision statement. See "What Are Vision Statements?" for additional information on vision statements.
Defining Mission Statements
To define a mission statement:
-
Edit the scorecard for which you want to define a mission statement. See "Opening or Editing Scorecards" for additional information.
-
In the "Scorecard Documents pane," click the Create Object toolbar button and then select Create Mission.
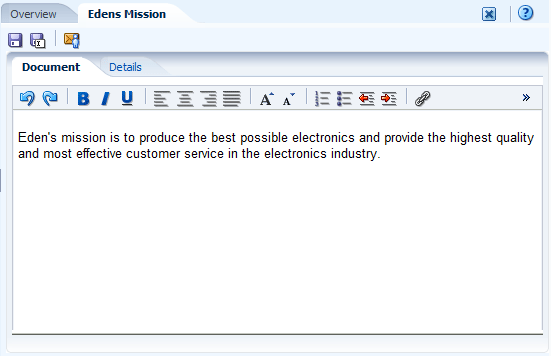
The "Mission tab: Document tab" is displayed. Figure 12-7 shows an example of a mission statement for Eden Inc.
-
Enter and format the mission statement. You can apply formatting options such as bold, italic, underlining, indents, justification, and font size changes.
-
Click the "Mission tab: Details tab."
-
Assign the business owner and specify related documents, as appropriate. See "Related Documents area" for additional information.
-
Click Save to display the "Save As dialog." In the Save As dialog, you can rename the mission statement rather than use the default name.
What Are Perspectives?
Perspectives are categories in your organization with which to associate initiatives, objectives, and KPIs. A perspective can represent a key stakeholder (such as a customer, employee, or shareholder/financial) or a key competency area (such as time, cost, or quality).
You associate an initiative and objective with a perspective when you create or edit it. See "Creating Initiatives" and "Creating Objectives" for additional information. You associated a KPI with a perspective when you edit the details of the KPI. See "Working with KPI Details" for additional information.
For example, when you create an objective called Improved Client Response Time, you might associate it with the Customer perspective as the objective sustains and supports customer-related operations.
There are four standard perspectives that are defined by the Balanced Scorecard Methodology:
-
Financial — Groups objectives, initiatives, and KPIs that relate to or support the monetary or economic health and development of your organization.
-
Customer — Groups objectives, initiatives, and KPIs that pertain to or support your client base.
-
Internal Process — Groups objectives, initiatives, and KPIs that categorize and support your corporate internal policies and procedures.
-
Learning and Growth — Groups objectives, initiatives, and KPIs that relate to or support employee training and advancement.
In addition, you can create custom perspectives for your scorecard.
See "Creating Custom Perspectives" for additional information.
Creating Custom Perspectives
When you create a scorecard, you specify whether you want to use the default perspectives that are defined by the Balanced Scorecard Methodology (using the Use Default Perspectives? check box. If you:
-
Do not use the default perspectives, then you must create your own custom perspectives.
-
Do use the default perspectives, then you can create one or more custom perspectives to use along with the default perspectives.
To create custom perspectives:
-
Edit the scorecard for which you want to create a custom perspective. See "Opening or Editing Scorecards" for additional information.
-
In the "Perspectives pane," click the New Perspective toolbar button.
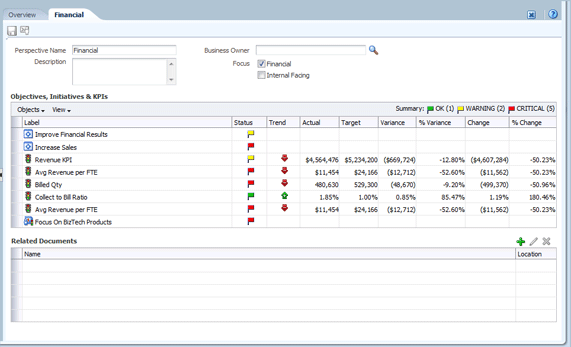
The "Scorecard editor: Perspective tab" is displayed. Figure 12-8 shows an example of a financial perspective displayed on the Perspective tab.
-
In the Perspective Name field, enter the name of the perspective.
-
(optional) In the Description field, enter a description of the perspective.
-
Click the Set User button to display the "Select Business Owner dialog," where you select the business owner. (By default, the business owner is the creator of the scorecard.)
-
In the Focus area, specify whether the focus of the perspective is financial or internal facing. See "Scorecard editor: Perspective tab" for additional information.
-
Add related documents, as appropriate. See "Related Documents area" for additional information.
-
Click Save.
The perspective displays in the "Perspectives pane."
You can now associate initiatives, objectives, and KPIs with this custom perspective. You associate an initiative and objective with a perspective when you create or edit the initiative or objective. See "Creating Initiatives" and "Creating Objectives" for additional information. You associated a KPI with a perspective when you edit the details of the KPI. See "Working with KPI Details" for additional information.
What Are Key Performance Indicators (KPIs)?
A KPI represents the result of a business measure (for example, Product Sales or Operational Costs) evaluated against a target for that measure. You can use KPIs to assess the progress of the objectives and initiatives that form levels of organizational strategy.
You can create KPIs that you need:
-
Within a scorecard. This enables you to create the KPIs as you are creating or editing the scorecard.
-
Outside a scorecard. This enables you to create the KPIs in advance of creating or editing a scorecard.
For information on KPIs and how to create them, see Chapter 11, "Using KPIs and KPI Watchlists."
What Are Objectives?
Objectives are the required or desired outcomes that form your corporate strategy. You can create an objective for:
-
An entire organization, for example, Oracle Corporation
-
A department, for example, Sales department
When you create an objective, you assign it one or more KPIs that are to be used to measure its progress and performance. For example, you can measure the progress and performance of an objective named Improved Customer Satisfaction by assigning it the following KPIs:
-
Average Customer Survey Satisfaction Score
-
Number of Customer Complaints KPIs
For more information on KPIs, see Chapter 11, "Using KPIs and KPI Watchlists."
Within a scorecard, you also create the initiatives that are required to meet the objectives. See "What Are Initiatives?" for additional information on initiatives.
Objectives that you create are displayed hierarchically in the "Strategy pane." The root objective represents the entity that you are scorecarding, that is the entire organization or a department. The KPIs that are assigned to assess the performance of objectives are displayed below the objectives in the Strategy pane.
The Strategy pane also shows the statuses of objectives and KPIs using the appropriate colors and icons that you specified for assessment mappings. See "Defining Assessment Mappings for Scorecards" for additional information on assessment mappings.
Best Practice:
When creating objectives, if possible, use subobjectives measured by KPIs to monitor results. Corrective action becomes incremental, reiterative, and more achievable. For example: the objective, Improve Financial Results, might include Increase Sales, Reduce Costs, Increase Employee Effectiveness, and Streamline Operations as subobjectives.
Use related documents to provide supporting information for the objective, initiative, and so on.
See "Creating Objectives" for additional information on creating objectives.
Creating Objectives
You can create one or more objectives. Objectives that you create should be strategically relevant and measurable using KPIs.
See "What Are Objectives?" for additional information about objectives.
To create an objective:
-
Edit the scorecard for which you want to create an objective. See "Opening or Editing Scorecards" for additional information.
-
In the "Strategy pane":
-
If the objective that you want to create can be independently achieved, then select the root objective.
-
If the objective that you want to create is required to meet a higher-level objective, then select the higher-level objective.
-
-
Click the Create Objective toolbar button or right-click and select Create Objective.
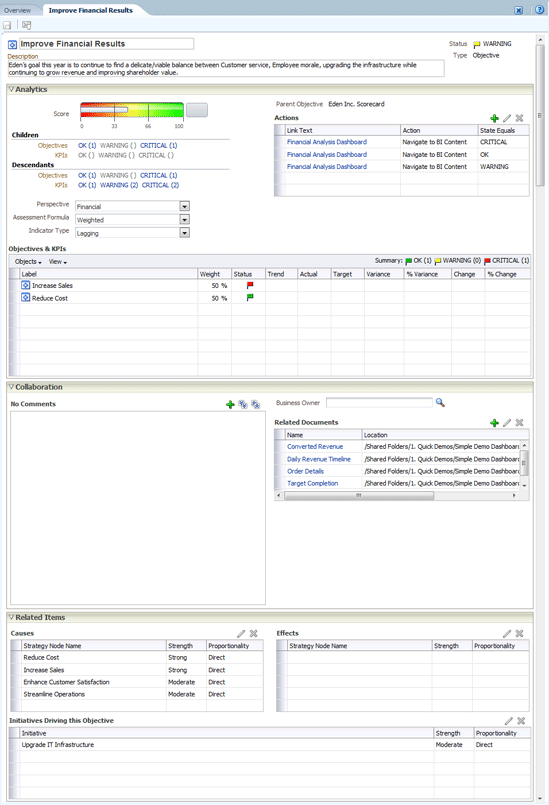
The "Scorecard editor: Objective Details tab" is displayed. Figure 12-9 shows an example of an objective displayed on the Objective Details tab.
-
Highlight the default objective name in the top left corner and enter a new name for the objective.
-
In the Description field, enter a description of the objective.
-
Specify the analytic information (including the KPIs to be used to measure the progress and performance of the objective) by completing the "Analytics pane." See "Completing the Analytics Pane for Objectives or Initiatives" for additional information.
-
Specify the collaboration information by completing the "Collaboration pane" as follows:
-
(optional) Add comments by clicking the Add Comment button to display the "Add Comment dialog." See "About Comments" for additional information.
-
Specify the business owner that users can contact by clicking the Set User button to display the "Select Business Owner dialog." (By default, the business owner is the creator of the scorecard.)
-
(optional) Add related documents by clicking the New Row button to display the "New Related Document dialog." Also see "Related Documents area" for additional information.
-
-
Add related items by completing the "Related Items pane" as follows:
-
Add one or more objectives that impact or support (that is, help achieve or hinder progress on) this objective. To do so, drag the objective from the Strategy pane and drop it in the Causes table.
The "Causal Linkage dialog" is displayed, where you specify how closely the objectives are related and whether changes to the values in this causal objective have a direct or inverse impact on this objective.
For example, for an Increased Client References objective, you might drag and drop the following objectives that could cause (or help or hinder) it: Decreased Client Response Time and Increase Customer Issue Resolutions.
-
Add one or more initiatives (that is, the tasks that are required to meet the objective). To add an initiative, drag it from the "Initiatives pane" and drop it in the Initiatives Driving This Objective table.
The"Initiative Linkage dialog," where you specify how closely the initiative and the objective are related and whether changes to the values in this initiative have a direct or inverse impact on this objective.
-
Add one or more objectives that this objective impacts or supports. To do so, drag the objective from the Strategy pane and drop it in the Effects table.
The "Causal Linkage dialog" is displayed, where you specify how closely the objectives are related and whether changes to the values in this causal objective have a direct or inverse impact on this objective.
-
-
Click Save.
Completing the Analytics Pane for Objectives or Initiatives
When you create an objective or initiative, you must specify the analytics for the objective or initiative by completing the "Analytics pane."
To complete the Analytics pane:
-
In the Perspective box, select the perspective with which the objective or initiative is to be aligned.
Best Practice:
Assign a perspective to each objective or initiative. This facilitates in the definition of causal linkages when building strategy maps.
-
In the Assessment Formula box, select the rule to be used to assess the overall performance of the initiative or objective. For example, select Worst case to specify that the status of the worst performing child KPI or objective is to be used.
-
(for an objective only) In the Indicator Type box, indicate whether the performance of the objective drives other objectives, or is affected by the performance of other objectives or other data or processes (for example, leading or lagging).
-
(for an initiative only) In the Priority box, select the priority that indicates the importance and urgency of an initiative.
-
(for an initiative only) Specify the start date, due date, and completion date.
-
In the Actions area, add any action links that you want to provide to users to let them take actions that are relevant for the status of the objective or initiative. See "Adding Actions to Initiatives and Objectives in Scorecards" for additional information. Also see "What Are Actions?" for additional information.
-
In the Objectives & KPIs or Initiatives & KPIs watchlist, add the KPIs to be used to measure the progress and performance of the objective or initiative. (See "Watchlists" for additional information on watchlists.)
Note:
If no KPIs have been defined, or if you want to define another KPI to meet your needs, then you can create the KPI from within the Scorecard editor. See "Creating KPIs" for additional information.
Tip:
You can modify the columns that are displayed in the Objectives & KPIs or Initiatives & KPIs watchlist. To do so, select View, then Show More Columns to display the "Show More Columns dialog," where you can add or remove columns.
To add a KPI:
-
Click Save. You must save the new objective or initiative before you can add a KPI.
-
Click Objects in the Objectives & KPIs or Initiatives & KPIs watchlist and then select Add KPI. The "Select a KPI dialog" is displayed.
Note:
You can drag the KPI from the "Catalog pane for Scorecard" or from the "Scorecard Documents pane" (if the KPI has been saved to the current scorecard folder) and drop it in the watchlist. If you choose this method, the "Add KPI dialog" is displayed.
-
Choose a KPI and click OK. The "Add KPI dialog" is displayed.
-
If the KPI is dimensioned, then for each dimension, specify one or more values, select Use Variable and specify the variable, or select Use Point-of-View to use the value or values selected in the point of view area. See "About the Point of View Area" for additional information on the point of view area.
-
In the Label field, enter the name to be displayed for the KPI in the "Strategy pane."
-
Click OK.
Note:
A KPI that you have added to the Strategy pane or Initiatives pane obtains many of its properties from the base KPI as it was originally defined in the KPI editor. You can override some of the base KPI's properties to customize them for use within scorecard. The KPI properties that you can override are the label, description, and business owner. You can assign a perspective and an indicator type. You can also set dimension pinnings for dimensions that are left unpinned in the KPI definition. See "Working with KPI Details" for additional information on overriding KPI properties.
-
What Are Initiatives?
Initiatives are time-specific tasks or projects that are necessary to achieve objectives. As such, you can use initiatives that support objectives as milestones as they reflect progress toward strategy targets. For example to implement an objective called Improve Customer Satisfaction, you might create these initiatives:
-
Create online feedback forum
-
Form response team
Generally, an initiative supports multiple objectives.
When you create an initiative, you assign it KPIs that are to be used to measure its progress. For more information on KPIs, see Chapter 11, "Using KPIs and KPI Watchlists."
Initiatives that you create are displayed hierarchically in the "Initiatives pane." The root initiative represents all the initiatives that you implement to achieve objectives and goals. The KPIs that are assigned to an initiative are displayed below the initiative in the Initiatives pane.
The Initiatives pane also shows the statuses of initiatives and KPIs using the appropriate colors and icons that you specified for assessment mappings. See "Defining Assessment Mappings for Scorecards" for additional information on assessment mappings.
See "Creating Initiatives" for additional information on creating initiatives.
Creating Initiatives
You can create one or more initiatives. Initiatives that you create should be measurable using KPIs and strategically relevant.
See "What Are Initiatives?" for additional information about initiatives.
To create an initiative:
-
Edit the scorecard for which you want to create an initiative. See "Opening or Editing Scorecards" for additional information.
-
In the "Initiatives pane":
-
If the initiative that you want to create can be independently implemented, then select the root initiative.
-
If the initiative that you want to create is required to meet a higher-level initiative, then select the higher-level initiative.
-
-
Click the Create Initiative toolbar button or right-click and select Create Initiative.
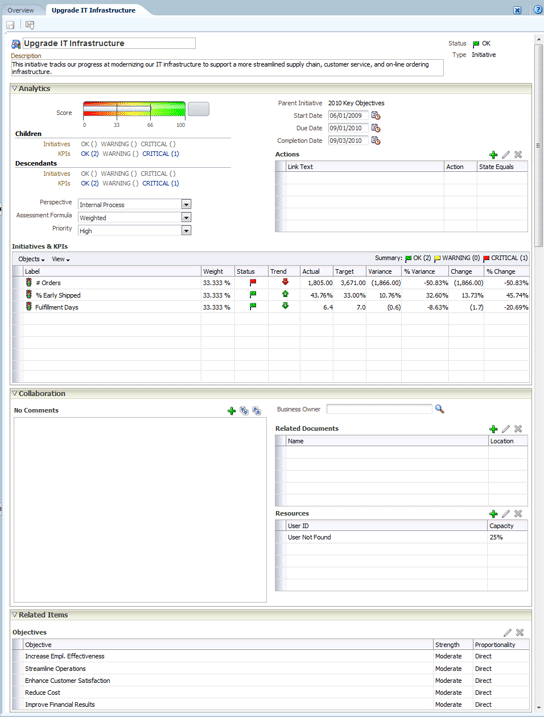
The "Scorecard editor: Initiative Details tab" is displayed. Figure 12-10 shows an example of an initiative displayed on the Initiative Details tab.
-
Highlight the default initiative name in the top left corner of the tab and enter a new name for the initiative.
-
In the Description field, enter a description of the initiative.
-
Specify the analytic information (including the KPIs to be used to measure the progress of the initiative) by completing the "Analytics pane." See "Completing the Analytics Pane for Objectives or Initiatives" for additional information.
-
Specify the collaboration information by completing the "Collaboration pane" as follows:
-
(optional) Add comments by clicking the Add Comment button to display the "Add Comment dialog." See "About Comments" for additional information.
-
Specify the business owner that users can contact by clicking the Set User button to display the "Select Business Owner dialog." (By default, the business owner is the creator of the scorecard.)
-
(optional) Add related documents by clicking the New Row button in the Related Documents toolbar to display the "New Related Document dialog." Also see "Related Documents area" for additional information.
-
(optional) Add the key resources by clicking the New Row button in the Key Resources toolbar to display the "Key Resource dialog."
-
-
In the "Related Items pane," add one or more objectives that require this initiative in order to succeed.
To add an objective, drag the objective from the "Strategy pane" and drop it in the Objectives table.
The"Objective Linkage dialog" is displayed, where you specify how closely the initiative and the objective are related and whether changes to the values in this initiative have a direct or inverse impact on this objective.
-
Click Save.
Best Practice:
Use initiatives to track major milestones as a closed loop by assigning strategic objectives, taking remedial action by monitoring KPI targets and metric results, and using annotations and related documents for collaboration.
Contacting Business Owners
You can send a message to the business owner of a scorecard object. The business owner is the person who is responsible for managing and improving the business value and performance of a scorecard object. (The business owner might or might not be the same as the person who creates the scorecard or creates the KPI.) You specify the business owner of an object when you create it.
You use the Contact Owner button or menu option to contact the business owner. This button is available in many places in a scorecard, for example, on the toolbar of most tabs, such as the "Scorecard editor: Objective Details tab."
Oracle BI EE uses an agent and the delivery devices and profiles that the business owner specified in the "My Account dialog: Delivery Options tab" to determine where to deliver the message (for example, email, phone, or pager).
To contact a business owner:
-
Click the Contact Owner button or menu option. The "Contact Owner dialog" is displayed.
-
In the Subject field, enter a the subject of the message.
-
In the Priority field, select the priority of the message.
-
In the Message field, enter the message that you want to send to the business owner.
-
Click Send.
About Comments
Collaboration between users is essential to gain a consensus in order achieve the stated and desired results. Comments (also known as annotations) enable you to discuss changes in performance and progress for an initiative, objective, or KPI for a specific set of dimension values (that is, for a specific point of view).
Note:
Before you can work with comments, your administrator must enable this feature. See "Configuring the Repository for Oracle Scorecard and Strategy Management" in Metadata Repository Builder's Guide for Oracle Business Intelligence Enterprise Edition for additional information.
You can add, view, and reply to comments in many places in a scorecard. For example, you can add a comment directly to an objective in the "Scorecard editor: Objective Details tab." You can also add a comment to an objective in the Diagram tab of a view, a smart watchlist, and a perspective in which its referenced. You cannot delete KPI annotations.
A comment is associated with:
-
An initiative, objective, or KPI that measures the progress of an initiative and objective.
When an initiative, objective, or KPI that has a comment associated with it is referenced elsewhere in a scorecard and the point of view being displayed matches that of the comment, a comment indicator is displayed as follows:
-
In a watchlist, a blue triangle is displayed in the row containing the initiative, objective, or KPI. See "Watchlists" for additional information.
-
In a node in the Diagram tab of a view, the Comment button is displayed in the upper-right corner of the node.
-
-
A certain column.
A comment is normally associated with the Status column of an objective, initiative, or KPI, unless (for KPIs only) the comment is added to another column such as Trend or Variance.
-
A specific point of view.
Comments are filtered by the values in the point of view area in the "Scorecard editor" that are currently in effect for the object being viewed. As a result, the comment for Eastern Region Sales can be different than the comment for Western Region Sales. (See "About the Point of View Area" for additional information.)
-
Any dimension pinnings on the KPI.
Comments are filtered by any other dimension pinnings that are in effect (on a KPI, scorecard, scorecard diagram, dashboard prompt, or KPI watchlist).
Best Practice:
Use annotations and overrides to increase employee collaboration, participation, and accountability, and to prevent future occurrences of identified deficiencies.
See "Working with Comments" for additional information about how to work with comments.
Working with Comments
You can work with comments in many places in a scorecard, including in:
-
The "Collaboration pane" of the "Scorecard editor: Initiative Details tab," "Scorecard editor: Objective Details tab," and the "Scorecard editor: KPI Details tab."
See "Working with Comments in the Collaboration pane" for additional information.
-
Watchlists
See "Working with Comments in Watchlists" for additional information.
-
The Diagram tab of a view.
See "Working with Comments in the Diagram Tab of a View" for additional information.
Note:
Before you can add comments to an initiative or objective, the initiative or objective must have at least one KPI assigned to it.
As you work with comments, remember that a comment is associated with a specific point of view. See "About the Point of View Area" for additional information on the point of view.
See "About Comments" for additional information about comments.
Working with Comments in the Collaboration pane
In the "Collaboration pane" of the "Scorecard editor: Initiative Details tab," "Scorecard editor: Objective Details tab," and "Scorecard editor: KPI Details tab," you can view, add, or reply to comments for that particular initiative, objective, or KPI.
To work with comments in the Collaboration pane:
-
Open or edit the scorecard. See "Opening or Editing Scorecards" for additional information.
-
Open the initiative, objective, or KPI and navigate to the Collaboration pane. See "Opening Scorecard Objects" for additional information about how to open an object.
-
Ensure that the values that are displayed in the point of view area reflect the desired context for the comment. (For example, you might want to comment on a KPI status for the Eastern region.)
-
Do one of the following:
-
To add a new comment, click the New Comment button. The "New Comment dialog" is displayed.
Comments added by clicking the New Comment button are associated with the status (that is, the Status column) of the objective, initiative, or KPI.
For KPIs only, you can also associate a comment with other columns such as Trend, Target, or Variance. To do so, edit the parent object, right-click on the relevant cell in the "Watchlists" and select Add Comment.
-
To reply to a comment, locate the comment to which you want to reply and click the Reply link. The "Reply dialog" is displayed.
-
-
Enter the subject of your comment (for a new comment only) and the text of your comment.
-
Click OK.
Working with Comments in Watchlists
In a watchlist, you can view, add, and reply to comments for initiatives, objectives, and KPIs that are displayed in the watchlist. See "Watchlists" for additional information about watchlists.
To work with comments in a watchlist:
-
Open or edit the scorecard. See "Opening or Editing Scorecards" for additional information.
-
Open the object in which you want to work with comments and navigate to the appropriate pane or tab. See "Opening Scorecard Objects" for additional information about how to open an object.
-
Ensure that the values that are displayed in the point of view area reflect the desired context for the comment. (For example, you might want to comment on a KPI status for the Eastern region.)
-
To add a new comment:
-
In the watchlist, right-click the Status cell to which you want to add the comment and select Add Comment. The "Add Comment dialog" is displayed.
-
Complete the Add Comment dialog and click OK.
-
-
To work with the comments that were previously added to an object, hover the mouse pointer over the Blue triangle in the upper-right corner of the cell in the Status column or, for a KPI, one of its columns.
The "Status window" is displayed. From this window, you can:
-
Read the comments that were previously added.
-
Display the "New Comment dialog" to add a new comment by clicking New Comment.
-
Display the "Reply dialog" to reply to a comment by clicking the Reply link.
-
Pin the window so that it stays open by clicking the Pin button.
-
Working with Comments in the Diagram Tab of a View
In the Diagram tab of a view, you can view, add, and reply to comments for objectives and KPIs that are displayed in the view. For example, you can work with comments in the "Strategy Tree tab: Diagram tab".
Note:
You can also work with comments in this same way when a view is rendered as a diagram in a dashboard.
To work with comments in the Diagram tab of a view:
-
Open or edit the scorecard. See "Opening or Editing Scorecards" for additional information.
-
Open the view in which you want to work with comments and navigate to the Diagram tab. See "Opening Scorecard Objects" for additional information about how to open an object.
-
Ensure that the values that are displayed in the point of view area reflect the desired context for the comment. (For example, you might want to comment on a KPI status for the Eastern region.)
-
To add a new comment:
-
Click the Options button on the right side of the node to which you want to add the comment and select Add Comment from the "Node Options Menu." The "New Comment dialog" is displayed.
-
Complete the Add Comment dialog and click OK.
-
-
To work with the comments that were previously added to an object, hover the mouse pointer over the Comment button in the upper-right corner of the node.
The "Status window" is displayed with all the comments that are attached to the initiative, objective, or KPI. From this window, you can:
-
Read the comments that were previously added.
-
Display the "New Comment dialog" to add a new comment by clicking New Comment.
-
Display the "Reply dialog" to reply to a comment by clicking the Reply link.
-
Pin the window so that it stays open by clicking the Pin button.
-
Understanding Initiative or Objective Performance Assessment
Oracle Business Intelligence assesses the performance of an initiative or objective by aggregating the assessments of its children. In the process, it uses:
-
Scorecard assessment mappings that you define. See "About Assessment Mappings" for additional information.
-
Assessment formulas (such as Weighted or Best Case) assigned to all objectives and initiatives. The assessment formulas include:
-
Worst case — Specifies that the status of the worst performing child KPI or objective is to be used.
-
Best case — Specifies that the status of the best performing child KPI or objective is to be used.
-
Most Frequent (Worst Case) — Specifies that, if half the child KPIs and objectives have high performance and half have low performance, then use the status of the worst performing child KPI or objective.
-
Most Frequent (Best Case) — Specifies that, if half the child KPIs and objectives have high performance and half have low performance, then use the status of the best performing child KPI or objective.
-
Weighted — Specifies to use a weighted average based on the weights you have assigned to the child KPIs and objectives. See "Assigning Weights to Child Objectives, Initiatives and KPIs" for additional information.
If a child KPI has no data, it will not be included in the aggregation. Instead, its weight will be distributed among the other child KPIs and objectives.
You assign assessment formulas when you create an objective or initiative. See "Creating Objectives" or "Creating Initiatives" for additional information on how to create an objective or initiative.
-
-
Weights that you assign to child initiatives, objectives, and KPIs (but only if the parent's assessment rule is set to Weighted) to identify the extent to which each child contributes to the overall performance of the parent. See "Assigning Weights to Child Objectives, Initiatives and KPIs" for additional information.
See "Example of Determining the Performance Assessment for an Objective Based on Child Objectives" and "Example of Determining the Performance Assessment for an Objective Based on a Child KPI" for examples of performance assessments.
About Assessment Mappings
Assessment mappings are the score thresholds and assessment ranges that Oracle Business Intelligence uses to assess the performance of objectives and initiatives.
Oracle Business Intelligence uses these score thresholds and assessment ranges to:
-
Determine the status and score of an objective or initiative based on the aggregation of the assessments of its children.
Note:
If the assessment formula of an objective or initiative is Best Case, Worst Case, Most Frequent (Worst Case), or Most Frequent (Best Case), the score will be one of the defined score thresholds, for example, 0, 33, or 66. If the assessment formula is Weighted, the score is computed based on the weights assigned to the children.
-
Map the KPI scores of KPIs that are used to measure the progress of initiatives and objectives to scorecard scores so that they can be used to measure the performance of the objectives or initiatives.
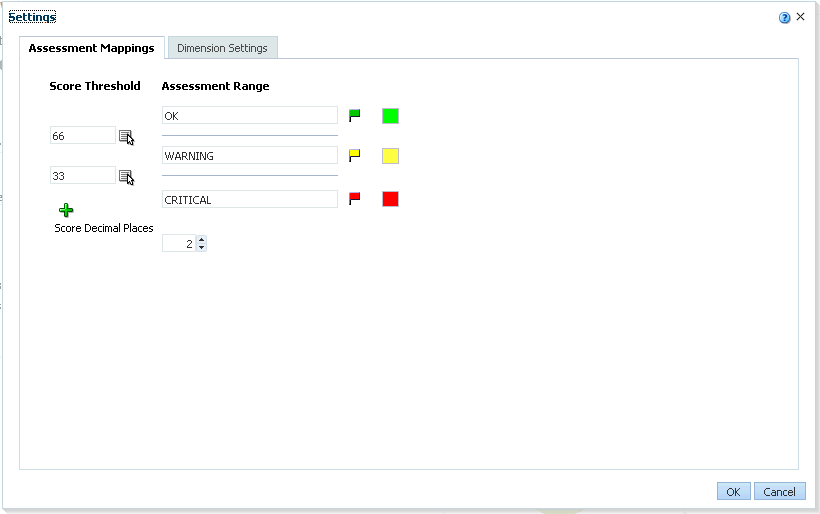
Figure 12-11 shows an example of score thresholds falling in specific assessment ranges. The assessment ranges are defined as follows:
-
67 to 100 falls in the OK assessment range
-
34 to 66 falls in the Warning assessment range
-
0 to 33 falls in the Critical assessment range
See "Understanding Initiative or Objective Performance Assessment" for additional information on initiative and objective performance assessment.
See "Defining Assessment Mappings for Scorecards" for how to define assessment mappings.
Example of Determining the Performance Assessment for an Objective Based on Child Objectives
Suppose the following about an objective named Improve Financial Results:
-
It has an assessment rule of Worst Case.
-
The assessment mappings defined for the scorecard that contains it are the same as those in Figure 12-11.
-
It has the following two child objectives:
-
Increase Sales, whose status is Critical and score is 0.
-
Reduce Cost, whose status is Warning and score is 50.
-
In this case, the performance assessment of the Improve Financial Results objective would be the status and score of the child with the worst status and score, that is, Increase Sales, which has a scorecard status of Critical and a score of 0.
Example of Determining the Performance Assessment for an Objective Based on a Child KPI
Suppose the following about an objective named Enhance Stockholder Satisfaction:
-
It has an assessment formula of Best Case.
-
The assessment mappings defined for the scorecard that contains it are the same as those in Figure 12-11.
-
It has a child KPI named Revenue KPI, whose scorecard status is OK and score is 66.
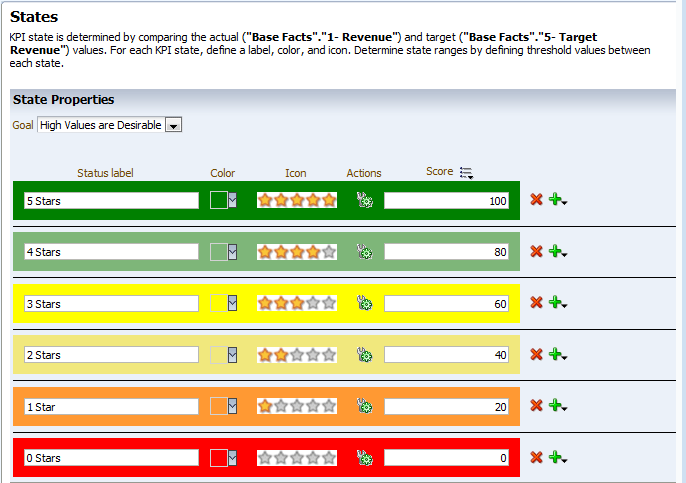
Note that Revenue KPI has a KPI status of 4 Stars and score of 80 based on the following KPI thresholds and scores displayed in Figure 12-12:
When Revenue KPI was added to the Enhance Stockholder Satisfaction objective, Oracle Business Intelligence mapped the KPI score to a scorecard score so that it could be used to measure the performance of the objective. Since the KPI score of 80 fell in the scorecard assessment range of 66 to 100, it mapped to a scorecard score of 66 and status of OK.
In this case, the performance assessment of the Enhanced Stockholder Satisfaction objective would be the status and score of the child with the best status and score, that is, Revenue KPI (in this case the only child), which has a scorecard status of OK and a score of 66.
Defining Assessment Mappings for Scorecards
You use the "Settings dialog: Assessment Mappings tab" to define the assessment mappings for a scorecard.
See "Understanding Initiative or Objective Performance Assessment" for additional information on initiative and objective performance assessment.
To define assessment mappings:
-
Edit the scorecard for which you want to define assessment mappings. See "Opening or Editing Scorecards" for additional information.
-
Click the Scorecard Settings toolbar button in the Scorecard editor.
The "Settings dialog: Assessment Mappings tab" is displayed.
-
In the Score Threshold fields, enter the numeric values that set the boundaries for the assessment ranges.
For example, you might enter 33 and 66 to set the boundaries for three assessment ranges — Critical, Warning, and OK. Any KPI score from 0 to 33 would fall in the Critical assessment range, any KPI score from 34 to 66 would fall in the Warning assessment range, and any KPI score from 66 to 100 would fall in the OK assessment range.
Best Practice:
Accept scores automatically assigned by the KPI editor, which are based on the number of thresholds. See "Creating KPIs" for additional information.
-
In the Assessment Range boxes, specify the name of each assessment range (for example, Critical) and, for each range, specify the icon and the color to be used to represent the range.
-
Click OK.
Assigning Weights to Child Objectives, Initiatives and KPIs
You assign weights to the child objectives, initiatives, and KPIs of an objective or initiative to indicate how much it affects the performance of its parent objective.
To assign weights to child objectives, initiatives, and KPIs, the Assessment Rule for the parent objective or initiative must be set to Weighted.
See "Understanding Initiative or Objective Performance Assessment" for additional information on objective and initiative performance.
To assign weights to child objectives, initiatives and KPIs of an objective or initiative:
-
Edit the scorecard that contains the parent objective or initiative of the objectives, initiatives, and KPIs to which you want to assign weights. See "Opening or Editing Scorecards" for additional information.
-
Open the parent objective or initiative. To do so, double-click the objective in the in the "Strategy pane" or the initiative in the "Initiatives pane."
-
In the Objectives & KPIs or Initiatives and KPIs watchlist of the "Analytics pane," enter a weight for each child objective, initiative, or KPI.
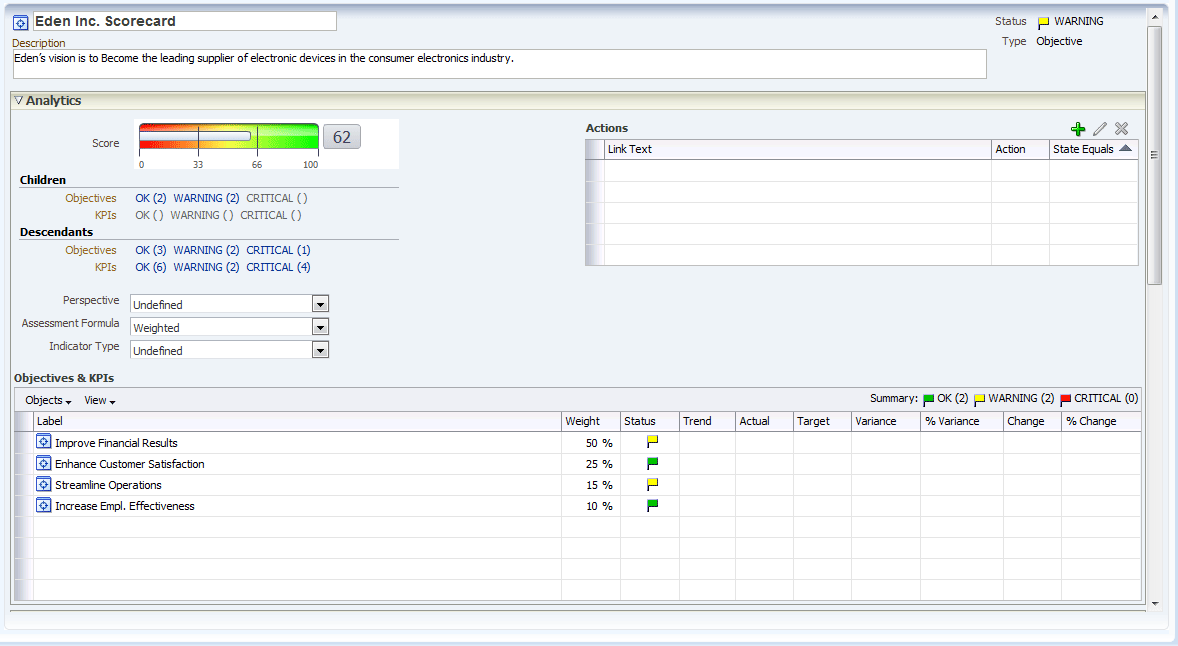
For example, in the Objectives & KPIs watchlist shown in Figure 12-13, these weights have been assigned to the four child objectives of the root objective Eden Inc Scorecard:
-
Improve Financial Results: 50%
-
Enhance Customer Satisfaction: 25%
-
Streamline Operations: 15%
-
Increase Empl Effectiveness: 10%
-
-
Click Save.
About Status Overrides
You can override the statuses of initiatives, objectives, or KPIs that measure the performance of initiatives and objectives. To override a status, you must be the business owner of the initiative, objective, or KPI. You can also cancel an override.
Note:
Before you can work with status overrides, your administrator must enable this feature. See "Configuring the Repository for Oracle Scorecard and Strategy Management" in Metadata Repository Builder's Guide for Oracle Business Intelligence Enterprise Edition for additional information.
You can work with status overrides in many places in a scorecard. For example, you can apply a status override to an objective in the "Scorecard editor: Objective Details tab." You can also apply a status override to an objective in the Diagram tab of a view, a smart watchlist, and a perspective in which its referenced.
A status override is associated with:
-
An initiative, objective, or KPI that measures the progress of an initiative and objective.
When an initiative, objective, or KPI that has a status override associated with it is referenced elsewhere in a scorecard, and the point of view being displayed matches that of the status override, a status override indicator — a red asterisk (*) — is displayed as follows:
-
In a watchlist, it is displayed to the right of the status symbol in the row containing the initiative, objective, or KPI. (See "Watchlists" for additional information.
-
In a node in the Diagram tab of a view, it is displayed to the right of the status symbol in the lower-left corner of the node.
-
-
The status column of an objective, initiative, or KPI.
-
A specific point of view.
Status overrides are filtered by the values in the point of view area in the "Scorecard editor" that are currently in effect for the object being viewed. As a result, the status override for Eastern Region Sales can be different than the status override for Western Region Sales. (See "About the Point of View Area" for additional information on the point of view.)
-
Any dimension pinnings on the KPI.
Status overrides are filtered by any other dimension pinnings which are in effect (on a KPI, scorecard, scorecard diagram, dashboard prompt, or KPI watchlist).
See "Working with Status Overrides" for additional information about how to work with status overrides.
Working with Status Overrides
You can work with status overrides in many places in a scorecard, including in:
-
Watchlists
See "Working with Comments in Watchlists" for additional information
-
The Diagram tab of a view.
See "Working with Status Overrides in the Diagram Tab of a View" for additional information
As you work with status overrides, remember that a status override is associated with a specific point of view. See "About the Point of View Area" for additional information.
Tip:
Prior to overriding a status, ensure that the business owner has been set for the KPI, initiative, or objective. See "Creating KPIs" for additional information on how to add a business owner to a KPI.
See "About Status Overrides" for additional information about status overrides.
Working with Status Overrides in Watchlists
In a watchlist, you can view status overrides and override cancellations that were previously applied, and apply new overrides and override cancellations to the initiatives or objectives, and KPIs in the watchlist. See "Watchlists" for additional information.
To work with status overrides in a watchlist:
-
Open or edit the scorecard. See "Opening or Editing Scorecards" for additional information.
-
Open the object in which you want to work with status overrides and navigate to the appropriate pane or tab. See "Opening Scorecard Objects" for additional information about how to open an object.
-
Ensure that the values that are displayed in the point of view area reflect the desired context for the status override. (For example, you might want to override the status of a KPI for the Eastern region.)
-
To override a status or to cancel an override:
-
In the watchlist, right-click the Status cell in which you want to override the status or cancel an override and select Override Status. The "Status Override dialog" is displayed.
-
Complete the Status Override dialog and click OK.
-
-
To view status overrides or override cancellations that were previously applied to an object, hover the mouse pointer over the red asterisk to the right of the status symbol.
The "Status window" is displayed. From this window, you can:
-
View status overrides or override cancellations that were previously applied.
-
Display the Status Override dialog to apply a new override or to cancel an override by clicking New Override.
-
Pin the window so that it stays open by clicking the Pin button.
-
Working with Status Overrides in the Diagram Tab of a View
In the Diagram tab of a view, you can view status overrides and override cancellations that were previously applied, and apply new overrides and override cancellations to objectives and KPIs that are displayed in the view. For example, you can work with status overrides in the "Strategy Tree tab: Diagram tab."
To work with status overrides in the Diagram tab of a view:
-
Open or edit the scorecard. See "Opening or Editing Scorecards" for additional information.
-
Open the view in which you want to work with status overrides and navigate to the Diagram tab. See "Opening Scorecard Objects" for additional information about how to open an object.
-
Ensure that the values that are displayed in the point of view area reflect the desired context for the status override. (For example, you might want to override the status of a KPI for the Eastern region.)
-
To apply a new status override:
-
Click the Options button on the right side of the node to which you want to apply the status override and select Override Status from the "Node Options Menu." The "Status Override dialog" is displayed.
-
Complete the Status Override dialog and click OK.
-
-
To view status overrides that were previously applied to an object, hover the mouse pointer over the red asterisk to the right of the status symbol.
The "Status window" is displayed. From this window, you can:
-
View status overrides that were previously applied.
-
Display the Status Override dialog to apply a new override by clicking New Override.
-
Pin the window so that it stays open by clicking the Pin button.
-
What Are Strategy Trees?
A strategy tree shows an objective and its supporting child objectives and KPIs hierarchically. It also provides supporting information for the objective, such as business owner and related documents.
A strategy tree lets you easily explore and navigate:
-
The strategy for an entire scorecard (that is, the root objective) for example, ABC Corporation
-
The strategy for an individual objective, for example, Decrease Support Turnaround.
There are two types of diagrams for a strategy tree:
-
Strategy tree diagram. See "Understanding a Strategy Tree Diagram" for additional information.
-
Strategy contribution wheel diagram. See "Understanding a Strategy Contribution Wheel Diagram" for additional information.
See "Creating Strategy Trees" for additional information on creating a strategy tree.
Understanding a Strategy Tree Diagram
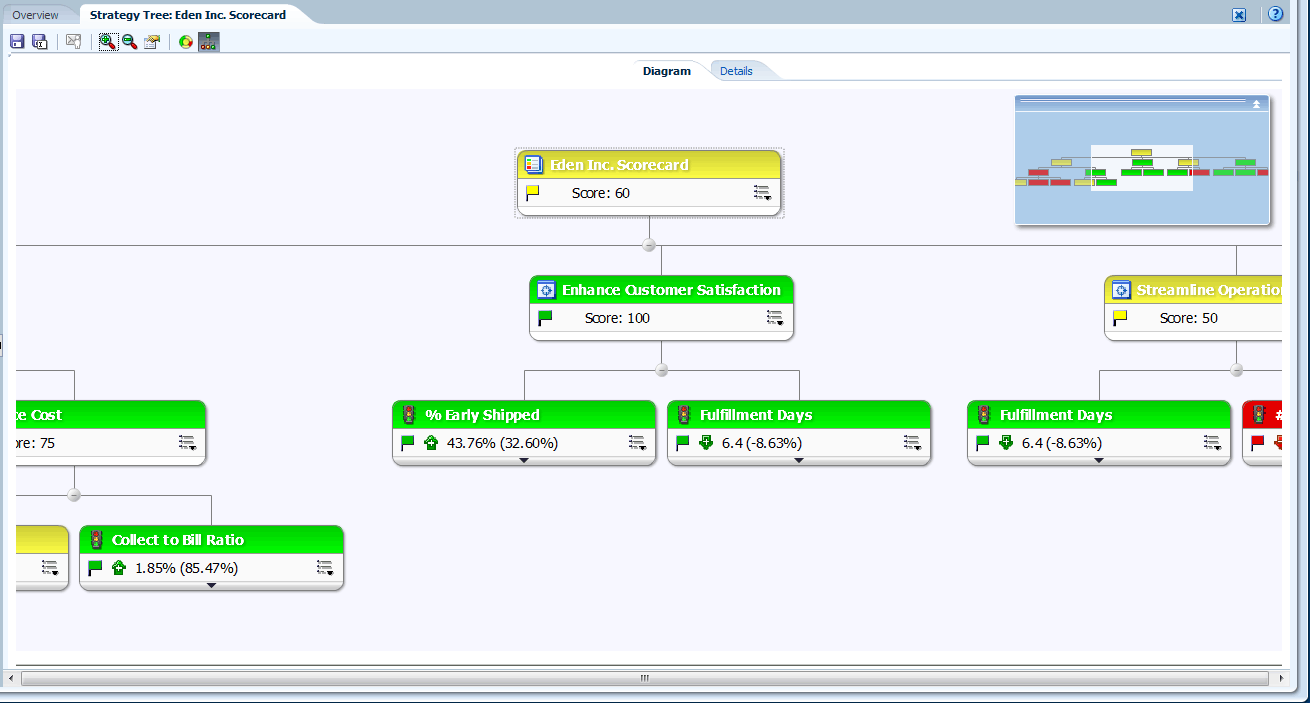
You use a strategy tree diagram to view an objective and its supporting child objectives and KPIs hierarchically in a tree diagram. It contains the following components:
-
The tree diagram — Consists of nodes that represent an objective and its supporting objectives and KPIs. Each node shows the status of the objective or KPI by displaying the icon and color that represents the assessment range. A KPI node also displays the actual value of the KPI and the percent variance from the target.
-
The bird's eye view — Provides an overhead view of the tree diagram.
Figure 12-15 shows an example of a strategy tree diagram for the Eden Inc scorecard.
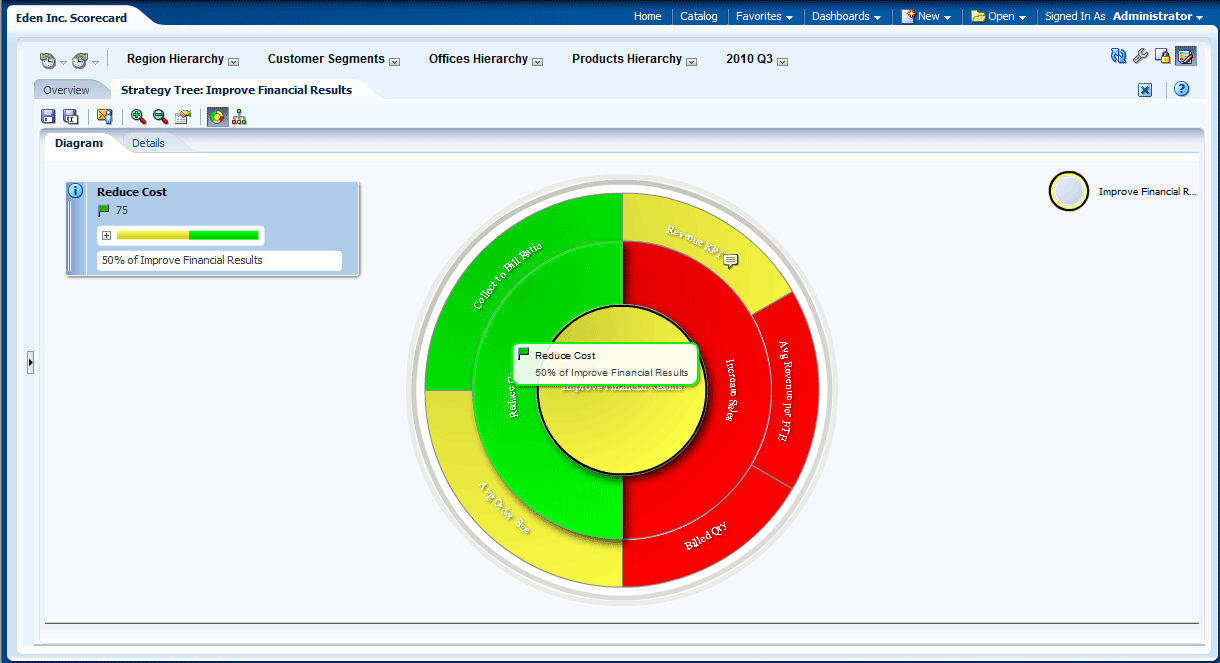
Understanding a Strategy Contribution Wheel Diagram
You use a strategy contribution wheel diagram to hierarchically view an objective and its supporting child objectives and KPIs in a circular diagram called a strategy contribution wheel diagram. The strategy contribution wheel diagram makes it easy to see the contribution (or impact) a specific objective or KPI has on a parent objective. It contains the following components:
-
Strategy contribution wheel — Consists of a center circle (or focus node) that represents the starting objective of the diagram. It is surrounded by concentric circles that are divided into sectors. Each sector is a node that represents a child objective or KPI.
The size of a sector is determined by the weight assigned to the represented objective or KPI in its parent's weighted assessment rule. See "Assigning Weights to Child Objectives, Initiatives and KPIs" for additional information on assigning weights. If the parent has no weighted assessment rule, then the child sectors of a parent are all the same size.
-
Information pane — Displays the following information about the current node:
-
The status icon and either the score (for an objective) or the actual values and variance percentage (for a KPI)
-
The status of its children
-
The weight assigned to it in its parent's weighted assessment rule
-
-
Focus trail — Consists of a group of small circles that represent the node in the center of the strategy contribution wheel and any of its ancestors that are included in the diagram. Each circle displays the status color of its corresponding node.
Figure 12-15 shows an example of a strategy contribution wheel diagram for the Improve Financial Results objective. The Reduce Cost subordinate objective is highlighted.
Creating Strategy Trees
You can create a strategy tree for the entire scorecard or for a specific objective as follows:
-
In Edit mode, you can create and save a strategy tree for an entire scorecard and for specific objectives.
-
In View mode, you can create a temporary, read-only strategy tree only for specific objectives. You cannot save the strategy tree.
See "Using the Edit and View Modes in the Scorecard Editor" for additional information about the Edit and View modes.
To create a strategy tree:
-
If you want to:
-
Create and save a strategy tree for an entire scorecard or for a specific objective, edit the scorecard in which you want to create the strategy tree. See "Opening or Editing Scorecards" for additional information.
-
Create but not save a temporary, read-only strategy tree only for a specific objective, open the scorecard. See "Opening or Editing Scorecards" for additional information.
-
-
To create a strategy tree for:
-
The entire scorecard (the root objective), in the "Scorecard Documents pane," click the New Object toolbar button and select Create Strategy Tree.
-
For a specific objective, in the "Strategy pane," right-click the objective and then select View Strategy Tree.
The "Strategy Tree tab: Diagram tab" is displayed, showing the objective and its supporting child objectives and KPIs hierarchically in a diagram.
-
-
In a strategy tree diagram, to:
-
Display options that enable you to work with a node, click the Options button (on the right side of the node) to display the "Node Options Menu."
-
Display additional performance data for a KPI, such as target value or variance, click the down arrow at the bottom center of the node. To collapse this data, click the up arrow.
-
Expand or collapse a node, click the plus (+) or minus (-) icon beneath the node.
-
Zoom in and out of the diagram, use the toolbar buttons on the "Scorecard editor: Strategy Tree tab."
-
Work with comments:
-
Hover the mouse pointer over the Comment button in the upper-right corner of a node to display the "Status window," where you can read the comments that were previously added, add another comment, or reply to a comment.
-
Click the Options button on the right side of the node to which you want to add a comment and select Add Comment from the "Node Options Menu." The "New Comment dialog" is displayed, where you can add a comment or read any comments that were previously added.
See "About Comments" and "Working with Comments" for additional information.
-
-
Work with status overrides on nodes for which you are the business owner:
-
Hover the mouse over the red asterisk (if available) in a node to display the "Status window," where you can view the overrides that were previously applied or apply another override.
-
Click the Options button on the right side of the node to which you want to apply the status override and select Override Status from the "Node Options Menu." The "Status Override dialog" is displayed, where you apply another override or view any overrides that were previously applied.
See "About Status Overrides" and "Working with Status Overrides" for additional information.
-
-
Change the type of diagram to a strategy contribution wheel diagram, right-click in the background outside the tree and select View as Wheel Diagram or click the Wheel Diagram Type toolbar button in the "Scorecard editor: Strategy Tree tab."
-
-
In a strategy contribution wheel diagram, to:
-
Display information specific to a node (such as the weight assigned to it in its parent's assessment rule), hover the mouse over the node.
-
Display options that allow you to work with a node, right-click the node to display the "Node Options Menu." For example, you can change the focus of the wheel using the Focus on Node and Focus up to Node options.
-
Change the focus of the wheel down to a descendant, double-click the descendant node.
-
Zoom in and out of the diagram or set properties for the strategy tree, use the toolbar buttons on the "Scorecard editor: Strategy Tree tab."
-
Drill to the next level or collapse a level, hover the mouse over the concentric rings on the outer border of the wheel and click the Drill to next level or Collapse Level triangle.
-
Expand or collapse a node or group of nodes that appear as slivers (that is, appear very thin) in the diagram, click the Expand Section triangle or the Collapse Section triangle that displays when you hover over it. You can expand only slivers in the second concentric circle around the center and farther out.
-
Work with comments (if any), click the Comment button in a node to display the "Status window," where you can read the comments that previously have been added, add another comment, or reply to a comment. See "About Comments" for additional information.
-
Work with status overrides (if any), click the white dashed line around the border of a node to display the "Status window," where you can view the overrides that previously have been applied or apply another override. See "About Status Overrides" for additional information.
-
Change the type of diagram to a strategy tree diagram, right-click in the background outside the wheel and select View as Tree Diagram or click the Tree Diagram Type toolbar button in the "Scorecard editor: Strategy Tree tab."
-
-
To set properties that control the appearance of the diagrams, click the Properties toolbar button on the "Scorecard editor: Strategy Tree tab."
The "Strategy Tree View Properties dialog" is displayed.
-
Specify the property settings to achieve the desired appearance, and then click OK.
-
Click the "Strategy Tree tab: Details tab."
-
Specify a description, assign the business owner, and specify related documents, as appropriate. (By default, the business owner is the creator of the scorecard.)
-
Click Save to display the "Save As dialog." In the Save As dialog, you can rename the strategy tree rather than use the default name.
What Are Strategy Maps?
A strategy map shows how the objectives that have been defined for a scorecard and the KPIs that measure their progress are aligned by perspectives. It also indicates cause and effect relationships between objectives and other objectives or KPIs with connecting lines. You create cause and effect relationships when you create (or edit) an objective (see "Creating Objectives") or work with KPI details (see "Working with KPI Details"). You also can create cause and effect relationships in a strategy map.
Figure 12-16 shows an example of a strategy map for Eden Inc.
You can create multiple strategy maps to represent the strategy of different areas of your organization.
You can create strategy maps in Edit mode only. See "Using the Edit and View Modes in the Scorecard Editor" for additional information about the Edit and View modes.
See "Creating Strategy Maps" for additional information on creating strategy maps.
Best Practice:
Ensure that associated objectives and KPIs relate to each other and identify cause and effect relationships. Review these relationships periodically to identify areas that might need improvement to increase collaboration and communication, thus impacting existing objectives and KPIs.
Creating Strategy Maps
To create a strategy map:
-
Edit the scorecard in which you want to create the strategy map. See "Opening or Editing Scorecards" for additional information.
-
In the "Scorecard Documents pane," click the New Object toolbar button and select Create Strategy Map.
The "Strategy Map tab: Diagram tab" is displayed.
-
Build the map as follows:
-
Add objectives and KPIs that measure their progress by dragging them from the "Strategy pane" and dropping them in the diagram as follows:
-
If the objective or KPI is aligned with a specific perspective, then drop it anywhere in the diagram. It is displayed automatically in the section for the perspective to which the objective or KPI is associated.
You align an objective or KPI with a perspective when you create (or edit) the objective or KPI. See "Creating Objectives" for additional information. See "What Are Perspectives?" for additional information about perspectives.
-
If the objective or KPI is not associated with a perspective, then you drop it in the section for the perspective to which the objective or KPI is to be associated. Note that this does not permanently assign the perspective to this objective or KPI.
-
-
(optional) Add the direct cause and effect objects for the selected node (that is, the representation of an objective or KPI) to the diagram by right-clicking and selecting Add Related Strategy Nodes.
-
Add cause and effect relationships, as needed.
To add a cause and effect relationship, click the Draw A Casual Linkage Between Two Objectives button on the "Scorecard editor: Strategy Map tab" toolbar, select one of the nodes, and then select the second node. A line connecting the nodes is displayed.
If you want to delete a node from the map, then right-click the node and select Remove From Diagram.
-
-
To:
-
Display options that enable you to work with a node, click the Options button (on the right side of the node) to display the "Node Options Menu."
-
Edit a causal linkage, right-click the linkage line and select Edit Causal Linkage. The "Causal Linkage dialog" is displayed.
-
Delete a causal linkage, right-click the linkage line and select Delete Causal Linkage.
-
Display additional performance data for the KPI, such as target value or variance, click the down arrow at the bottom center of the representation. To collapse this data, click the up arrow.
-
Zoom in and out of the diagram, use the toolbar buttons on the "Scorecard editor: Strategy Map tab."
-
Work with comments:
-
Hover the mouse pointer over the Comment button in the upper-right corner of a node to display the "Status window," where you can read the comments that were previously added, add another comment, or reply to a comment.
-
Click the Options button on the right side of the node to which you want to add a comment and select Add Comment from the "Node Options Menu." The "New Comment dialog" is displayed, where you can add a comment or read any comments that were previously added.
See "About Comments" and "Working with Comments" for additional information.
-
-
Work with status overrides on nodes for which you are the business owner:
-
Hover the mouse over the red asterisk (if available) in a node to display the "Status window," where you can view the overrides that were previously applied or apply another override.
-
Click the Options button on the right side of the node to which you want to apply the status override and select Override Status from the "Node Options Menu." The "Status Override dialog" is displayed, where you apply another override or view any overrides that were previously applied.
See "About Status Overrides" and "Working with Status Overrides" for additional information.
-
-
-
Click the "Strategy Map tab: Details tab."
-
Specify a description, assign the business owner, and specify related documents, as appropriate. (By default, the business owner is the creator of the scorecard.)
-
Click Save to display the "Save As dialog." In the Save As dialog, you can rename the strategy map rather than use the default name.
What Are Cause & Effect Maps?
A cause & effect map lets you illustrate the cause and effect relationships of an objective or KPI that is listed in the "Strategy pane." (Note that cause & effect maps are diagrams that are used in scorecard and are not related to map views that are described in Chapter 3, "Adding Views for Display in Dashboards.")
Figure 12-17 shows an example of a cause & effect map for the Improve Financial Results objective.
You create cause and effect relationships for:
-
An objective when you create or edit the objective and identify:
-
Other objectives or KPIs that impact or support the objective (causes)
-
Other objectives or KPIs that this objective impacts or supports (effects)
See "Creating Objectives" for additional information.
-
-
A KPI when you work with KPI details.
-
Other objectives or KPIs that impact or support the KPI (causes)
-
Other objectives or KPIs that this KPI impacts or supports (effects)
(See "Working with KPI Details" for additional information.
-
A cause and effect map also indicates the proportionality (that is, whether changes in performance or value in the cause and effect relationship are directly proportional (direct) or inversely proportional (inverse) and strength (strong, moderate, or weak) of cause & effect relationships using symbols.
A cause & effect map helps you to better understand the implications of future strategic changes.
You can create a cause & effect map in either Edit or View mode:
-
In Edit mode, you can create and save a cause & effect map.
-
In View mode, you can create a temporary, read-only cause & effect map. You cannot save it.
See "Using the Edit and View Modes in the Scorecard Editor" for additional information about the Edit and View modes.
Best Practice:
Create cause and effect linkages to automatically show operational metrics and dependencies.
See "Creating Cause & Effect Maps" for additional information on creating cause & effect maps.
Creating Cause & Effect Maps
You can create a cause & effect map for any objective or KPI that is listed in the "Strategy pane." See "What Are Cause & Effect Maps?" for additional information on cause & effect maps.
To create a cause & effect map:
-
If you want to:
-
Create and save a cause & effect map, edit the scorecard in which you want to create the cause & effect map. See "Opening or Editing Scorecards" for additional information.
-
Create but not save a temporary, read-only cause & effect map, open the scorecard in which you want to create the cause & effect map. See "Opening or Editing Scorecards" for additional information.
-
-
In the "Strategy pane," right-click the objective or KPI and then select View Cause & Effect Map.
The "Cause & Effect Map tab: Diagram tab" is displayed.
-
To:
-
Display options that enable you to work with a node, right-click the node or click the Options button (on the right side of the node) to display the "Node Options Menu."
-
Display additional performance data for a KPI, such as target value or variance, click the down arrow at the bottom center of the node. To collapse this data, click the up arrow.
-
Edit a causal linkage, right-click the linkage line and select Edit Causal Linkage. The "Causal Linkage dialog" is displayed.
-
Delete a causal linkage, right-click the linkage line and select Delete Causal Linkage.
-
Zoom in and out of the diagram or to set preferences, use the toolbar buttons on the "Scorecard editor: Cause & Effect Map tab."
-
Work with comments:
-
Hover the mouse pointer over the Comment button in the upper-right corner of a node to display the "Status window," where you can read the comments that were previously added, add another comment, or reply to a comment.
-
Click the Options button on the right side of the node to which you want to add a comment and select Add Comment from the "Node Options Menu." The "New Comment dialog" is displayed, where you can add a comment or read any comments that were previously added.
See "About Comments" and "Working with Comments" for additional information.
-
-
Work with status overrides on nodes for which you are the business owner:
-
Hover the mouse over the red asterisk (if available) in a node to display the "Status window," where you can view the overrides that were previously applied or apply another override.
-
Click the Options button on the right side of the node to which you want to apply the status override and select Override Status from the "Node Options Menu." The "Status Override dialog" is displayed, where you apply another override or view any overrides that were previously applied.
See "About Status Overrides" and "Working with Status Overrides" for additional information.
-
-
-
To specify how cause and effect relationships are to be displayed on the cause & effect map, click the Cause & Effect Map Preferences toolbar button on the "Scorecard editor: Cause & Effect Map tab."
The "Cause & Effect Map Preferences dialog: General tab" is displayed.
-
Specify how you want cause and effect relationships displayed and then click OK.
-
Click the "Cause & Effect Map tab: Details tab."
-
Specify a description, assign the business owner, and specify related documents, as appropriate. (By default, the business owner is the creator of the scorecard.)
-
Click Save to display the "Save As dialog." In the Save As dialog, you can rename the cause & effect map rather than use the default name.
Understanding Watchlists
"Watchlists" are tables that list scorecard objects (that is, initiatives, objectives, and KPIs) that are related to a particular aspect of a scorecard or that are grouped together for a particular purpose.
Some watchlists are components of scorecard objects. These include the following watchlists:
-
Initiatives & KPIs watchlist — Lists the child initiatives and the KPIs that are used to evaluate the performance of an initiative.
This watchlist is displayed in the "Analytics pane" of the "Scorecard editor: Initiative Details tab."
-
Objectives & KPIs watchlist — Lists the child objectives and the KPIs that are used to evaluate the performance of an objective or that are displayed in a view (that is, cause & effect map, custom view, strategy tree, or strategy map).
This watchlist is displayed in the following tabs:
-
Objectives, Initiatives & KPIs watchlist — Lists the initiatives, objectives, and KPIs that are associated with a perspective.
This watchlist is displayed in the "Scorecard editor: Perspective tab."
Other watchlists you create to serve a particular purpose. These include the following watchlists:
-
KPI watchlist — Lists the KPIs whose performance you want to monitor.
This watchlist is displayed in the "KPI Watchlist editor: Performance tab."
See "What Are KPI Watchlists?" for additional information on KPI watchlists.
-
Smart watchlist — Lists the initiatives, objectives, and KPIs within a scorecard that meet criteria that you specify.
This watchlist is displayed in the "Scorecard editor: Smart Watchlist tab."
See "What Are Smart Watchlists?" for additional information on smart watchlists.
-
Breakdown watchlist — Lists the child or descendant initiatives or objectives and KPIs that are used to evaluate the performance of an initiative or objective.
This watchlist is displayed in the "Scorecard editor: Breakdown tab."
A watchlist includes columns that describe the scorecard objects (such as Status, % Variance, and so on) and components (such as View or Summary) that allow you to view and manage these objects.
Figure 12-18 shows an example of an Objectives & KPIs watchlist. It lists two objectives — % Early Shipped and Fulfillment Days — that are used to evaluate the performance of an objective named Enhance Customer Satisfaction.
What Are KPI Watchlists?
A KPI watchlist is a collection of KPIs whose performance you want to monitor.
You can create KPI watchlists:
-
Within a scorecard. You create a KPI watchlist within a scorecard to help you view and investigate the progress of the objectives and initiatives. KPI watchlists that you create within a scorecard are saved as part of the scorecard. See "What Are Smart Watchlists?" for additional information.
-
Outside a scorecard. This enables you to create a KPI watchlist in advance of creating or editing a scorecard. KPI watchlists that you create outside a scorecard are saved as standalone objects in the Oracle BI Presentation Catalog.
For information on KPI watchlists and how to create them, see Chapter 11, "Using KPIs and KPI Watchlists."
Working with KPI Details
When you create initiatives and objectives, you can assign KPIs to them to measure their progress and performance. You can work with these KPIs within a Scorecard using the "Scorecard editor: KPI Details tab."
Specifically, you can:
-
View basic KPI settings as well as a graph that presents actual values and target values.
-
Override the label, description, and business owner that are defined for the KPI.
-
Pin dimensions. See "What Are Dimensions and Pinned Dimension Values?" for additional information on KPI dimensions and dimension pinning.
-
View documents that provide supporting information to the KPI.
-
Run actions that are associated with the KPI.
-
Associate the KPI with a perspective.
-
Specify an indicator type (for example, Leading) to indicate whether the performance of the KPI drives other KPIs, or is affected by the performance of other KPIs, or other data or processes.
-
View, add, or reply to comments.
-
Identify initiatives and KPIs (for a KPI listed in the "Initiatives pane") or objectives and KPIs (for a KPI listed in the "Strategy pane") that cause or effect the KPI.
To work with KPI details:
-
Edit the scorecard that contains the KPI. See "Opening or Editing Scorecards" for additional information.
-
If the KPI is assigned to an:
-
Initiative, double-click the KPI in the "Initiatives pane"
-
Objective, double-click the KPI in the "Strategy pane"
The Scorecard editor: KPI Details tab is displayed. Figure 12-19 shows an example of the KPI Details tab for the Fulfillment Days KPI.
-
-
Perform any of the following tasks:
-
Override one of the following items:
-
Label, using the Label field
-
Description, using the Description field
-
Business Owner, using the Business Owner field in the "Collaboration pane"
-
-
Pin dimensions using the Dimensionality area in the "Analytics pane."
-
Run actions that are associated with the KPI, using the action links in the Actions area of the Analytics pane.
-
Associate the KPI with a perspective, using the Perspective field in the Analytics pane.
-
Specify the indicator type, using the Indicator Type field in the Analytics pane.
-
View, add, or reply to comments, using the Collaboration pane. See "About Comments" for additional information on comments.
-
View documents that provide supporting information to the KPI, using the Related Documents area in the Collaboration pane.
-
Identify objectives that cause or effect the KPI, using the "Related Items pane."
-
-
If you made any changes, then click Save.
What Are Smart Watchlists?
A smart watchlist is a view into a particular scorecard based on criteria that you specify. For example, a smart watchlist might show the top ten KPIs in a scorecard based on best performance or all the objectives, initiatives, and KPIs in a scorecard that are owned by a specific business owner.
Figure 12-20 shows an example of a smart watchlist for the Improve Financial Results objective and all its descendants.
A smart watchlist consists of the following components:
-
Filter pane — This pane is displayed as a control panel, as a text summary, or is hidden, depending on the setting of the Filter Criteria Display component in the "Smart Watchlist Properties dialog." If displayed as a:
-
Control panel, it contains tabs that let you specify the criteria to be used to filter the smart watchlist. You can filter by object relationships, by object types, by perspective associations, by performance, and by business owner assignments.
-
Text summary, it displays a read-only text summary of the current filter criteria.
-
-
Smart watchlist — Lists the objectives, initiatives, and KPIs in a scorecard that meet the criteria specified in the Filter pane.
-
Smart watchlist toolbar — Contains buttons that allow you to save the smart watchlist and to specify smart watchlist properties, such as how the Filter pane is to be displayed (that is, as a control panel, a read-only text summary, or hidden).
You can create smart watchlists in Edit mode only.
In View mode, you can view a smart watchlist and, if the smart watchlist was saved with the Filter pane displayed as a control panel, you can specify filter criteria to dynamically change what is shown in the smart watchlist.
See "Using the Edit and View Modes in the Scorecard Editor" for additional information.
Best Practice:
Create smart watchlists as a conduit to properly align performance drivers (objectives and initiatives) with their proper business owners and to assist in arriving at a consensus between stakeholders that will build commitment to move goal and target setting along to achieve the stated and desired results.
You can also add smart watchlists to dashboards. If the smart watchlist was saved with the Filter pane displayed as a control panel, end users will be able to specify filter criteria to dynamically change what is shown in the smart watchlist.
See "Creating Smart Watchlists" for additional information.
Creating Smart Watchlists
To create a smart watchlist:
-
Edit the scorecard in which you want to create the smart watchlist. See "Opening or Editing Scorecards" for additional information.
-
In the "Scorecard Documents pane," click the New Object toolbar button and select Create Smart Watchlist.
The "Scorecard editor: Smart Watchlist tab" is displayed. Figure 12-21 shows an example of a smart watchlist for Eden Inc.
-
In the Filter pane, specify the filter criteria as follows:
-
In the "Filter pane: Relationship tab," specify the object relationships by which the scorecard objects are to be filtered. You can add objectives, initiatives, or KPIs by dragging the objects from the Strategy and Initiatives panes and dropping them in the "Filter pane: Relationship tab."
-
In the "Filter pane: Type tab," specify the object types by which the scorecard objects are to be filtered.
-
In the "Filter pane: Perspective tab," specify the perspective associations by which the scorecard objects are to be filtered.
-
In the "Filter pane: Performance tab," specify the performance criteria (status, score, or ranking) by which the scorecard objects are to be filtered.
-
In the "Filter pane: Ownership tab," specify the business owner assignments by which the scorecard objects are to be filtered.
-
-
Set smart watchlist properties. To do so, click the Properties toolbar button to display the "Smart Watchlist Properties dialog."
-
Manage the smart watchlist, as appropriate. See "Watchlists" for additional information.
-
Click Save to display the "Save As dialog." In the Save As dialog, you can rename the smart watchlist rather than use the default name.
What Are Custom Views?
A custom view lets you show a customized view of your business and strategy data. For example, you might present information about objectives and KPIs on a background image of your choice, such as your company logo.
You can create custom views in Edit mode only. See "Using the Edit and View Modes in the Scorecard Editor" for additional information. Figure 12-22 shows an example of a custom view.
See "Creating Custom Views" for additional information.
Creating Custom Views
To create a custom view:
-
Edit the scorecard in which you want to create the custom view. See "Opening or Editing Scorecards" for additional information.
-
In the "Scorecard Documents pane," click the New Object toolbar button and select Create Custom View.
The "Custom View tab: Diagram tab" is displayed.
-
Drag objectives and KPIs from the "Strategy pane" and drop them on the diagram.
-
Specify how you want each objective or KPI to be displayed on the diagram. For each objective or KPI, select it on the diagram and specify whether you want it displayed as:
-
Its full version. To do so, click the Full toolbar button.
-
Its simple version. To do so, click the Simple toolbar button.
-
One of its properties. To do so, click the Property toolbar button and select the property.
-
-
(optional) Specify a background image, a background color, or both by clicking the Properties toolbar button to display the "Custom View Properties dialog."
-
To:
-
Display options that enable you to work with a node, click the Options button (on the right side of the node) to display the "Node Options Menu."
-
Display additional performance data for the KPI, such as target value or variance, click the down arrow at the bottom center of the node. To collapse this data, click the up arrow.
-
Zoom in and zoom out of the diagram, use the toolbar buttons on the "Scorecard editor: Custom View tab."
-
Work with comments:
-
Hover the mouse pointer over the Comment button in the upper-right corner of a node to display the "Status window," where you can read the comments that were previously added, add another comment, or reply to a comment.
-
Click the Options button on the right side of the node to which you want to add a comment and select Add Comment from the "Node Options Menu." The "New Comment dialog" is displayed, where you can add a comment or read any comments that were previously added.
See "About Comments" and "Working with Comments" for additional information.
-
-
Work with status overrides on nodes for which you are the business owner:
-
Hover the mouse over the red asterisk (if available) in a node to display the "Status window," where you can view the overrides that were previously applied or apply another override.
-
Click the Options button on the right side of the node to which you want to apply the status override and select Override Status from the "Node Options Menu." The "Status Override dialog" is displayed, where you apply another override or view any overrides that were previously applied.
See "About Status Overrides" and "Working with Status Overrides" for additional information.
-
-
-
Click the "Custom View tab: Details tab."
-
Specify a description, assign the business owner, and specify related documents, as appropriate. (By default, the business owner is the creator of the scorecard.)
-
Click Save to display the "Save As dialog." In the Save As dialog, you can rename the cause & effect map rather than use the default name.
Opening Scorecard Objects
To open a scorecard object:
-
Open or edit the scorecard that contains the object. See "Opening or Editing Scorecards" for additional information.
-
To open:
-
An objective, double-click it in the "Strategy pane." "Scorecard editor: Objective Details tab" is displayed.
-
An initiative, double-click it in the "Initiatives pane." The "Scorecard editor: Initiative Details tab" is displayed.
-
A view (for example, a Strategy Map), a mission or vision statement, a KPI watchlist, or a smart watchlist, double-click it in the "Scorecard Documents pane." Depending on the object you double-clicked, one of the following tabs is displayed:
-
A perspective, double-click it in the "Perspectives pane." The "Scorecard editor: Perspective tab" is displayed.
-
A KPI, double-click it in the:
-
"Strategy pane" or the "Initiatives pane." The "Scorecard editor: KPI Details tab" is displayed.
-
"Catalog pane for Scorecard." The "Scorecard editor: KPI tab" is displayed.
-
Alternatively, you can select the object and click the Open button on the tab toolbar or right-click the initiative or objective and select the Open option.
-
Editing Scorecard Objects
You can edit scorecard objects in the "Scorecard editor."
(You also can edit scorecard objects from the "Catalog page." See "Managing Objects in the Oracle BI Presentation Catalog" for additional information.)
To edit a scorecard object in the Scorecard editor:
-
Edit the scorecard that contains the scorecard object that you want to edit. See "Opening or Editing Scorecards" for additional information.
-
Double-click the object. For example, to edit an objective, double-click it in the "Strategy pane," or, to edit a strategy map, double-click it in the "Scorecard Documents pane."
Note, for a strategy tree, you can edit only the details of a strategy tree, not the diagram.
-
Make your changes.
-
Click Save.
Deleting Scorecard Objects
You can delete scorecard objects from the "Scorecard editor."
(You also can delete scorecard objects from the "Catalog page." See "Managing Objects in the Oracle BI Presentation Catalog" for additional information.)
Caution:
Before deleting an initiative, ensure that it has been completed or is no longer required to achieve an objective. Before deleting an objective, examine any child objectives or other objectives with which it is linked to ensure that its removal does not negatively impact these objectives.
To delete a scorecard object from the Scorecard editor:
-
Edit the scorecard that contains the scorecard object that you want to delete. See "Opening or Editing Scorecards" for additional information.
-
Right-click the object and select Delete. For example, to delete a Strategy Map, right-click it in the "Scorecard Documents pane" and select Delete.
-
In the confirmation dialog, confirm that you want to delete the object.
Adding Scorecard Objects to Dashboards
You can add the following scorecard objects to dashboards:
-
Cause & effect maps. See "What Are Cause & Effect Maps?"
-
Custom views. See "What Are Custom Views?"
-
Strategy maps. See "What Are Strategy Maps?"
-
Strategy trees. See "What Are Strategy Trees?"
-
KPI watchlists. See "What Are KPI Watchlists?"
-
Smart watchlists. See "What Are Smart Watchlists?"
Best Practice:
Embed scorecard visualizations (for example, smart watchlists or cause and effect maps) into dashboards for fostering interactive analysis.
See "Adding Content to Dashboards" for additional information.
Troubleshooting
In solving problems that you might encounter while using Oracle Scorecard and Strategy Management, you might find the following information helpful:
-
For information on logging, see "Diagnosing and Resolving Issues in Oracle Business Intelligence" in System Administrator's Guide for Oracle Business Intelligence Enterprise Edition.
-
If the features to add comments and to override statuses are not enabled, see "Configuring the Repository for Oracle Scorecard and Strategy Management" in Metadata Repository Builder's Guide for Oracle Business Intelligence Enterprise Edition.
-
For problems with the ability to create or access scorecard objects, see the information on privileges and permissions in Chapter 13, "Managing Objects in the Oracle BI Presentation Catalog" and "Managing Presentation Services Privileges" in Security Guide for Oracle Business Intelligence Enterprise Edition.

