7 Administering Web Services
This chapter describes how to administer WebLogic Web services developed using Java API for XML-based Web services (JAX-WS).
This chapter includes the following topics:
-
Using the Oracle Enterprise Manager Fusion Middleware Control
-
Using Work Managers to Prioritize Web Services Work and Reduce Stuck Execute Threads
Overview of WebLogic Web Services Administration Tasks
When you use the jwsc Ant task to compile and package a WebLogic Web service, the task packages it as part of an Enterprise application. The Web service itself is packaged inside the Enterprise application as a Web application WAR file, by default. However, if your JWS file implements a session bean then the Web service is packaged as an EJB JAR file. Therefore, basic administration of Web services is very similar to basic administration of standard Java Platform, Enterprise Edition (Java EE) Version 5 applications and modules. These standard tasks include:
-
Installing the Enterprise application that contains the Web service.
-
Starting and stopping the deployed Enterprise application.
-
Configuring the Enterprise application and the archive file which implements the actual Web service. You can configure general characteristics of the Enterprise application, such as the deployment order, or module-specific characteristics, such as session time-out for Web applications or transaction type for EJBs.
-
Creating and updating the Enterprise application's deployment plan.
-
Monitoring the Enterprise application.
-
Testing the Enterprise application.
The following administrative tasks are specific to Web services:
-
Configuring the WS-Policy files associated with a Web service endpoint or its operations.
-
Viewing the SOAP handlers associated with the Web service.
-
Viewing the WSDL of the Web service.
-
Creating a Web service security configuration.
Administration Tools
There are a variety of ways to administer Java EE modules and applications that run on WebLogic Server, including Web services; use the tool that best fits your needs:
Using the WebLogic Server Administration Console
The WebLogic Server Administration Console is a Web browser-based, graphical user interface you use to manage a WebLogic Server domain, one or more WebLogic Server instances, clusters, and applications, including Web services, that are deployed to the server or cluster.
One instance of WebLogic Server in each domain is configured as an Administration Server. The Administration Server provides a central point for managing a WebLogic Server domain. All other WebLogic Server instances in a domain are called Managed Servers. In a domain with only a single WebLogic Server instance, that server functions both as Administration Server and Managed Server. The Administration Server hosts the Administration Console, which is a Web Application accessible from any supported Web browser with network access to the Administration Server.
You can use the WebLogic Administration Console to:
For more information about using the Administration Console to administer Web services, see the Oracle WebLogic Server Administration Console Help.
The following sections provide more details on the following topics:
For information about monitoring Web services and clients, see Monitoring Web Services and Clients.
Invoking the Administration Console
To invoke the Administration Console in your browser, enter the following URL:
http://host:port/console
where
-
hostrefers to the computer on which the Administration Server is running. -
portrefers to the port number where the Administration Server is listening for connection requests. The default port number for the Administration server is 7001.
Click the Help button, located at the top right corner of the Administration Console, to invoke the Online Help for detailed instructions on using the Administration Console.
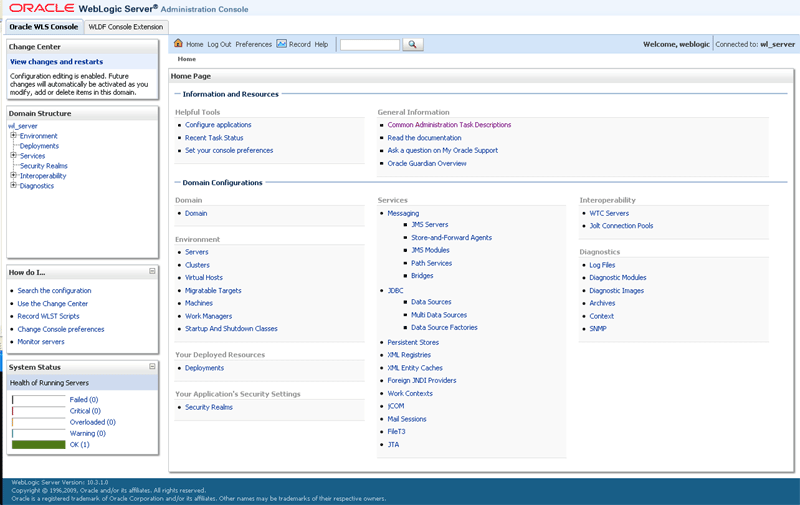
The following figure shows the main Administration Console window.
Figure 7-1 WebLogic Server Administration Console Main Window

Description of "Figure 7-1 WebLogic Server Administration Console Main Window"
How Web Services Are Displayed In the Administration Console
Web services are typically deployed to WebLogic Server as part of an Enterprise Application. The Enterprise Application can be either archived as an EAR, or be in exploded directory format. The Web service itself is almost always packaged as a Web Application; the only exception is if your JWS file implements a session bean in which case it is packaged as an EJB. The Web service can be in archived format (WAR or EJB JAR file, respectively) or as an exploded directory.
It is not required that a Web service be installed as part of an Enterprise application; it can be installed as just the Web Application or EJB. However, Oracle recommends that users install the Web service as part of an Enterprise application. The WebLogic Ant task used to create a Web service, jwsc, always packages the generated Web service into an Enterprise application.
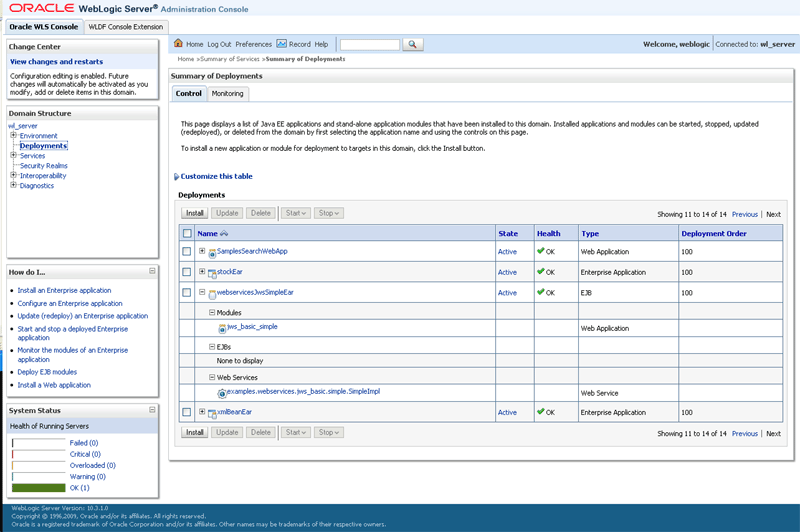
To view and update the Web service-specific configuration information about a Web service using the Administration Console, click on the Deployments node in the left pane and, in the Deployments table that appears in the right pane, locate the Enterprise application in which the Web service is packaged. Expand the application by clicking the + node; the Web services in the application are listed under the Web Services category. Click on the name of the Web service to view or update its configuration.
The following figure shows how the HelloWorldService Web service, packaged inside the helloWorldEar Enterprise application, is displayed in the Deployments table of the Administration Console.
Figure 7-2 WebLogic Server Administration Console Main Window

Description of "Figure 7-2 WebLogic Server Administration Console Main Window"
Creating a Web Services Security Configuration
When a deployed WebLogic Web service has been configured to use message-level security (encryption and digital signatures, as described by the WS-Security specification), the Web services runtime determines whether a Web service security configuration is also associated with the service. This security configuration specifies information such as whether to use an X.509 certificate for identity, whether to use password digests, the keystore to be used for encryption, and so on. A single security configuration can be associated with many Web services.
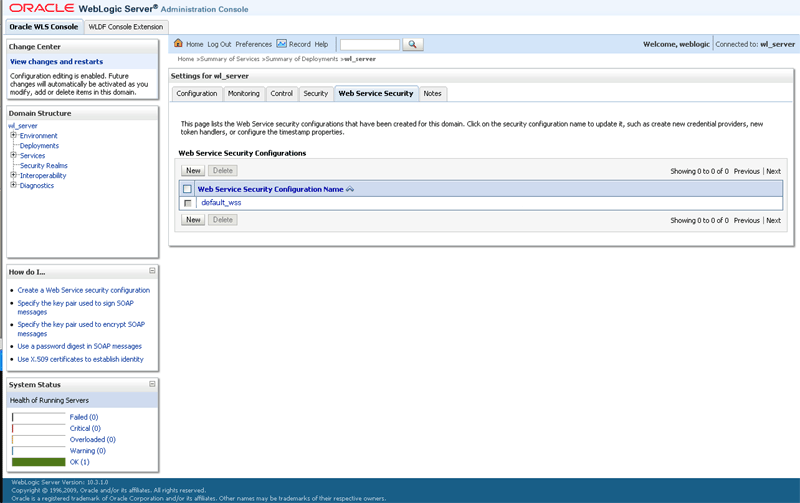
Because Web services security configurations are domain-wide, you create them from the domainName > WebService Security tab of the Administration Console, rather than the Deployments tab. The following figure shows the location of this tab.
Figure 7-3 Web Service Security Configuration in Administration Console

Description of "Figure 7-3 Web Service Security Configuration in Administration Console"
Using the Oracle Enterprise Manager Fusion Middleware Control
The Oracle Enterprise Manager Fusion Middleware Control (Fusion Middleware Control) Fusion Middleware Control is a Web browser-based, graphical user interface that you can use to monitor and administer a farm. A farm is a collection of components managed by Fusion Middleware Control. It can contain Oracle WebLogic Server domains, one or more Managed Servers and the Oracle Fusion Middleware system components that are installed, configured, and running in the domain.
Fusion Middleware Control organizes a wide variety of performance data and administrative functions into distinct, Web-based home pages for the farm, Oracle WebLogic Server domain, components, and applications. The Fusion Middleware Control home pages make it easy to locate the most important monitoring data and the most commonly used administrative functions—all from your Web browser.
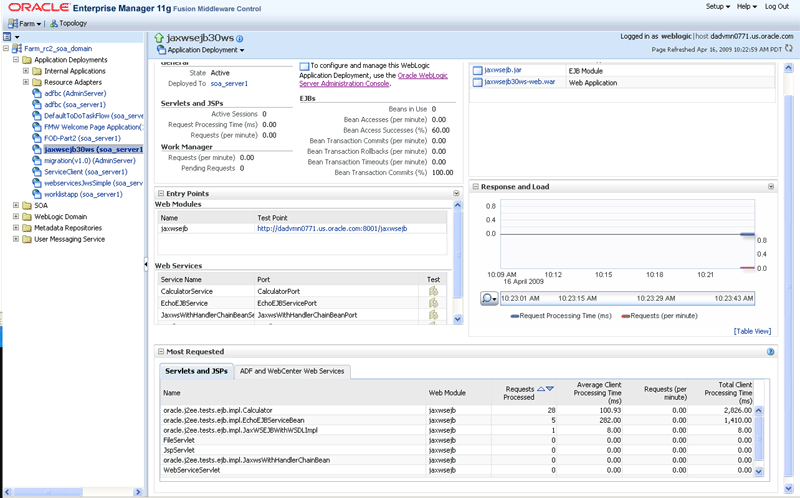
The following figure shows Fusion Middleware Control.
Figure 7-4 Oracle Enterprise Manager Fusion Middleware Control

Description of "Figure 7-4 Oracle Enterprise Manager Fusion Middleware Control"
For more information about monitoring and testing Web services using the Enterprise Manager, see "Securing and Administering WebLogic Web Services" in Security and Administrator's Guide for Web Services.
Fusion Middleware Control is available as part of the Oracle Fusion Middleware product; it is not available to you if you purchase the standalone version of Oracle WebLogic Server. For more information about Fusion Middleware Control, see "Getting Started Using Oracle Enterprise Manager Fusion Middleware Control" in Oracle Application Server Administrator's Guide.
Using the WebLogic Scripting Tool
The WebLogic Scripting Tool (WLST) is a command-line scripting interface that you can use to interact with and configure WebLogic Server domains and instances, as well as deploy Java EE modules and applications (including Web services) to a particular WebLogic Server instance. Using WLST, system administrators and operators can initiate, manage, and persist WebLogic Server configuration changes.
Typically, the types of WLST commands you use to administer Web services fall under the Deployment category.
For more information on using WLST, see Oracle WebLogic Scripting Tool.
Using WebLogic Ant Tasks
WebLogic Server includes a variety of Ant tasks that you can use to centralize many of the configuration and administrative tasks into a single Ant build script. These Ant tasks can:
-
Create, start, and configure a new WebLogic Server domain, using the
wlserverandwlconfigAnt tasks. -
Deploy a compiled application to the newly-created domain, using the
wldeployAnt task.
See "Using Ant Tasks to Configure and Use a WebLogic Server Domain" and "wldeploy Ant Task Reference" in Developing Applications for Oracle WebLogic Server for specific information about the non-Web services related WebLogic Ant tasks.
Using the Java Management Extensions (JMX)
A managed bean (MBean) is a Java bean that provides a Java Management Extensions (JMX) interface. JMX is the Java EE solution for monitoring and managing resources on a network. Like SNMP and other management standards, JMX is a public specification and many vendors of commonly used monitoring products support it.
WebLogic Server provides a set of MBeans that you can use to configure, monitor, and manage WebLogic Server resources through JMX. WebLogic Web services also have their own set of MBeans that you can use to perform some Web service administrative tasks.
There are two types of MBeans: runtime (for read-only monitoring information) and configuration (for configuring the Web service after it has been deployed).
The configuration Web services MBeans are:
-
WebserviceSecurityConfigurationMBean -
WebserviceCredentialProviderMBean -
WebserviceSecurityMBean -
WebserviceSecurityTokenMBean -
WebserviceTimestampMBean -
WebserviceTokenHandlerMBean
The runtime Web services MBeans are:
-
WseeRuntimeMBean -
WseeHandlerRuntimeMBean -
WseePortRuntimeMBean -
WseeOperationRuntimeMBean -
WseePolicyRuntimeMBean
For more information on JMX, see the Oracle WebLogic Server MBean Reference and the following sections in Developing Custom Management Utilities With JMX for Oracle WebLogic Server:
Using the Java EE Deployment API
In Java EE 5, the Java EE Application Deployment specification (JSR-88), described at http://jcp.org/en/jsr/detail?id=88, defines a standard API that you can use to configure an application for deployment to a target application server environment.
The specification describes the Java EE Deployment architecture, which in turn defines the contracts that enable tools or application programmers to configure and deploy applications on any Java EE platform product. The contracts define a uniform model between tools and Java EE platform products for application deployment configuration and deployment. The Deployment architecture makes it easier to deploy applications: Deployers do not have to learn all the features of many different Java EE deployment tools in order to deploy an application on many different Java EE platform products.
See Deploying Applications to Oracle WebLogic Server for more information.
Using Work Managers to Prioritize Web Services Work and Reduce Stuck Execute Threads
After a connection has been established between a client application and a Web service, the interactions between the two are ideally smooth and quick, whereby the client makes requests and the service responds in a prompt and timely manner. Sometimes, however, a client application might take a long time to make a new request, during which the Web service waits to respond, possibly for the life of the WebLogic Server instance; this is often referred to as a stuck execute thread. If, at any given moment, WebLogic Server has a lot of stuck execute threads, the overall performance of the server might degrade.
If a particular Web service gets into this state fairly often, you can specify how the service prioritizes the execution of its work by configuring a Work Manager and applying it to the service. For example, you can configure a response time request class (a specific type of Work Manager component) that specifies a response time goal for the Web service.
The following shows an example of how to define a response time request class in a deployment descriptor:
<work-manager>
    <name>responsetime_workmanager</name>
        <response-time-request-class>
            <name>my_response_time</name>
            <goal-ms>2000</goal-ms>
        </response-time-request-class>
</work-manager>
You can configure the response time request class using the Administration Console, as described in "Work Manager: Response Time: Configuration" in Oracle WebLogic Server Administration Console Help.
For more information about Work Managers in general and how to configure them for your Web service, see "Using Work Managers to Optimize Scheduled Work" in Configuring Server Environments for Oracle WebLogic Server.
Monitoring Web Services and Clients
You can monitor runtime information for Web services and clients, such as number of invocations, errors, faults, and so on, using the Administration Console or WLST.
The following naming convention is used to identify the Web service or client in the monitoring pages:
<application_name>#<application_version>!<service_name><contextpath><url_pattern>
Where:
-
application_name—Name of the application that contains the Web service or client. -
application_version—Version of the application that contains the Web service or client. -
service_name—Name of the Web service or client. -
context_path—Context path defined for the Web service. For more information, see "Defining the Context Path of a WebLogic Web Services" in WebLogic Web Services Reference for Oracle WebLogic Server. -
url_pattern—System default or user-defined Web service URL pattern. For more information, see "Specifying the Transport Used to Invoke the Web Service" in WebLogic Web Services Reference for Oracle WebLogic Server.
Monitoring Web Services
To monitor a Web service using the Administration Console, click on the Deployments node in the left pane and in the Deployments table that appears in the right pane, locate the Enterprise application in which the Web service is packaged. Expand the application by clicking the + node; the Web services in the application are listed under the Web Services category. Click on the name of the Web service and click the Monitoring tab.
Alternatively, click the Deployments node in the left pane, the Monitoring tab that appears in the right pane, and then the Web Service tab. Click on the name of the Web service for which you want to view monitoring statistics.
The following table lists the tabs that you can select to monitor Web service information. The pages aggregate the statistics of all the servers on which the Web service is running.
Note:
For JAX-WS Web services, the built-inWs-Protocol operation displays statistics that are relevant to the underlying WS-* protocols. This information is helpful in evaluating the application performance.Table 7-1 Monitoring Web Services
| Click this tab . . . | To view . . . |
|---|---|
|
Monitoring> General |
General statistics about the Web services, including total error and invocations counts. |
|
Monitoring> Invocations |
Invocation statistics, such as dispatch and execution times and averages. |
|
Monitoring> WS-Policy |
Policies that are attached to the Web service, organized into the following categories: authentication, authorization, confidentiality, and integrity. |
|
Monitoring> Ports |
Table listing the Web service endpoints (ports). The table provides a summary of information for each port. Click a port name to view more details. |
|
Monitoring> Ports > General |
General statistics about the Web service endpoint. The page displays information such as the Web service endpoint name, its URI, and its associated Web service, Enterprise application, and application module. Error and invocations counts are aggregated for all Web service endpoint operations. |
|
Monitoring> Ports > Invocations |
Invocation statistics for the Web service endpoint, such as success, fault, and violation counts. |
|
Monitoring> Ports > Cluster Routing |
Cluster routing statistics for the Web service endpoint, such as request and response, and routing failures. |
|
Monitoring> Ports > Make Connection |
MakeConnection anonymous endpoints for a Web service. For each anonymous endpoint, runtime monitoring information is displayed, such as the number of messages received, the number of messages pending, and so on. You can customize the information that is shown in the table by clicking Customize this table. Click the name of an anonymous endpoint to view more details. |
|
Monitoring> Ports > Reliable Message |
Reliable messaging sequences for a Web service. For each reliable messaging sequence, runtime monitoring information is displayed, such as the sequence state, the source and destination servers, and so on. You can customize the information that is shown in the table by clicking Customize this table. Click the sequence ID to view more details. |
|
Monitoring> Ports > Reliable Message > Requests |
Reliable messaging requests for a Web service. For each reliable messaging request, runtime monitoring information is displayed. You can customize the information that is shown in the table by clicking Customize this table. Click the reliable message ID to view more details. |
|
Monitoring> Ports > WS-Policy |
Statistics related to the policies that are attached to the Web service endpoint, organized into the following categories: authentication, authorization, confidentiality, and integrity. |
|
Monitoring> Ports > Operations |
List of operations for the Web service endpoint. For each operation, runtime monitoring information is displayed, such as the number of times the operation has been invoked since the WebLogic Server instance started, the average time it took to invoke the Web service, the average time it took to respond, and so on. You can customize the information that is shown in the table by clicking Customize this table. Note: For JAX-WS Web services, the built-in Ws-Protocol operation displays statistics that are relevant to the underlying WS-* protocols. For example, for Web services reliable messaging, this operation captures message statistics for Click the name of an operation to view more information. Click the General or Invocations tab to display general statistics or invocation statistics, respectively, for the selected operation. |
Monitoring Web Service Clients
To monitor a Web service client using the Administration Console, click on the Deployments node in the left pane and, in the Deployments table that appears in the right pane, locate the Enterprise application in which the Web service client is packaged. Expand the application by clicking the + node and click on the application module within which the Web service client is located. Click the Monitoring tab, then click the Web Service Clients tab.
Alternatively, click the Deployments node in the left pane, the Monitoring tab that appears in the right pane, and then the Web Service Clients tab. Click on the name of the Web service client for which you want to view monitoring statistics.
The table provides a summary of runtime information for each Web service client. Click the client name in the table to view more information.
Note:
For JAX-WS Web services, the Web services runtime creates system-defined client instances within a Web service endpoint that are used to send protocol-specific messages as required by that endpoint. These client instances are named after the Web service endpoint that they serve with the following suffix:-SystemClient. Monitoring information relevant to the system-defined client instances is provided to assist in evaluating the application.Table 7-2 Monitoring Web Service Clients
| Click this tab . . . | To view . . . |
|---|---|
|
Monitoring> General |
General statistics about the Web service clients, including total error and invocations counts. The page displays the Web service client name, its associated Enterprise application and application module, and context root. Error and invocations statistics are aggregated for all servers on which the Web service is running. |
|
Monitoring> Invocations |
Invocation statistics, such as dispatch and execution times and averages. |
|
Monitoring> WS-Policy |
Policies that are attached to the Web service client, organized into the following categories: authentication, authorization, confidentiality, and integrity. |
|
Monitoring> Servers |
Table listing the server on which the client is currently running. Click the client name and then use the tabs in the following steps to view more information about the Web service client on that server. |
|
Monitoring> Servers > General |
General statistics about the Web service client. The page displays information such as the Web service client port, its associated Enterprise application, and application module, context root, and so on. Error and invocations counts are aggregated for all Web service client operations. |
|
Monitoring> Servers > Invocations |
Invocation statistics for the Web service client, such as success, fault, and violation counts. |
|
Monitoring> Servers > Cluster Routing |
Cluster routing statistics for the Web service client, such as request and response, and routing failures. For more information, see "Monitoring Cluster Router Performance" in Programming Advanced Features of JAX-WS Web Services for Oracle WebLogic Server. |
|
Monitoring> Servers > Make Connection |
MakeConnection anonymous endpoints for a Web service client. For each anonymous endpoint, runtime monitoring information is displayed, such as the number of messages received, the number of messages pending, and so on. You can customize the information that is shown in the table by clicking Customize this table. Click the name of an anonymous endpoint to view more details. |
|
Monitoring> Servers > Reliable Message |
Reliable messaging sequences for a Web service client. For each reliable messaging sequence, runtime monitoring information is displayed, such as the sequence state, the source and destination servers, and so on. You can customize the information that is shown in the table by clicking Customize this table. Click the name of an anonymous endpoint to view more details. |
|
Monitoring> Servers > WS-Policy |
Statistics related to the policies that are attached to the Web service client, organized into the following categories: authentication, authorization, confidentiality, and integrity. |
|
Monitoring> Servers > Operations |
List of operations for the Web service client. For each operation, runtime monitoring information is displayed, such as average response, execution, and dispatch times, response, invocation and error counts, and so on. You can customize the information that is shown in the table by clicking Customize this table. Click the name of an operation to view more information. Click the General or Invocations tab to display general statistics or invocation statistics, respectively, for the selected operation. |