2 Using RESTful Management Services
This chapter describes how to use the RESTful Management Services with WebLogic Server.
This chapter includes the following sections:
Note:
In the current release of WebLogic Server, RESTful Management Services support only theGET HTTP method because they are strictly limited to WebLogic Server monitoring.Overview
WebLogic Server RESTful Management Services provides representational state transfer (REST) resources that enable you to monitor WebLogic Server outside of the Oracle Public Cloud Management Console. REST clients can embed fine-grained monitoring information in flexible, customized consoles that can monitor a domain's servers, clusters, applications, and data sources while they are running behind firewalls in the Oracle Public PaaS WebLogic Service. The monitoring resources are hosted by an internal Web application.
Only users that belong to the Administrators group or the Monitors group are allowed access to the RESTful Management Services. For more information about defining user roles in WebLogic Server, see "Users, Groups, And Security Roles" in Securing Resources Using Roles and Policies for Oracle WebLogic Server.
What Can You Monitor With RESTful Management Services?
The following components of WebLogic Server can be monitored using the RESTful Management Services:
-
Server – All server instances in a domain or a specified server instance.
-
Clusters – All clusters in a domain or a specified cluster, including all server members of the cluster.
-
Applications – All applications deployed in a domain or a specified application.
-
Data sources – All data sources running in a domain or a specified data source.
What Clients Can Access RESTful Management Services?
You can access the WebLogic Server RESTful Management Services through client applications, such as:
-
Web browsers
-
cURL
-
GNU Wget
You can also use the WebLogic Server RESTful Management Services in clients that are developed in various programming languages, such as:
-
JavaScript
-
Ruby
-
Perl
-
Java
-
JavaFX
Getting Started
In order to use RESTful Management Services in a WebLogic Server domain, your WebLogic Administrator must enable them using the WebLogic Server Administration Console. For more information, see "Enable RESTful Management Services" in the Administration Console Online Help.
Using REST URLs to Monitor WebLogic Server Domains
In the current release of WebLogic Server, RESTful Management Services support only the GET HTTP method because they are strictly limited to WebLogic Server monitoring. Each monitored WebLogic Server resource is accessible through an HTTP uniform resource locator (URL).
REST URL Format to Monitor WebLogic
The format of the WebLogic Server monitoring resource URL is:
http(s)://host:port/management/tenant-monitoring/path
where:
host – the host where WebLogic Server is running
port – the HTTP or HTTPS port
path – the relative path that identifies an individual resource. For example, the path to a server instance would be: servers/myserver
Supported Content Types in Requests to REST Resources
The WebLogic Server RESTful Management Services support the following representation formats:
-
JSON
-
XML
-
HTML
Clients should specify the resource representation through the HTTP header. For example, if clients is using the cURL utility, then it should specify the type through the -H option, as follows:
-
JSON – specify
-H "Accept application/json" -
XML – specify
-H "Accept application/xml" -
HTML – omit the
-Hoption
How WebLogic Server Monitoring Resources Are Represented
There are two types of WebLogic Server monitoring resource representations:
Item Resource Representation
An item resource represents an instance of a WebLogic Server entity; for example, a server instance.
JSON Format
Here is an example output of an item resource representation for a server instance using JSON:
{
  "body": {
    "item": {
      // attributes for the item, e.g.
      // "name": "adminserver"
      // "state": "RUNNING",
      // …
    }
  },
  "messages": [
    // an array of messages
  ]
}
The possible attribute value types are:
-
string, enclosed by double quotes ""
-
boolean, true or false
-
number
-
null
-
array, enclosed by "[" and "]"
-
object, enclosed by "{" and "}"
XML Format
Here is an example output of an item resource representation for a server instance using XML:
<?xml version="1.0" encoding="utf-8"?>
<data>
 <object>
  <property name="body">
   <object>
    <property name="item">
     <object>
      <!--
      <property name="Name">
       <value type="string">adminserver</value>
      </property>
       // other properties
       -->
     </object>
    </property>
   </object>
  </property>
  <property name="messages">
   <array>
    <!-- message objects -->
   </array>
   </property>
</object>
</data>
HTML Format
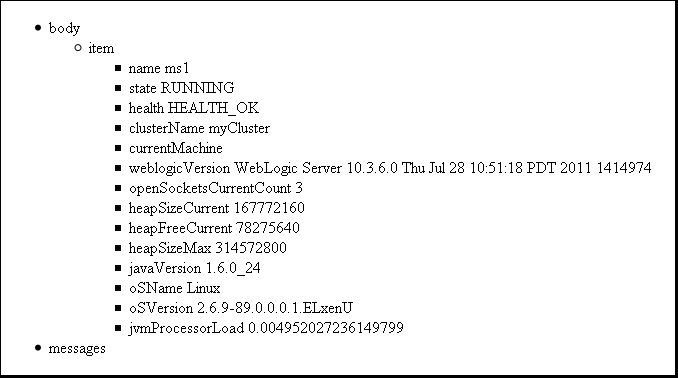
The HTML resource representation for an item resource is a Web page that displays the item attributes and their values in HTML list format. It should only be used for testing and debugging purposes.
Here is an example output of an item resource representation for a server instance using HTML:
Collection Resource Representation
A collection resource represents a set of WebLogic Server entities of the same type; for example, when representing all servers in a domain. Usually, an item resource exists for each entity inside the collection.
JSON Format
Here is an example output of a collection resource representation for all servers in a domain using JSON:
{
 "body": {
  "items": [
    {
      // attributes for item 1
      // "name": "adminserver"
      // "state": "RUNNING",
      // …
     },
    {
      // attributes for item 2
     },
     …
    {
      // attributes for item n
     }
    ],
   "messages": [
    ]
}
XML Format
Here is an example output of a collection resource representation for all servers in a domain using XML:
<?xml version="1.0" encoding="utf-8"?>
<data>
  <object>
    <property name="body">
      <object>
        <property name="items">
          <array>
            <!--
            <object>
              <property name="name">
                <value type="string">adminserver</value>
             </property>
              // other properties
            </object>

             // other items
             -->
          </array>
        </property>
      </object>
    </property>
    <property name="messages">
      <array>
        <!--
        <object>
          <property name="severity">
            <value type="string">WARNING</value>
         </property>
          <property name="message">
            <value type="string">Server ms1 is not running.</value>
         </property>
       </object>

       // other messages
       -->
      </array>
    </property>
  </object>
</data>
HTML Format
The HTML resource representation for a collection resource is a web page that displays the attributes and values for all collection items in an HTML list format. It should only be used for testing and debugging purposes.
Here is an example output of an collection resource representation for all servers in a domain using HTML:
Figure 2-2 Collective Resource in HTML Format
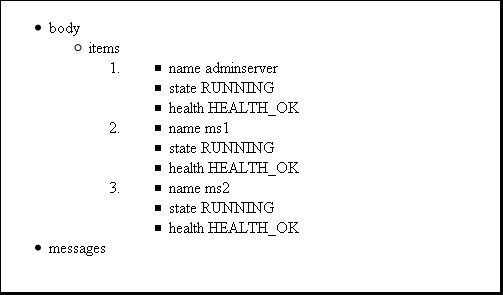
Description of "Figure 2-2 Collective Resource in HTML Format"
Compact versus Full Response Format
The collection resource uses a compact response format by default. That is, only a subset of all available monitoring information is returned for each item in the collection.
To get the full response format for each item, you need to add format=full in the request parameter. For example:
http://host:port/management/tenant-monitoring/servers?format=full
The item resource always uses a full response format that includes all monitoring information available through the REST interfaces. The body item in an Item resource contains exactly the same information as the corresponding item in a collection resource in full format.
Supported REST Resources for Monitoring WebLogic Server
This section describes the supported REST resources when monitoring WebLogic Server domains with RESTful Management Services.
-
REST Resources for Monitoring a Specified Server In a Domain,
-
REST Resources for Monitoring a Specified Cluster In a Domain,
-
REST Resources for Monitoring All Applications Deployed In a Domain,
-
REST Resources for Monitoring a Specified Application Deployed In a Domain,
-
REST Resources for Monitoring a Specified Data Source In a Domain,
REST Resources for Monitoring All Servers In a Domain
The /servers URL listed below returns all servers configured in a domain and provides run-time information for each server, including the server state and health.
http(s)://host:port/management/tenant-monitoring/servers
Table 2-1 REST Resources for Monitoring All Servers In a Domain
| Item Attributes (compact format) |
Type | Valid Values |
|---|---|---|
|
|
string |
Name of the server. |
|
|
string |
Server status. Possible states are:
|
|
|
string |
Server health state. Possible health states are:
|
Here is an example of a /servers URL response in JSON format:
{
  "body": {
    "items": [
      {
        "name": "adminserver",
        "state": "RUNNING",
        "health": " HEALTH_OK "
      },
      {
        "name": "ms1",
        "state": "SHUTDOWN",
        "health": ""
      }
     ],
   },
   "messages": [
  ]
 }
REST Resources for Monitoring a Specified Server In a Domain
The /servers/{servername} URL listed below returns information for a specified server in a domain, including the server state, health, and JVM heap availability.
http(s)://host:port/management/tenant-monitoring/servers/{servername}
Table 2-2 REST Resources for Monitoring a Specified Server In a Domain
| Item Attributes | Type | Valid Values |
|---|---|---|
|
|
string |
Name of the server instance. |
|
|
string |
Server status. Possible states are:
|
|
|
string |
Server health state. Possible health states are:
|
|
|
string |
Cluster to which the server belongs. |
|
|
string |
Machine on which the server is running. |
|
|
string |
Version of the WebLogic Server instance. |
|
|
number |
Current number of sockets registered for socket muxing on the server. |
|
|
number |
Current size (in bytes) of the JVM heap. |
|
|
number |
Current amount of memory (in bytes) that is available in the JVM heap. |
|
|
string |
Java version of the JVM. |
|
|
string |
Operating system on which the JVM is running. |
|
|
string |
Version of the operating system on which the JVM is running. |
|
|
number |
Average load that the VM is placing on all processors. For example, 1.0 represents 100%. |
Here is an example of a /servers/{servername} URL response in JSON format:
{
  "body": {
    "item": {
      "name": "adminserver",
      "clusterName": null,

      "state": "RUNNING",

      "currentMachine": "machine-0",
      "weblogicVersion": "WebLogic Server 12.1.1.0.0 Thu May 5 01:17:16 2011 PDT",
      "openSocketsCurrentCount": 2,
      "health": "HEALTH_OK",

      "heapSizeCurrent": 536870912,
      "heapFreeCurrent": 39651944,
      "heapSizeMax": 1073741824,
      "javaVersion": "1.6.0_20",
      "osName": "Linux",
      "osVersion": "2.6.18-238.0.0.0.1.el5xen",

      "jvmProcessorLoad": 0.25,
     }
    },
     messages: [
    ]
  }
REST Resources for Monitoring All Clusters In a Domain
The /clusters URL listed below returns all clusters configured in a domain and provides run-time information for each cluster and for each cluster's member servers, including all the member servers' state and health.
http(s)://host:port/management/tenant-monitoring/clusters
Table 2-3 REST Resources for Monitoring All Clusters In a Domain
| Item Attributes (compact format) |
Type | Valid Values |
|---|---|---|
|
|
string |
Name of the cluster. |
|
|
string |
Member servers of a cluster:
|
Here is an example of a /clusters URL response in JSON format:
{
  "body": {
    "items": [
      {
        "name": "mycluster1",
        "servers": [
          {
            "name": "ms1",
            "state": "RUNNING",
            "health": "HEALTH_OK"
          },
          {
            "name": "ms2",
            "state": "RUNNING",
            "health": "HEALTH_OVERLOADED"
          }
        ]
      }
    ],
  },
   "messages": [
  ]
 }
REST Resources for Monitoring a Specified Cluster In a Domain
The /clusters/{clustername} URL listed below returns run-time information for the specified cluster and its member servers, including the member servers' state and health.
http(s)://host:port/management/tenant-monitoring/clusters/{clustername}
Table 2-4 REST Resources for Monitoring a Specified Cluster In a Domain
| Item Attributes | Type | Valid Values |
|---|---|---|
|
|
string |
Name of the cluster. |
|
|
object or number |
Member servers of a cluster:
|
Here is an example of a /cluster URL response in JSON format:
{
  "body": {
    "item": {
      "name": "mycluster1",
      "servers": [
        {
          "name": "ms1",
          "state": "RUNNING",
          "health": "OK",

          "clusterMaster": false,

          "dropOutFrequency": "Never"
          "resendRequestsCount": 0,
          "fragmentsSentCount": 3708,
         "fragmentsReceivedCount": 3631
        },
        {
          "name": "ms2",
          "state": "RUNNING",
          "health": "OK"
          ...
        }
       ]
      }
    },
     "messages": [
    ]
  }
REST Resources for Monitoring All Applications Deployed In a Domain
The /applications URL listed below returns all applications deployed in the domain and their run-time information, including the application type and their state and health.
http(s)://host:port/management/tenant-monitoring/applications
Table 2-5 REST Resources for Monitoring All Applications Deployed In a Domain
| Item Attributes (compact format) |
Type | Valid Values |
|---|---|---|
|
|
string |
Name of the application. |
|
|
string |
Application type. Possible types are:
|
|
|
string |
Consolidated application running status. Possible states are:
|
|
|
string |
Consolidated health state of the application. Possible health states are:
|
Here is an example of an /applications URL response in JSON format:
{
  "body": {
    "items": [
      {
        "name": "appscopedejbs",
        "type": "ear",
         "state": "STATE_ACTIVE",
         "health": " HEALTH_OK"
       },
      {
        "name": "MyWebApp",
        "type": "war",
         "state": "STATE_NEW"
      }
     }
    ],
   },
    "messages": [
   ]
 }
REST Resources for Monitoring a Specified Application Deployed In a Domain
The /applications/{applicationname} URL returns the run-time information of a specified application, including statistics for entity beans, application-scoped work managers, and data sources.
http(s)://host:port/management/tenant-monitoring/applications/{applicationname}
Table 2-6 REST Resources for Monitoring a Specified Application Deployed In a Domain
| Item Attributes | Type | Valid Values |
|---|---|---|
|
|
string |
Name of the application. |
|
|
string |
Application type. Possible types are:
|
|
|
string |
Consolidated application running status. Possible states are:
|
|
|
string |
Consolidated health state of the application. Possible health states are:
|
|
|
object |
Application running status for each target:
|
|
|
object |
Run-time information for the embedded data sources:
|
|
|
object or number |
Statistics for the Work Managers that are configured for an application:
|
|
|
object or number |
Statistics for the minimum thread constraints that are configured for an application:
|
|
|
object or number |
Statistics for maximum thread constraints that are configured for an application:
|
|
|
object or number |
Statistics for the request classes that are configured for an application:
|
Here is an example of an /applications/{applicationname} URL response in JSON format:
{
  "body": {
    "item": {
      "name": "appscopedejbs",
      "type": "ear",
      "health": " HEALTH_OK ",
      "state": "STATE_ACTIVE",
      "targetStates": [
        {
          "target": "ms1",
          "state": "STATE_ACTIVE",
        },
        {
          "name": "ms2",
          "state": "STATE_ACTIVE",
        }
      ] ,
      "dataSources": [
      ],
     "entities": [
      ],
      "workManagers": [
        {
          "name": "default",
          "server": "ms1",
          "pendingRequests": 0,
          "completedRequests": 0
        }
      ],
      "minThreadsConstraints": [
        {
          "name": "minThreadsConstraints-0",
          "server": "ms1",
          "completedRequests"; 0,
          "pendingRequests"; 0,
          "executingRequests": 0,
          "outOfOrderExecutionCount":0,
          "mustRunCount": 0,
          "maxWaitTime": 0,
          "currentWaitTime": 0
        }
      ],
      "maxThreadsConstraints": [
        {
          "name": "maxThreadsConstraints-0",
          "server": "ms1",
          "executingRequests": 0,
          "deferredRequests": 0
        }
      ],
      "requestClasses": [
        {
          "name": "requestClasses-0",
          "server": "ms1",
          "requestClassType"; "fairshare",
          "completedCount"; 0,
          "totalThreadUse": 0,
          "pendingRequestCount":0,
          "virtualTimeIncrement": 0
         }
        ]
       }
      },
      "messages": [
      ]
     }
REST Resources for Monitoring All Data Sources In a Domain
The /datasources URL listed below returns all generic and GridLink JDBC data sources configured in the domain, and provides run-time information for each data source.
http(s)://host:port/management/tenant-monitoring/datasources
Table 2-7 REST Resources for Monitoring All Data Sources In a Domain
| Item Attributes (compact format) |
Type | Valid Values |
|---|---|---|
|
|
string |
Name of the data source. |
|
|
string |
Data source type; either |
|
|
string |
Run-time information for the data source instances:
|
Here is an example of a /datasources URL response in JSON format:
{
  "body": {
    "items": [
      {
        "name": "genericDS",
        "type": "Generic"
        "instances": [
          {
            "server": "ms1",
            "state": "Running"
          },
          {
            "server": "ms2",
            "state": "Suspended"
          }
        ]
      },
      {
        "name": "gridlinkDS",
        "type": "GridLink",
        "instances": [
          {
            "server": "ms1",
            "state": "Running"
          },
         ]
       }
     ],
  },
  "messages": [
   ]
  }
REST Resources for Monitoring a Specified Data Source In a Domain
The /datasources/{datasourcename} URL listed below returns run-time information for the specified data source, including Oracle RAC statistics for GridLink data sources.
http(s)://host:port/management/tenant-monitoring/datasources/{datasourcename}
Table 2-8 REST Resources for Monitoring a Specified Data Source In a Domain
| Item Attributes (compact format) |
Type | Valid Values |
|---|---|---|
|
|
string |
Name of the data source. |
|
|
string |
Data source type; either |
|
|
object or number |
Run-time information for the data source instances:
|
|
|
object or number |
|
|
|
object or number |
|
|
|
object or number |
|
Here is an example of a /datasources/{datasourcename} URL response in JSON format:
{
  "body": {
   "item": {
     "name": "gridlinkDS",
     "instances": [
     {
       "server": "ms1",
       "state": 'Running",
       "enabled": true,
       "activeConnectionsAverageCount": 5,
       …
       "racInstances": [
         {
           "instanceName": "gridlinkDS-0",
           "state": "Running",
           …
          },
          {
           "instanceName": "gridlinkDS-1",
           "state": "Suspended",
           …
         }
        ]
       }

     }
    },
    "messages": [
   ]
 }