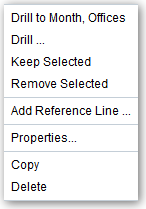
While adding filters to visualizations helps you narrow your focus on certain aspects of your data, you can take a variety of other analytic actions to explore your data—such as drilling, sorting, and selecting. When you take the analytic actions described in this topic, the filters are automatically applied for you.
- Use Sort to sort attributes in a visualization, such as product names from A to Z.
- Use Drill to drill to a data element, and you can drill through hierarchies in data elements, such as drilling to weeks within a quarter. You can also drill asymmetrically using multiple data elements. For example, you can select two separate year members that are columns in a pivot table, and drill into those members to see the details.
- Use Drill to [Attribute Name] to directly drill to a specific attribute within a visualization.
- Use Keep Selected to keep only the selected members and remove all others from the visualization and its linked visualizations. For example, you can keep only the sales that are generated by a specific sales associate.
- Use Remove Selected to remove selected members from the visualization and its linked visualizations. For example, you can remove the Eastern and Western regions from the selection.
- Use Add Reference Line or Band to add a reference line to highlight an important fact depicted in the visualization, such as a minimum or maximum value. For example, you might add a reference line across the visualization at the height of the maximum Revenue amount. You also might add a reference band to more clearly depict where the minimum and maximum Revenue amounts fall on the Revenue axis.
Note:
To add a reference band to a visualization, right-click it and select
Add Reference Line to display the Properties dialog. On the Analytics tab, in the
Method field, toggle
Line to
Band.
