6 Creating Excel Templates
This chapter describes creating report templates for BI Publisher in Microsoft Excel using the Template Builder for Excel.
This chapter includes the following sections:
-
Section 6.2, "Understanding Mappings Between the Template and the Data"
-
Section 6.4, "Building a Basic Template Using the Template Builder"
-
Section 6.8, "Preprocessing the Data Using an XSL Transformation (XSLT) File"
-
Section 6.9, "Using the Template Viewer to Debug a Template"
6.1 Introduction to Excel Templates
An Excel template is a report layout designed in Microsoft Excel for formatting your enterprise reporting data in Excel spreadsheets. Excel templates provide a set of special features for mapping data to worksheets and for performing additional processing to control how the data is output to Excel workbooks.
This introduction includes the following topics:
6.1.1 Features of Excel Templates
With Excel templates you can:
-
Define the format for the data in Excel output
-
Split hierarchical data across multiple sheets and dynamically name the sheets
-
Create sheets of data that have master-detail relationships
-
Use native XSL functions in the data to manipulate it prior to rendering
-
Use native Excel functionality
6.1.2 Limitations of Excel Templates
The following are limitations of Excel templates:
-
For reports that split the data into multiple sheets, images are not supported. If the template sheet includes images, when the data is split into multiple sheets, the images are displayed only on the first sheet.
-
BI Publisher provides an add-in to Microsoft Excel to facilitate the insertion of fields and repeating groups. More complex designs require manual coding. Some features require the use of XSL and XSL Transformation (XSLT) specifications.
6.1.3 Prerequisites
Following are prerequisites for designing Excel templates:
-
You must have Microsoft Excel 2003 or later installed. The template file must be saved as Excel 97-2003 Workbook binary format (*.xls).
Important:
If you are using a version later than Excel 2003 to create your template and then save as Excel 97-2003, ensure that you do not use any features of the later version that are not supported in Excel 97-2003. For example, Excel 2003 allows only three conditional formatting rules per cell, but Excel 2007 allows more. If you apply more than three conditional formatting rules to a cell, only three are applied. Excel 2007 also provides color support not provided in Excel 2003.
-
To use some of the advanced features, you must have knowledge of XSL.
-
The data model must be created in BI Publisher with sample data available.
6.1.4 Supported Output
Excel templates generate Excel binary (.xls) output only.
6.1.5 Desktop Tools for Excel Templates
BI Publisher provides a downloadable add-in to Excel that provides the following features:
-
Connects directly to the BI Publisher server to load sample data and upload and download templates
-
Inserts data field mappings to the template
-
Inserts repeating group mappings to the template
-
Provides a field browser to review all inserted code and to edit or delete mappings
-
Previews the template using the sample data or live data when in connected mode
6.1.5.1 Installing the Template Builder for Excel
The Template Builder for Excel is installed automatically when you install the BI Publisher Desktop Tools. The tools can be downloaded from the Home page of Oracle Business Intelligence Publisher or Oracle Business Intelligence Enterprise Edition, as follows:
Under the Get Started region, click Download BI Publisher Tools, then select the BI Publisher Desktop option (32bit Office or 64bit Office) appropriate for your version of Microsoft Office.
Note:
The Excel Template Builder is not compatible with the (deprecated) Analyzer for Excel. If you have the Analyzer for Excel installed from a previous version, the BI Publisher Tools installer detects its presence and halts the installation. You must remove the Analyzer for Excel before installing the BI Publisher Desktop. The Excel Template Builder includes a feature to import Analyzer for Excel templates to the Excel template format. See Section 6.3.7, "Importing Excel Analyzer Templates."
6.1.6 Sample Excel Templates
The Template Builder installation includes sample Excel templates.
To access the samples from a Windows desktop:
-
Click Start, Programs, Oracle BI Publisher Desktop, Samples, then Excel.
This action launches the folder that contains the Excel sample templates.
6.2 Understanding Mappings Between the Template and the Data
When you design Excel templates use the Excel Template Builder for inserting fields and repeating groups to your template. When the Template Builder inserts a field or repeating group it creates a mapping between the data and the spreadsheet and writes the mapping to a hidden sheet called the XDO_METADATA sheet. The Template Builder creates the hidden XDO_METADATA sheet the first time you insert a field or repeating group.
To view or update the XDO_METADATA sheet unhide the sheet. To add calculations or more advanced functions, enter the XSL functions directly in the XDO_METADATA sheet using the named mappings created by the Template Builder. For more information about template-data mappings, see Section 6.6, "Understanding Excel Template Concepts."
6.3 Using the Template Builder for Excel
The Excel Template Builder facilitates template design by automating the insertion of simple mappings, providing preview functionality, and enabling direct connection to the BI Publisher server from your Excel session. The BI Publisher tab that displays when you install the Template Builder is shown in Figure 6-1.
You can use the Template Builder in connected mode or disconnected mode. In connected mode, log in to the BI Publisher server from Excel. The connection enables you to browse the BI Publisher catalog and load sample data from an existing report or data model. When your template is complete, you can upload it directly to the report definition in the BI Publisher catalog. In disconnected mode, you must download a sample data file from the data model to your local client.
This section includes the following topics about using the Template Builder for Excel:
6.3.1 Working in Connected Mode
In connected mode you can interact directly with the BI Publisher server. The process flow for creating or editing a template in connected mode is:
-
Open Excel with the BI Publisher Template Builder for Excel Add-in installed.
-
Log on to the BI Publisher server.
-
Select the report or data model for which you want to create a new layout; or, select an existing layout to modify.
-
Design your template in Excel.
-
Preview your template using the View Report or Preview command.
-
Use one of the upload template commands to upload your completed template to the BI Publisher catalog.
The following sections provide more detail on the Template Builder features when working in connected mode:
6.3.1.1 Logging In Through the Template Builder
The Excel Template Builder enables a direct connection to the BI Publisher server from your desktop Excel session. By logging in directly to BI Publisher you can browse the catalog to choose the report to which to add the Excel template; or, if no report has been created, you can select the data model and create the report in the catalog from your Excel session.
To log on to the BI Publisher server:
-
In Excel, on the BI Publisher tab in the Online group, click Log On.
-
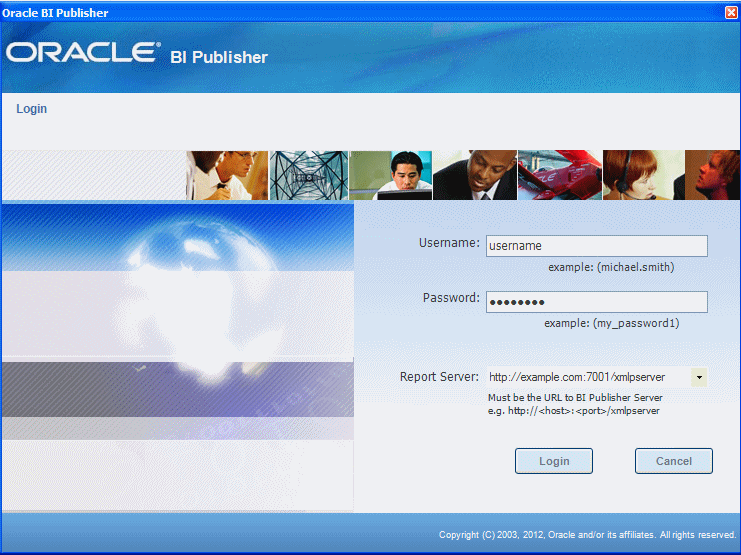
In the Login dialog, enter your BI Publisher username and password and the URL to the BI Publisher server. The URL to the BI Publisher server takes the form
http:// www.<host>:<port>/xmlpserver. The Login dialog is shown in Figure 6-2.Note:
Log in is supported only for connections directly to the BI Publisher server. For example: http://www.example.com:7001/xmlpserver. The Template Builder does not support logging in through the Oracle BI Enterprise Edition analytics server.
6.3.1.2 Online Features of the Template Builder
After logging in, the following commands in the Online group become enabled (shown in Figure 6-3).
-
Log Off - ends the connection to the BI Publisher server.
-
Open - enables interaction with the BI Publisher catalog. See Section 6.3.1.2.1, "Accessing the BI Publisher Catalog from the Template Builder."
-
View Report - executes the data model on the server and returns live results to view in your template. If the data model includes parameters, you are prompted to enter values.
-
Upload Template/Upload Template As - uploads the template to the BI Publisher catalog. See Section 6.3.1.3, "Uploading Templates from the Template Builder."
6.3.1.2.1 Accessing the BI Publisher Catalog from the Template Builder
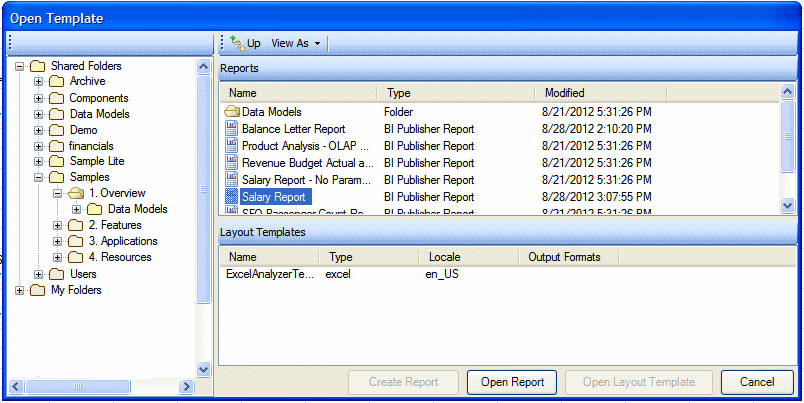
The Open command launches the Open Template dialog shown in Figure 6-4 to enable access to the BI Publisher catalog.
Navigate the catalog folders to locate the report, data model, or existing layout template. From this dialog you can initiate one of the following actions:
-
Modify an existing Excel template.
When you select a report in the Reports region, any existing Excel templates or Excel Analyzer templates (deprecated) are displayed in the lower Layout Templates region. To modify an existing template, select the template name and click Open Layout Template. The Template Builder loads the sample data from the report's data model and opens the existing template in Excel.
-
Create a new template for an existing report.
Select the report name in the Reports region and click Open Report. The Template Builder loads the sample data for this report's data model.
-
Select a data model to create a new report.
When you select a data model from the catalog, the Create Report button is enabled. Click Create Report and you are prompted to enter a report name and select the location in the catalog to save the new report.
6.3.1.3 Uploading Templates from the Template Builder
If you have maintained the connection during the design process, click one of the following to upload your completed template to the BI Publisher server:
-
Upload Template uploads your edited template and replaces the existing template in the catalog. Upload Template is enabled only when you have opened an existing template from the Open Template dialog using the Open Layout Template button.
-
Upload Template As prompts you to assign a Template Name and Locale to the template then uploads the file to the report in the BI Publisher catalog.
6.3.2 Working in Disconnected Mode
When direct connection to the BI Publisher server is not possible or not desirable, you can use the Template Builder to design and preview templates in disconnected mode. In disconnected mode the commands in the Online group are not enabled. The process flow for working in disconnected mode is:
-
Log in to the BI Publisher server and download sample data from the data model for which you want to design a template.
-
Open Excel with the BI Publisher Template Builder for Excel Add-in installed.
-
Load the sample data to the Template Builder.
-
Design your template in Excel.
-
Preview your template using the Preview command.
-
Log in to the BI Publisher server and use the report editor to upload your template.
The following sections provide more detail on the Template Builder features when working in disconnected mode:
6.3.2.1 Obtaining Sample Data
The Template Builder requires sample data to insert the data field mappings to your template. For information on saving sample data from the report data model, see "Testing Data Models and Generating Sample Data" in Oracle Fusion Middleware Data Modeling Guide for Oracle Business Intelligence Publisher.
If you do not have access to the report data model, but you can access the report, then you can alternatively save sample data from the report viewer.
To save data from the report viewer:
-
In the BI Publisher catalog, navigate to the report.
-
Click Open to run the report in the report viewer.
-
Click the Actions menu, then click Export, then click Data. You are prompted to save the XML file.
-
Save the file to a local directory.
6.3.2.2 Loading Sample Data in Disconnected Mode
Once you have saved the sample data from the report data model to a local directory, load it to the Template Builder.
-
Open Excel with the BI Publisher Template Builder for Excel Add-in installed.
-
On the BI Publisher tab, in the Load Data group, click Sample XML. You are prompted to locate and select the data from its saved location. A confirmation message confirms the data is loaded.
6.3.2.3 Uploading Templates to the Report
When working in disconnected mode, upload the template to the report editor following the instructions in Section 2.6.2, "Adding a Layout by Uploading a Template File."
6.3.3 Inserting Fields
The Field command in the Insert group maps data elements from the loaded sample data to the desired location in the spreadsheet.
To insert a field:
-
In Excel, select the cell to which to map the data element.
-
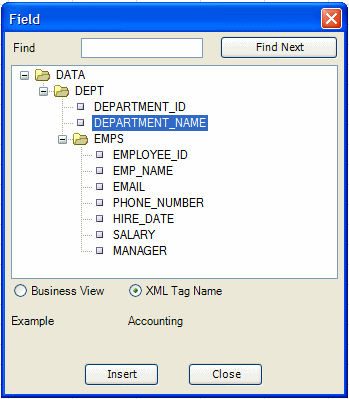
On the BI Publisher tab, in the Insert group, click Field. The Field dialog launches, displaying the data elements from your sample data.
-
On the Field dialog select the element to insert to the cell. Notice that as you select items in the data structure, sample data is displayed in the Example region as shown in Figure 6-5.
-
Click Insert to insert the data element to the cell in the spreadsheet. Sample data is inserted to the cell.
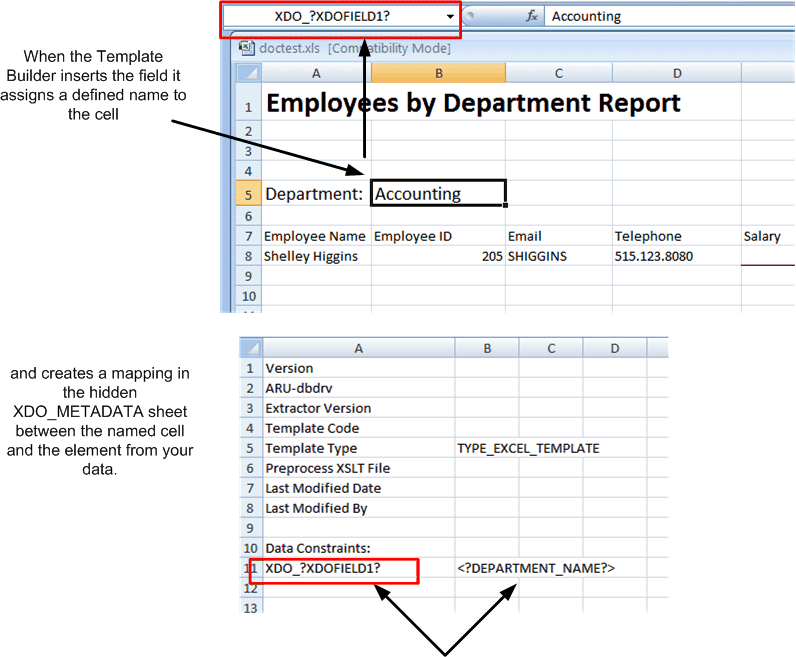
When you insert a field, the Template Builder creates a mapping between the data and the cell by assigning a unique Excel defined name to the cell and mapping the data element to that defined name. The mapping is written to the XDO_METADATA sheet as shown in Figure 6-6.
Note that the XDO_METADATA sheet is hidden by default.
6.3.3.1 More Features of the Field Dialog
The Field dialog provides the following features:
For an XML document with a large and complicated structure, use the find functionality to find a specific field. Enter all or part of the field name into the Find field and click Find Next.
Business View or XML Tag Name View
When working in connected mode, you can choose whether to view the data structure using the Business View names or the XML Tag Names as defined in the data model. Business View names are user-friendly names defined for the data elements in the data model editor. This option is not available when sample data has been loaded from a locally stored file or when the data model does not include Business View names.
6.3.4 Inserting Repeating Groups
To insert a repeating group:
-
Select the cells in the spreadsheet that contain the elements you want repeated.
-
On the BI Publisher menu, in the Insert group, click Repeating Group.
-
Enter the appropriate fields in the BI Publisher Properties dialog, as shown in Figure 6-7.
For Each
Select the element that for each occurrence, you want the loop to repeat. When you select the For Each data field you are telling BI Publisher that for each occurrence of the selected field in the data you want the elements and processing instructions contained within the loop to be repeated.
For example, assume that the data contains invoice data for customers and you want to create a table with each customer's invoices. In this case, for each customer number you want the table to repeat. You would therefore select the customer number in the For Each field to create a new loop (or group) for each customer.
Note the following about creating repeating groups:
-
For loops and groupings not inside another group (that is, outer groups) you must select the repeating data element to be used. For example if the data set is flat, the only repeatable element is /DATA/ROWSET/ROW. In cases with multiple data sources or hierarchical XML you can choose the data set.
-
If you are creating nested groups (inserting a loop or group inside of another loop in the template), the On Grouping checkbox is selected and the For Each field is not editable because it is already defined by the preexisting outer loop. The For Each field is displayed as "Group Item" to inform you that an outer group is already defined.
Absolute Path
Select this check box to use the Absolute Path to the element in the XML structure. This is important if the data contains the same element name grouped under different parent elements.
Group By
Select a field from the list by which you want to group the data. To create a simple loop, do not select a group by element. Selecting a group by element regroups the data into a new hierarchy based on the group by element.
On Grouping
When creating a nested for-each loop, select On Grouping to repeat the for-each loop only when the element appears within the parent loop. Deselect On Grouping to repeat global data (outside the parent loop) within the nested loop.
-
-
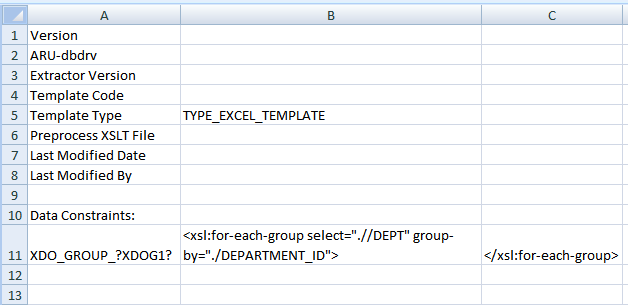
When you have completed the dialog options, click OK to insert the BI Publisher code to define the groupings. An Excel defined name is assigned to the cell range using the BI Publisher syntax XDO_GROUP_?name? and the code is written to the XDO_METADATA sheet as shown in Figure 6-8
6.3.5 Using the Field Browser to View, Edit, and Delete Fields
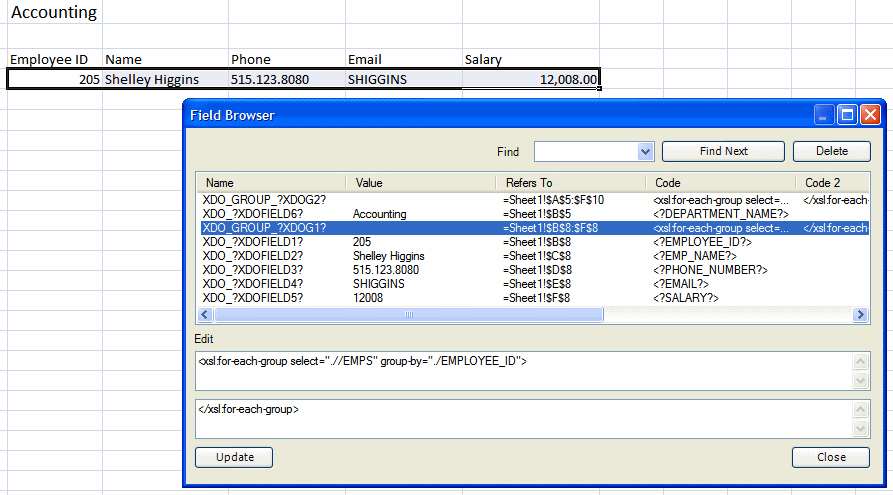
The Field Browser enables you to view and edit the code inserted by the Template Builder and the code you inserted manually into the XDO_METADATA sheet. When you select a line of code in the Field Browser, the corresponding cells in the template are highlighted, so you know which field you are editing, deleting, or viewing.
To edit or delete a field using the Field Browser:
-
On the BI Publisher menu, in the Tools group, click Field Browser.
-
The Field Browser displays the BI Publisher commands that are present in the template. Select the field or command to view. The code for the selected command displays in the lower Edit region. Notice that if the code has opening and ending tags (such as the opening and ending tags of a repeating group) the opening tag display in the upper code box and the closing tag displays in the lower code box.
When you select a command, the area of the template that corresponds to the code is highlighted. In Figure 6-9 the repeating group is selected in the Field Browser and the corresponding fields are highlighted in the template.
-
To delete the code, click Delete. To edit the code, update the code displayed in the Edit and click Update.
-
When finished, click Close to close the Field Browser.
6.3.6 Previewing Templates
Use the preview feature of the Template Builder to test your template before uploading it to the BI Publisher server.
To preview a template with the loaded sample data:
-
On the BI Publisher tab in the Preview group, click Excel.
The sample data is applied to the template and the output document is opened in a new workbook.
If you are working in connected mode, you have the option of testing your template with live data from the report data model using View Report.
To view your template using live data:
-
On the BI Publisher tab in the Online group, click View Report.
The Template Builder sends a request to execute the data model on the BI Publisher server and returns the data to apply to the template. If the data model requires parameters, you are prompted to enter values. The output document is opened in a new Excel workbook.
6.3.7 Importing Excel Analyzer Templates
The Excel Analyzer feature of BI Publisher has been deprecated, but if you have Excel Analyzer templates from previous BI Publisher releases, you can use the Import command of the Excel Template Builder to import an Excel Analyzer template and convert it to an Excel template. The Import command supports only Excel Analyzer templates created using the Offline Mode.
To import an Excel Analyzer template:
-
Open the Excel Analyzer template. If you are working in connected mode, navigate to the report that contains the template you wish to convert. When you select the report in the Open Template dialog, the Excel Analyzer template displays in the Layout Templates region as type "excel". Click Open Layout Template to open the Excel Analyzer template in Excel.
-
Click Import. A message notifies you: "This feature will overwrite your template."
-
Click OK.
The Template Builder converts the Excel Analyzer template to an Excel template.
6.4 Building a Basic Template Using the Template Builder
This section demonstrates the concepts of Excel templates by describing the steps to create a simple Excel template using the Excel Template Builder. This procedure follows these steps:
Step 1: Load Sample Data to the Template Builder
Step 2: Design the Layout in Excel
Step 3: Use the Template Builder to Insert Fields
Step 4: Use the Template Builder to Insert Repeating Groups
Step 5: Insert the Calculated Salary Field
Step 6: Test the Template
6.4.1 Step 1: Load Sample Data to the Template Builder
The method you choose for loading sample data depends on whether you are working in connected or disconnected mode.
-
To load data when working in connected mode, see Section 6.3.1.2.1, "Accessing the BI Publisher Catalog from the Template Builder."
-
To load data when working in disconnected mode, see Section 6.3.2.2, "Loading Sample Data in Disconnected Mode."
The sample data for this example is a list of employees by department. Note that employees are grouped and listed under the department.
<?xml version="1.0" encoding="UTF-8"?>
<! - Generated by Oracle BI Publisher 11.1.1.4.0 - >
<DATA>
 <DEPT>
   <DEPARTMENT_ID>20</DEPARTMENT_ID>
   <DEPARTMENT_NAME>Marketing</DEPARTMENT_NAME>
     <EMPS>
       <EMPLOYEE_ID>201</EMPLOYEE_ID>
       <EMP_NAME>Michael Hartstein</EMP_NAME>
       <EMAIL>MHARTSTE</EMAIL>
       <PHONE_NUMBER>515.123.5555</PHONE_NUMBER>
       <HIRE_DATE>1996-02-17T00:00:00.000+00:00</HIRE_DATE>
       <SALARY>13000</SALARY>
     </EMPS>
     <EMPS>
       <EMPLOYEE_ID>202</EMPLOYEE_ID>
       <EMP_NAME>Pat Fay</EMP_NAME>
       <EMAIL>PFAY</EMAIL>
       <PHONE_NUMBER>603.123.6666</PHONE_NUMBER>
       <HIRE_DATE>1997-08-17T00:00:00.000+00:00</HIRE_DATE>
       <SALARY>6000</SALARY>
     </EMPS>
  </DEPT>
<DEPT>
...
...
</DEPT>
</DATA>
To build the template described in this tutorial, use the sample data available in the Samples folder installed with BI Publisher Desktop. A very similar data set can be found in <Install Directory>\BI Publisher Desktop\Template Builder for Word\samples\Excel templates\Employee By Departments\EmpByDept Single Sheets\EmpbyDeptExcelData.xml
6.4.2 Step 2: Design the Layout in Excel
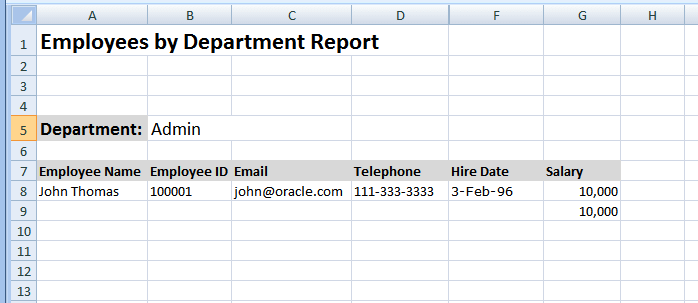
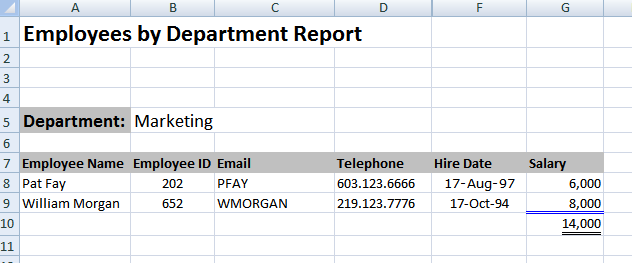
In Excel, determine how you want to render the data and create a sample design, as shown in Figure 6-10.
The design shows a department name and a row for each employee within the department. You can apply Excel formatting to the design, such as font style, shading, and alignment. Note that this layout includes a total field. The value for this field is not available in the data and requires a calculation.
6.4.3 Step 3: Use the Template Builder to Insert Fields
In this layout design, the following fields must be mapped to the template from the data:
| Field in Layout | Element in Data |
|---|---|
|
Department |
DEPARTMENT_NAME |
|
Employee Name |
EMP_NAME |
|
Employee ID |
EMPLOYEE_ID |
|
|
|
|
Telephone |
PHONE_NUMBER |
|
Salary |
SALARY |
To insert field mappings using the Template Builder:
-
Select the cell in the spreadsheet where the data field is to display. For example, to map the DEPARTMENT_NAME element, select cell B5.
-
On the BI Publisher tab, in the Insert group click Field. (Because this is the first field you are inserting, a message displays stating that the metadata sheet will be created.) The Field dialog displays showing the data structure, shown in Figure 6-11.
-
Select the element in the Field dialog and click Insert. Sample data is inserted to the cell in the template. For more information about the Field dialog, see Section 6.3.3, "Inserting Fields."
-
Repeat for the Employee Name, Employee ID, Email, Telephone, and Salary fields in the template.
6.4.4 Step 4: Use the Template Builder to Insert Repeating Groups
A group is a set of data that repeats for each occurrence of a particular element. In the sample template design, there are two groups:
-
For each occurrence of the <EMPS> element, the employee's data (name, e-mail, telephone, salary) is displayed in the worksheet.
-
For each occurrence of the <DEPT> element, the department name and the list of employees belonging to that department are displayed.
In other words, the employees are "grouped" by department and each employee's data is "grouped" by the employee element. To achieve this in the final report, insert a repeating group around the cells that are to repeat for each grouping element.
Note that the data must be structured according to the groups that you want to create in the template. The structure of the data for this example
<DATA>
   <DEPT>
      <EMPS>
establishes the grouping desired for the report.
To insert the repeating group for Employees:
-
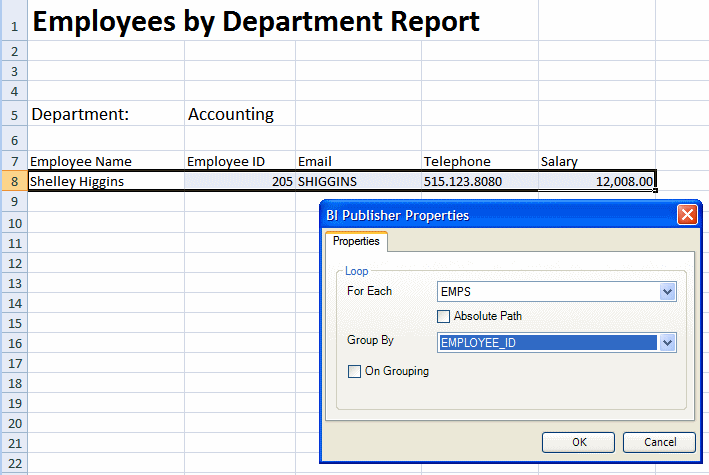
Select the cells that make up the group. In this example, the first group is the Employee data that makes up a row in the table, the cells are A8 - E8.
-
On the BI Publisher tab, in the Insert group, click Repeating Group.
-
In the BI Publisher Properties dialog, select the following:
-
From the For Each list, select EMPS.
-
From the Group By list, select EMPLOYEE_ID.
Figure 6-12 shows BI Publisher Properties definitions for the Employees group. Notice that just the row of employee data is highlighted. Do not highlight the headers. Notice also that the total cell is not highlighted.
-
To insert the repeating group for Departments:
-
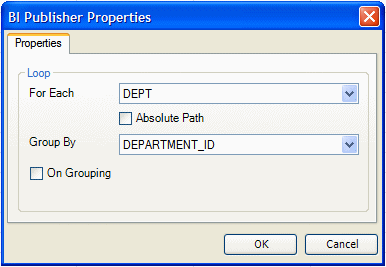
To define the department group, select the Department name cell and all the employee fields beneath it (A5-E9) as shown in Figure 6-13.
Figure 6-13 The Department Name Cell and All Employee Fields
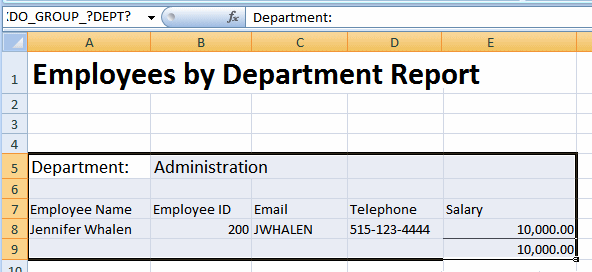
Description of "Figure 6-13 The Department Name Cell and All Employee Fields"
-
On the BI Publisher tab, in the Insert group, click Repeating Group. Notice that the total salary cell is included in the department group to ensure that it repeats at the department level.
-
In the BI Publisher Properties dialog, select the following:
-
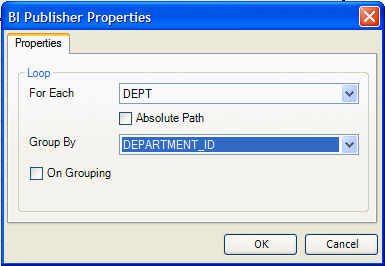
From the For Each list, select DEPT.
-
From the Group By list, select DEPARTMENT_ID.
-
Figure 6-14 shows the selections for the BI Publisher Properties dialog.
6.4.5 Step 5: Insert the Calculated Salary Field
Finally, insert the second Salary field that is to be an aggregated sum for each department.
To insert the calculated field:
-
Select the cell in the spreadsheet where the calculated salary is to display. In this example, the cell is E9.
-
On the BI Publisher tab, in the Insert group, click Field to display the Field dialog.
-
Select the SALARY element and click Insert to insert the mapping in the template.
-
Open the XDO_METADATA sheet.
The Template Builder created a hidden XDO_METADATA sheet when you inserted the first field. Unhide the sheet in your workbook by right-clicking Sheet1 and selecting Unhide from the menu.
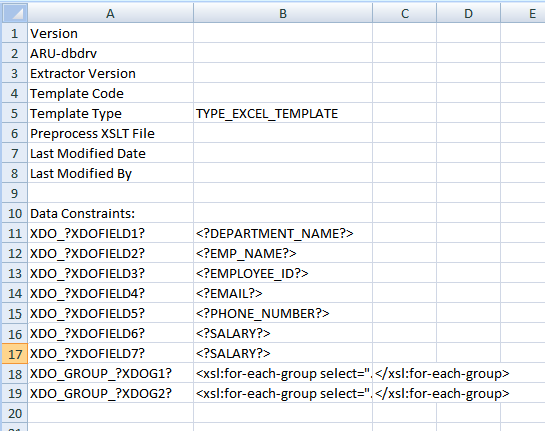
Figure 6-15 shows the XDO_METADATA sheet for the sample template.
The total salary field maps to the cell named XDO_?XDOFIELD7?.
-
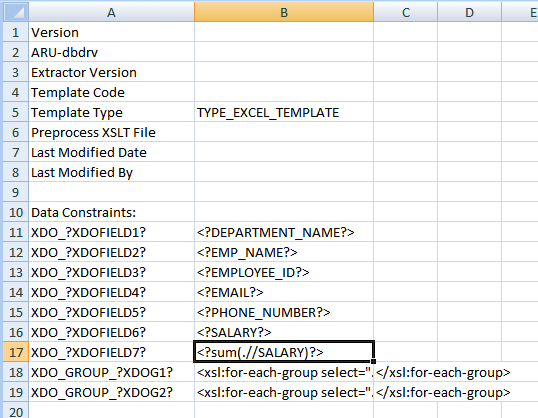
In Column B enter the calculation as an XPATH function. To calculate the sum of the SALARY element for all employees in the group, enter the following:
<?sum(.//SALARY)?>. The entry is shown in Figure 6-16.
6.4.6 Step 6: Test the Template
To preview a template with the loaded sample data:
-
On the BI Publisher tab in the Preview group, click Excel.
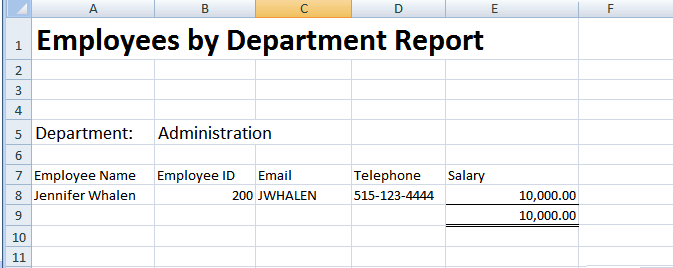
The sample data is applied to the template and the output document is opened in a new workbook.
Figure 6-17 A Preview of a Template with Sample Data
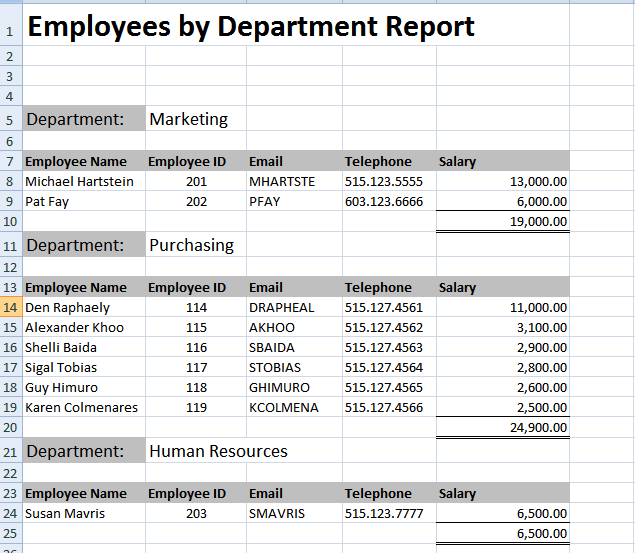
Description of "Figure 6-17 A Preview of a Template with Sample Data"
6.5 Formatting Dates
Excel cannot recognize canonical date format. If the date format in the XML data is in canonical format, that is, YYYY-MM-DDThh:mm:ss+HH:MM, you must apply a function to display it properly.
One option to display a date is to use the Excel REPLACE and SUBSTITUTE functions. This option retains the full date and timestamp. If you only require the date portion in the data (YYY-MM-DD), then another option is to use the DATEVALUE function. The following example shows how to use both options.
Example: Formatting a Canonical Date in Excel
Using the Employee by Department template and data from the first example, this procedure adds the HIRE_DATE element to the layout and displays the date as shown in Column E of Figure 6-18.
Figure 6-18 The Employee by Department Template Showing the Hire Date
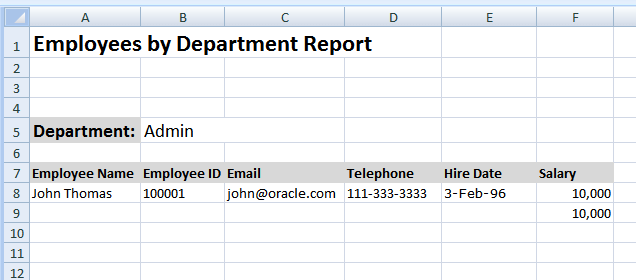
Description of "Figure 6-18 The Employee by Department Template Showing the Hire Date"
To format the date:
-
Add a column to the table in your layout for HIRE_DATE.
-
In the table row where the data is to display, use the Template Builder to insert the HIRE_DATE field.
Note:
If you are not using the Template Builder, copy and paste a sample value for HIRE_DATE from the XML data into the cell that is to display the HIRE_DATE field. For example:
Copy and paste
1996-02-03T00:00:00.000-07:00
into the E8 cell.
Assign the cell the defined name XDO_?HIRE_DATE? to map it to the HIRE_DATE element in the data.
The inserted field is shown in Figure 6-19.
Figure 6-19 Inserting the HIRE_DATE Field
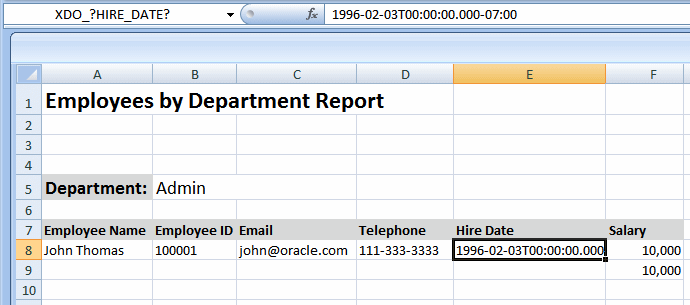
Description of "Figure 6-19 Inserting the HIRE_DATE Field"
If you do nothing else, the HIRE_DATE value is displayed as shown. To format the date as "3-Feb-96", you must apply a function to that field and display the results in a new field.
-
Insert a new Hire Date column. This is now column F, as shown in Figure 6-20.
Figure 6-20 The New Hire Date Column in Column F

Description of "Figure 6-20 The New Hire Date Column in Column F"
-
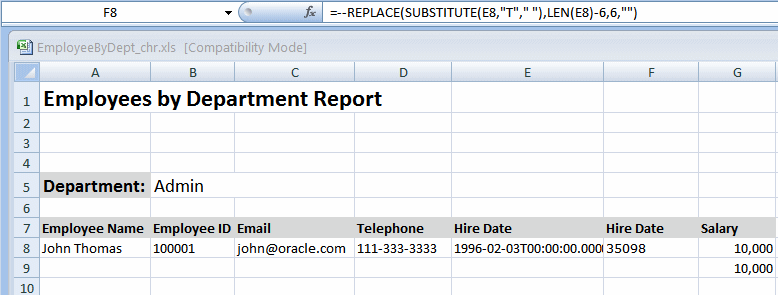
In the new Hire Date cell (F8), enter one of the following Excel functions:
-
To retain the full date and timestamp, enter:
=--REPLACE(SUBSTITUTE(E8,"T"," "),LEN(E8)-6,6,"")
-
To retain only the date portion (YYY-MM-DD), enter:
=DATEVALUE(LEFT(E8,10))
Notice that in both functions, "E8" refers to the cell that contains the value to convert.
After you enter the function, it populates the F8 cell as shown in Figure 6-21.
Figure 6-21 Hire Date Cell (F8) Populated
Description of "Figure 6-21 Hire Date Cell (F8) Populated"
-
-
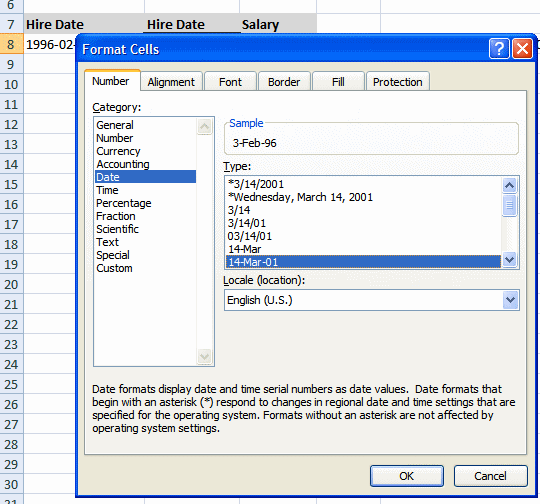
Apply formatting to the cell.
Right-click the F8 cell. From the menu, select Format Cells. In the Format Cells dialog, select Date and the desired format, as shown in Figure 6-22.
Figure 6-22 Applying the Format for the Date in the Format Cells Dialog
Description of "Figure 6-22 Applying the Format for the Date in the Format Cells Dialog"
The sample data in the F8 cell now displays as 3-Feb-96.
-
Hide the E column, so that report consumers do not see the canonical date that is converted.
Figure 6-23 shows the template with column E hidden.
6.6 Understanding Excel Template Concepts
Similar to RTF template design, Excel template design follows the paradigm of mapping fields from the XML data to positions in the Excel worksheet. Excel templates make use of features of Excel in conjunction with special BI Publisher syntax to achieve this mapping. In addition to direct mapping of data elements, Excel templates support more complex formatting instructions by defining the cell ranges and the commands in a separate worksheet designated to contain these commands. This sheet is called the XDO_METADATA sheet.
6.6.1 Mapping Data Fields and Groups
Excel templates use named cells and groups of cells to enable BI Publisher to insert data elements. Cells are named using BI Publisher syntax to establish the mapping back to the XML data. The cell names are also used to establish a mapping within the template between the named cell and calculations and formatting instructions that are defined on the XDO_METADATA sheet.
The template content and layout must correspond to the content and hierarchy of the XML data file used as input to the report. Each group of repeating elements in the template must correspond to a parent-child relationship in the XML file. If the data is not structured to match the desired layout in Excel it is possible to regroup the data using XSLT preprocessing or the grouping functions. However, for the best performance and least complexity it is recommended that the data model be designed with the report layout in mind.
Note:
For more information about grouping, see the following:
6.6.2 Use of Excel Defined Names for Mapping
BI Publisher uses the Excel defined names feature to identify data fields and repeating elements. A defined name in Excel is a name that represents a cell, range of cells, formula, or constant value.
Tip:
To learn more about defined names and their usage in Microsoft Excel 2007, see the Microsoft help topic: "Define and use names in formulas."
The Template Builder for Excel automatically creates the defined names when you use it to insert fields and repeating groups. You can also insert the defined names manually. The defined names used in the Excel template must use the syntax described in this chapter and follow the Microsoft guidelines described in the Microsoft Excel help document. Note that BI Publisher defined names are within the scope of the template sheet.
Important:
When you create an Excel Template manually (that is, NOT using the BI Publisher Desktop Excel Template Builder), you must provide default values for all marked up cells XDO_?. The default values must match to the data type of the report data XML file. Without default values for the XDO_? cells, the output cells generated from those template cells may lose formatting and the result is unpredictable. If you use BI Publisher Desktop to create an Excel Template, the default values are automatically supplied with the first row of sample data in the report data file.
6.6.3 Use of "XDO_" Prefix to Create Defined Names
The BI Publisher defined names are Excel defined names identified by the prefix "XDO_". Creating the defined name with the BI Publisher code in the template creates the connection between the position of the code in the template and the XML data elements, and also maintains the ability to dynamically grow data ranges in the output reports, so that these data ranges can be referenced by other formula calculations, charts, and macros.
6.6.4 Using Native Excel Functions with the "XDO_" Defined Names
You can use the XDO_ defined names in Excel native formulas as long as the defined names are used in a simple table. When a report is generated, BI Publisher automatically adjusts the region ranges for those named regions so that the formulas calculate correctly.
However, if you create nested groups in the template, then the cells generated in the final report within the grouping can no longer be properly associated to the correct name. In this case, the use of XDO_ defined names with native Excel functions cannot be supported.
6.6.5 About the XDO_METADATA Sheet
Each Excel template requires a sheet within the template workbook called "XDO_METADATA". BI Publisher uses this sheet in the template in the following ways:
-
To identify the template as an Excel template.
-
To insert the code for the field and group mappings you create with the Template Builder.
As the template designer, you also use this sheet to specify more advanced calculations and processing instructions to perform on fields or groups in the template. BI Publisher provides a set of functions to provide specific report features. Other formatting and calculations can be expressed in XSLT.
Note:
For more information see Section 6.6.5.2, "Format of the XDO_METADATA Sheet" and Section 6.7, "Using Advanced BI Publisher Functions."
6.6.5.1 Creating the XDO_METADATA Sheet
When you begin the design of a new Excel template using the Template Builder, the first time you use one of the Insert functions the Template Builder automatically creates a hidden XDO_METADATA sheet. A message informs you that the sheet has been created.
BI Publisher creates the sheet as a hidden sheet. Use the Excel Unhide command to view and edit the XDO_METADATA sheet.
6.6.5.2 Format of the XDO_METADATA Sheet
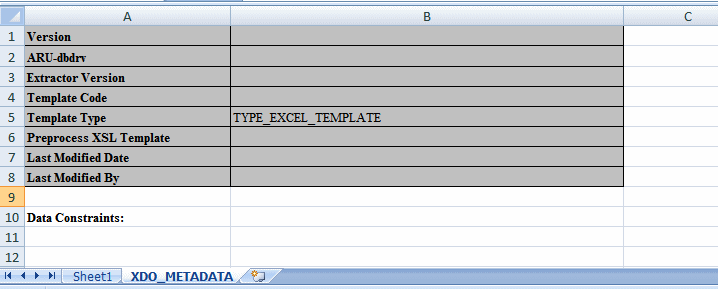
The XDO_METADATA sheet is created with the format shown in Figure 6-24.
Figure 6-24 Format of the XDO_METADATA Sheet
Description of "Figure 6-24 Format of the XDO_METADATA Sheet"
The format consists of two sections: the header section and the data constraints section. Both sections are required.
In the header section, all the entries in column A must be listed, but a value is required for only one: Template Type, as shown. The entries in Column A are:
-
Version
-
ARU-dbdrv
-
Extractor Version
-
Template Code
-
Template Type
-
Preprocess XSLT File
-
Last Modified Date
-
Last Modified By
The Data Constraints section is used to specify the data field mappings and other processing instructions. Details are provided in the following sections.
6.6.5.3 Hiding the XDO_METADATA Sheet
Oracle recommends that you hide the XDO_METADATA sheet before uploading the completed template to the BI Publisher catalog to prevent its inclusion in the final report output. Use the Excel Hide command to hide the sheet before uploading the template to the server.
6.7 Using Advanced BI Publisher Functions
BI Publisher provides a set of functions to achieve additional reporting functionality. You define these functions in the Data Constraints region of the XDO_METADATA sheet.
The functions make use of Columns A, B, and C in the XDO_METADATA sheet as follows:
Use Column A to declare the function or to specify the defined name of the object to which to map the results of a calculation or XSL evaluation.
Use Column B to enter the special XDO-XSL syntax to describe how to control the data constraints for the XDO function, or the XSL syntax that describes the special constraint to apply to the XDO_ named elements.
Use Column C to specify additional instructions for a few functions.
The functions are described in the following three sections:
6.7.1 Reporting Functions
Table 6-1 lists functions that you can add to a template using the commands shown and a combination of BI Publisher syntax and XSL. A summary list of the commands is shown in Table 6-1. See the corresponding section for details on usage.
| Function | Commands |
|---|---|
|
Section 6.7.1.1, "Splitting the Report into Multiple Sheets" |
XDO_SHEET_? with XDO_SHEET_NAME_? |
|
XDO_PARAM_?n? |
|
|
XDO_LINK_?link object name? |
|
|
XDO_SUBTEMPLATE_?n? |
|
|
XDO_EXT_?n? |
6.7.1.1 Splitting the Report into Multiple Sheets
Note:
Images are not supported across multiple sheets. If the template sheet includes images, when the data is split into multiple sheets, the images are displayed only on the first sheet.
Use the set of commands to define the logic to split the report data into multiple sheets, as described in the following list:
-
Use XDO_SHEET_? to define the logic by which to split the data onto a new sheet.
-
Use XDO_SHEET_NAME_? to specify the naming convention for each sheet.
Table 6-2 describes the column entries.
| Column A Entry | Column B Entry | Column C Entry |
|---|---|---|
|
XDO_SHEET_? |
<?xsl_evaluation to split the data?> Example: <?.//DEPT?> |
n/a |
|
XDO_SHEET_NAME_? |
<?xsl_expression to name the sheet?> Example: <?concat(.//DEPARTMENT_NAME,'-',count(.//EMP_NAME))?> |
(Optional) <?original sheet name?> Example: <?Sheet3?> |
XDO_SHEET_? must refer to an existing high-level node in the XML data. The example <?.//DEPT?> creates a new sheet for each occurrence of <DEPT> in the data.
If the data is flat, then you cannot use this command unless you first preprocess the data to create the desired hierarchy. To preprocess the data, define the transformation in an XSLT file, then specify this file in the Preprocess XSLT File field of the header section of the XDO _METADATA sheet. For more information, see Section 6.8, "Preprocessing the Data Using an XSL Transformation (XSLT) File."
Use XDO_SHEET_NAME_? to define the name to apply to the sheets. In Column B enter the XSL expression to derive the new sheet name. The expression can reference a value for an element or attribute in the XML data, or you can use the string operation on those elements to define the final sheet name. This example:
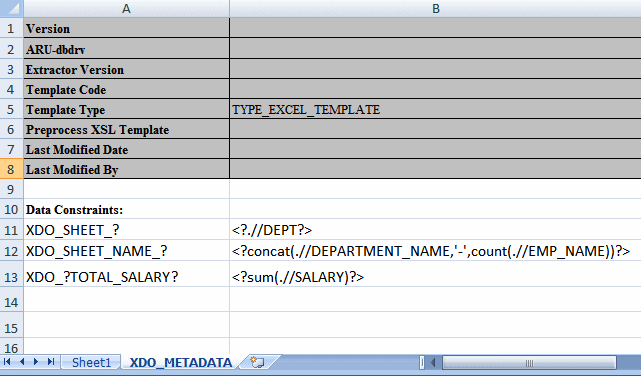
<?concat(.//DEPARTMENT_NAME,'-',count(.//EMP_NAME))?>
names each sheet using the value of DEPARTMENT_NAME concatenated with "-" and the count of employees in the DEPT group.
The original sheet name entry in Column C tells BI Publisher on which sheet to begin the specified sheet naming. If this parameter is not entered, BI Publisher applies the naming to the first sheet in the workbook that contains XDO_ names. You must enter this parameter if, for example, you have a report that contains summary data in the first two worksheets and the burst data should begin on Sheet3. In this case, you enter <?SHEET3?> in Column C.
Example: Splitting the data into multiple sheets
Using the employee data shown in the previous example. This example:
-
Creates a new worksheet for each department
-
Names each worksheet the name of the department with the number of employees in the department, for example: Sales-21.
To split the data into sheets:
-
Enter the defined names for each cell of employee data and create the group for the repeating employee data, as shown in Figure 6-25.
Figure 6-25 Defining Employee Data and the Group for Repeating Employee Data

Description of "Figure 6-25 Defining Employee Data and the Group for Repeating Employee Data"
Note:
Do not create the grouping around the department because the data is split by department.
-
Enter the values that are described in Table 6-3 in the Data Constraints section of the XDO_METADATA sheet.
The entries are shown in Figure 6-26.
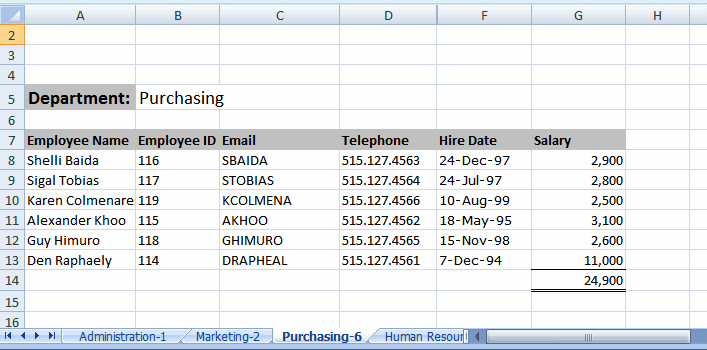
Figure 6-27 shows the generated report. Each department data now displays on its own sheet, which shows the naming convention specified.
Figure 6-27 Example of a Generated Report
Description of "Figure 6-27 Example of a Generated Report"
6.7.1.2 Declaring and Passing Parameters
To define a parameter, use the XDO_PARAM_?n? function to declare the parameter, then use the $parameter_name syntax to pass a value to the parameter. A parameter must be defined in the data model.
To declare the parameter, use the command that is described in Table 6-4.
Table 6-4 Command for Declaring Parameters
| Column A Entry | Column B Entry |
|---|---|
|
XDO_PARAM_?n? where n is unique identifier for the parameter |
<?param@begin:parameter_name;parameter_value?> where parameter_name is the name of the parameter from the data model and parameter_value is the optional default value. For example: <?param@begin:Country;US?> |
To use the value of the parameter directly in a cell, refer to the parameter as $parameter_name in the definition for the XDO_ defined name, as described in Table 6-5.
Table 6-5 Using a Parameter Directly
| Column A Entry | Column B Entry |
|---|---|
|
XDO_PARAM_?parameter_name? For example: XDO_PARAM_?Country? |
<?$parameter_name?>. For example: <?$Country?> |
You can also refer to the parameter in other logic or calculations in the XDO_METADATA sheet using $parameter_name.
Example: Defining and passing a parameter
To declare and reference a parameter named Country:
-
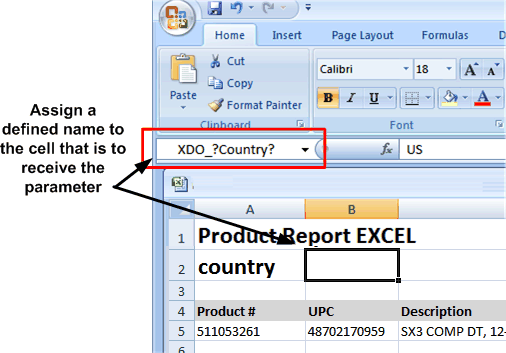
In the template sheet, mark the cell with a defined name. In the figure below, the cell has been marked with the defined name XDO_?Country?
Figure 6-28 Cell Marked with the Defined Name XDO_?Country?
Description of "Figure 6-28 Cell Marked with the Defined Name XDO_?Country?"
-
In the hidden sheet assign that cell the parameter value, as shown in Figure 6-29.
Figure 6-29 Assigning a Parameter Value to the XDO_?Country?Cell
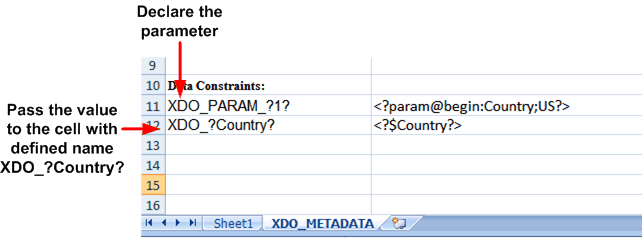
Description of "Figure 6-29 Assigning a Parameter Value to the XDO_?Country?Cell"
6.7.1.3 Defining a Link
Use the XDO_LINK_? command to define a hyperlink for any data cell, as described in Table 6-6.
Example: Defining a Link
| Column A Entry | Column B Entry |
|---|---|
|
XDO_LINK_?cell object name? For example: XDO_LINK_?INVOICE_NO? |
<xsl statement to build the dynamic URL> For example: <xsl:value-of select="concat('https://server.company.com/documents/invoice_print.show?c_rptno=',./INVOICE_NO)"/> |
Assume your company generates customer invoices. The invoices are stored in a central location accessible by a Web server and can be identified by the invoice number (INVOICE_NO).
To generate a report that creates a dynamic link to each invoice:
-
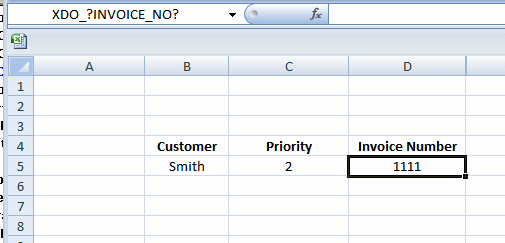
In the template sheet, assign the cell that is to display the INVOICE_NO the XDO defined name: XDO_?INVOICE_NO?, as shown in Figure 6-30.
Figure 6-30 Assigning the Defined Name XDO_?INVOICE_NO?
Description of "Figure 6-30 Assigning the Defined Name XDO_?INVOICE_NO?"
-
In the XDO_METADATA sheet, enter the appropriate values, as described in Table 6-7:
Table 6-7 Generating a Report with a Link
Column A Entry Column B Entry XDO_LINK_?INVOICE_NO?
<xsl:value-of select="concat('https://server.company.com/documents/invoice_print.show?c_rptno=',./INVOICE_NO)"/>
The entries in Excel are shown inFigure 6-31.
Figure 6-31 XDO_LINK?_?INVOICE_NO? Entries in Excel

Description of "Figure 6-31 XDO_LINK?_?INVOICE_NO? Entries in Excel"
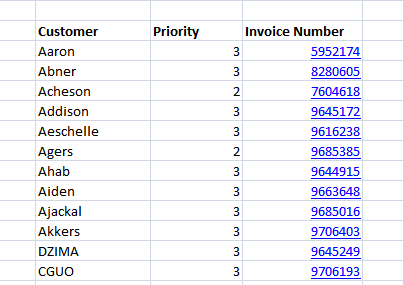
The report output is displayed as shown in Figure 6-32. The logic that is defined in the XDO_METADATA sheet is applied to create a hyperlink for each INVOICE_NO entry.
6.7.1.4 Importing and Calling a Subtemplate
Use these commands to declare XSL subtemplates that you can then call and reference in any of the XDO_ commands.
Note:
The Template Builder for Excel does not support preview for templates that import subtemplates.
To import the subtemplate, enter the command shown in Table 6-8.
Table 6-8 Importing a Subtemplate
| Column A Entry | Column B Entry |
|---|---|
|
XDO_SUBTEMPLATE_?n? where n is a unique identifier. For example: XDO_SUBTEMPLATE_?1? |
<xsl:import href="xdoxsl:///path to subtemplate.xsb?"/> For example: <xsl:import href="xdoxsl:///Shared Folders/Financial Reports/SubTemplates/MySubTemplate.xsb?"/> |
To call the subtemplate, declare the cell name for which the results should be returned in Column A, then enter the call-template syntax with any other XSL processing to be performed. The commands are shown in Table 6-9.
Table 6-9 Calling a Subtemplate
| Column A Entry | Column B Entry |
|---|---|
|
XDO_?cell object name? |
<xsl:call-template name="template_name"> </xsl:call-template> |
For more information on XSL subtemplates and creating the subtemplate object in the catalog, see Chapter 14, "Designing XSL Subtemplates."
Example: Importing and Calling a Subtemplate
Assume you have the following subtemplate uploaded to the BI Publisher catalog as PaymentsSummary-SubTemplate.xsb. This subtemplate evaluates the value of a parameter named pPayType and based on the value, return a string that indicates the payment type:
<?xml version="1.0" encoding="utf-8"?>
<xsl:stylesheet version="2.0"
 xmlns:xsl="http://www.w3.org/1999/XSL/Transform">
  <xsl:template match="/">
    </xsl:template>
      <xsl:template name="BRM_PAY_TYPES">
         <xsl:param name="pPayType" select="string('ALL')"/>
         <xsl:choose>
            <xsl:when test="$pPayType = '0'">UNDEFINED</xsl:when>
            <xsl:when test="$pPayType=string('10000')">PREPAID</xsl:when>
            <xsl:when test="$pPayType=string('10001')">INVOICE</xsl:when>
            <xsl:when test="$pPayType=string('10003')">CREDIT CARD</xsl:when>
            <xsl:when test="$pPayType=string('10005')">DIRECT DEBIT</xsl:when>
            <xsl:when test="$pPayType=string('10011')">CASH</xsl:when>
            <xsl:when test="$pPayType=string('10012')">CHECK</xsl:when>
            <xsl:when test="$pPayType=string('ALL')">ALL</xsl:when>
            </xsl:choose>
        </xsl:template>
</xsl:stylesheet>
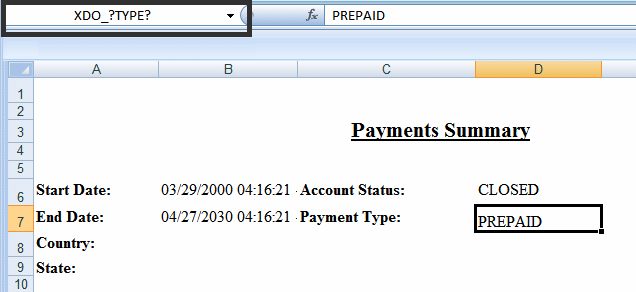
In the Excel template, you have defined a field with the XDO Defined Name XDO_?TYPE?, which is populated based on the string returned from code performed in the subtemplate, as shown in Figure 6-33.
Enter the commands shown in Table 6-10 in the Data Constraints region.
Table 6-10 Commands for Data Constraints Region
| Column A Entry | Column B Entry |
|---|---|
|
XDO_SUBTEMPLATE_?1? |
<xsl:import href="xdoxsl:///Shared Folders/Financial Reports/SubTemplates/PaymentsSummary-SubTemplate.xsb?"/> |
|
XDO_?TYPE? |
<xsl:call-template name="BRM_PAY_TYPES"> <xsl:with-param name="pPayType" select="string('10000')"/> </xsl:call-template> |
The XDO_SUBTEMPLATE_?1? function imports the subtemplate from the BI Publisher catalog.
The XDO_?TYPE? cell entry maps the results of the subtemplate processing entered in Column B.
6.7.1.5 Referencing Java Extension Libraries
You can include the reference to a Java extension library in the template and then call methods from this library to perform processing in the template. Use the command shown in Table 6-11 to reference the Java extension libraries.
Table 6-11 Referencing Java Extension Libraries
| Column A Entry | Column B Entry |
|---|---|
|
XDO_EXT_?n? where n is a unique identifier. Example: XDO_EXT?1? |
<?namespace:xmlns:bipext="extension library"?> Example: <?namespace:xmlns:bipext="http://www.example.com/XSL/Transform/java/ example.com.xmlpublisher.reports.BIPExtension"?> |
You can have multiple extension libraries defined in a single template file.
Example: Calling a Java Extension Library
Assume the extension library includes the following two methods that you want to call in the template:
-
bipext:infTimeToStr()
-
bipext:infStrToTimet()
After you have declared the library as shown above, specify the cell to which you want to apply the method by entering the XDO defined name in Column A and calling the function in Column B. Table 6-12 shows example commands.
Table 6-12 Example: Calling a Java Extension Library
| Column A Entry | Column B Entry |
|---|---|
|
XDO_?PARAM_START_DATE? |
<xsl:value-of select="bipext:infTimeToStr(bipext:infStrToTimet((.//PARAM_START_DATE)[1],2),3)" |
The entries in the XDO_METADATA sheet to declare and call the Java extension libraries are shown in Figure 6-34.
Figure 6-34 Entries in the XDO_METADATA Sheet to Declare and Call the Java Extension Libraries

Description of "Figure 6-34 Entries in the XDO_METADATA Sheet to Declare and Call the Java Extension Libraries "
6.7.2 Formatting Functions That Rely on Specific Data Attribute Values
The following commands require that specific formatting attributes be present in the XML data file. A summary list of the commands is shown in Table 6-13. See the corresponding section for details on usage.
Table 6-13 Commands for Specific Formatting Attributes
| Function | Command |
|---|---|
|
XDO_STYLE_n_?cell object name? |
|
|
XDO_SKIPROW_?cell object name? |
6.7.2.1 Defining Border and Underline Styles
While you can define a consistent style in the template using Excel formatting, the XDO_STYLE command enables you to define a different style for any data cell dynamically based on the XML data.
With the XDO_STYLE command you specify the cell to which to apply the style, the logic to determine when to apply the style, and the style type to apply. The style value must be present in the XML data. Table 6-14 provides examples.
Table 6-14 Defining Border and Underline Styles
| Column A Entry | Column B Entry | Column C Entry |
|---|---|---|
|
XDO_STYLE_n_?cell_object_name? For example: XDO_STYLE_1_?TOTAL_SALARY? |
<xsl evaluation that returns a supported value> For example: <xsl:value-of select=".//TOTAL_SALARY/@borderStyle"/> |
Style type For example: BottomBorderStyle |
BI Publisher supports the normal Excel style types and values as shown in Table 6-15.
Table 6-15 Excel Style Types and Values
| Style Type | Supported Values (Must be in returned by evaluation in Column B) | Supported Types (Enter in Column C) |
|---|---|---|
|
Normal |
BORDER_NONE BORDER_THIN BORDER_MEDIUM BORDER_DASHED BORDER_DOTTED BORDER_THICK BORDER_DOUBLE BORDER_HAIR BORDER_MEDIUM_DASHED BORDER_DASH_DOT BORDER_MEDIUM_DASH_DOT BORDER_DASH_DOT_DOT BORDER_MEDIUM_DASH_DOT_DOT BORDER_SLANTED_DASH_DOT |
BottomBorderStyle TopBorderStyle LeftBorderStyle RightBorderStyle DiagonalLineStyle |
You can also set a color using one of the types shown in Table 6-16.
| Style Type | Supported Value (Must be in returned by evaluation in Column B) | Supported Types (Enter in Column C) |
|---|---|---|
|
Normal |
When you set Color Style, give the value in RRBBGG hex format, for example: borderColor="0000FF" |
BottomBorderColor TopBorderColor LeftBorderColor RightBorderColor DiagonalLineColor |
BI Publisher also supports the underline type with the values shown in Table 6-17.
| Style Type | Supported Values (Must be in returned by evaluation in Column B) | Supported Type (Enter in Column C) |
|---|---|---|
|
Underline |
UNDERLINE_NONE UNDERLINE_SINGLE UNDERLINE_DOUBLE UNDERLINE_SINGLE_ACCOUNTING UNDERLINE_DOUBLE_ACCOUNTING |
UnderlineStyle |
You can have multiple underline styles defined for a single cell.
Example: Defining Styles
To apply a style in a template, the style value must be present in the data. In this example, a border style and an underline style are applied to the DEPT_TOTAL_SALARY field shown in the Excel template.
For this example, the following data is used. Note that the DEPT_TOTAL_SALARY element in the data has these attributes defined:
-
borderStyle
-
underLineStyle
-
borderColor
The value of each of these attributes is used to apply the defined style based on logic defined in the template.
<?xml version="1.0" encoding="UTF-8"?>

<EMPLOYEES>
  <G_DEPT>
    <DEPARTMENT_ID>10</DEPARTMENT_ID>
    <DEPARTMENT_NAME>Administration</DEPARTMENT_NAME>
    <LIST_G_EMP>
      <G_EMP>
        <EMPLOYEE_ID>200</EMPLOYEE_ID>
        <EMP_NAME>Jennifer Whalen</EMP_NAME>
        <EMAIL>JWHALEN</EMAIL>
        <PHONE_NUMBER>515.123.4444</PHONE_NUMBER>
        <HIRE_DATE>1987-09-17T00:00:00.000-06:00</HIRE_DATE>
        <SALARY>4400</SALARY>
      </G_EMP>
    </LIST_G_EMP>

    <DEPT_TOTAL_SALARY borderStyle="BORDER_DOUBLE" underLineStyle="UNDERLINE_DOUBLE_ACCOUNTING" borderColor="0000FF">4400</DEPT_TOTAL_SALARY>
  </G_DEPT>
  <G_DEPT>
    <DEPARTMENT_ID>20</DEPARTMENT_ID>
    <DEPARTMENT_NAME>Marketing</DEPARTMENT_NAME>
    <LIST_G_EMP>
      <G_EMP>
        <EMPLOYEE_ID>201</EMPLOYEE_ID>
        <EMP_NAME>Michael Hartstein</EMP_NAME>
        <EMAIL>MHARTSTE</EMAIL>
        <PHONE_NUMBER>515.123.5555</PHONE_NUMBER>
        <HIRE_DATE>1996-02-17T00:00:00.000-07:00</HIRE_DATE>
        <SALARY>13000</SALARY>
      </G_EMP>
      <G_EMP>
        <EMPLOYEE_ID>202</EMPLOYEE_ID>
        <EMP_NAME>Pat Fay</EMP_NAME>
        <EMAIL>PFAY</EMAIL>
        <PHONE_NUMBER>603.123.6666</PHONE_NUMBER>
        <HIRE_DATE>1997-08-17T00:00:00.000-06:00</HIRE_DATE>
        <SALARY>6000</SALARY>
        </G_EMP>
      </LIST_G_EMP>

      <DEPT_TOTAL_SALARY borderStyle="BORDER_DOUBLE" underLineStyle="UNDERLINE_DOUBLE_ACCOUNTING" borderColor="0000FF">19000</DEPT_TOTAL_SALARY>
  </G_DEPT>

...

</EMPLOYEES>
To define a style:
-
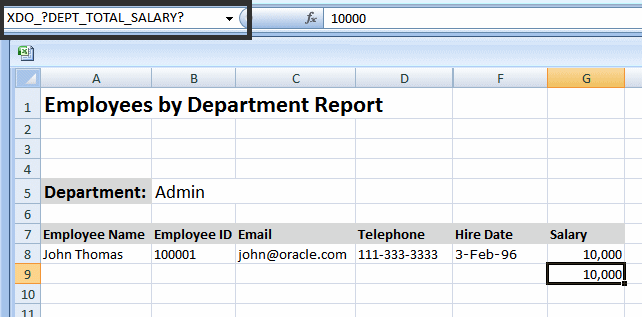
In the Excel template, assign the defined name XDO_?DEPT_TOTAL_SALARY? to the field that is to display the DEPT_TOTAL_SALARY from the data, as shown in Figure 6-35.
Figure 6-35 Assigning the Defined Name XDO_?DEPT_TOTAL_SALARY?
Description of "Figure 6-35 Assigning the Defined Name XDO_?DEPT_TOTAL_SALARY?"
-
In the XDO_METADATA sheet, enter the following:
-
To define the top border style, use the entries shown in Table 6-18.
Column A Entry Column B Entry Column C Entry XDO_STYLE_1_?DEPT_TOTAL_SALARY?
<xsl:value-of select=".//DEPT_TOTAL_SALARY/@borderStyle"/>
TopBorderStyle
The entry in Column A maps this style command to the cell assigned the name XDO_?DEPT_TOTAL_SALARY?
The entry in Column B retrieves the style value from the attribute borderStyle of the DEPT_TOTAL_SALARY element. Note from the sample data that the value for borderStyle is "BORDER_DOUBLE".
The entry in Column C tells BI Publisher to apply a TopBorderStyle to the cell.
-
To define the top border color, use the entries shown in Table 6-19.
Column A Entry Column B Entry Column C Entry XDO_STYLE_2_?DEPT_TOTAL_SALARY?
<?.//DEPT_TOTAL_SALARY/@borderColor?>
TopBorderColor
The entry in Column A maps this style command to the cell assigned the name XDO_?DEPT_TOTAL_SALARY?
The entry in Column B retrieves the style value from the attribute borderColor of the DEPT_TOTAL_SALARY element. Note from the sample data that the value for borderColor is "0000FF" (blue).
The entry in Column C tells BI Publisher to apply a TopBorderColor to the cell.
-
To define the underline style, use the entries shown in Table 6-20.
Table 6-20 Entries to Define Underline
Column A Entry Column B Entry Column C Entry XDO_STYLE_3_?DEPT_TOTAL_SALARY?
<?.//DEPT_TOTAL_SALARY/@underLineStyle?>
UnderlineStyle
The entry in Column A maps this style command to the cell assigned the name XDO_?DEPT_TOTAL_SALARY?
The entry in Column B retrieves the style value from the attribute underLineStyle of the DEPT_TOTAL_SALARY element. Note from the sample data that the value for underLineStyle is "UNDERLINE_DOUBLE_ACCOUNTING".
The entry in Column C tells BI Publisher to apply the UnderLineStyle to the cell.
-
Figure 6-36 shows the three entries in the Data Constraints region.
When you run the report, the style commands are applied to the XDO_?DEPT_TOTAL_SALARY? cell, as shown in Figure 6-37.
Figure 6-37 A Generated Report Showing Style Commands Applied to the XDO_?DEPT_TOTAL_SALARY? Cell
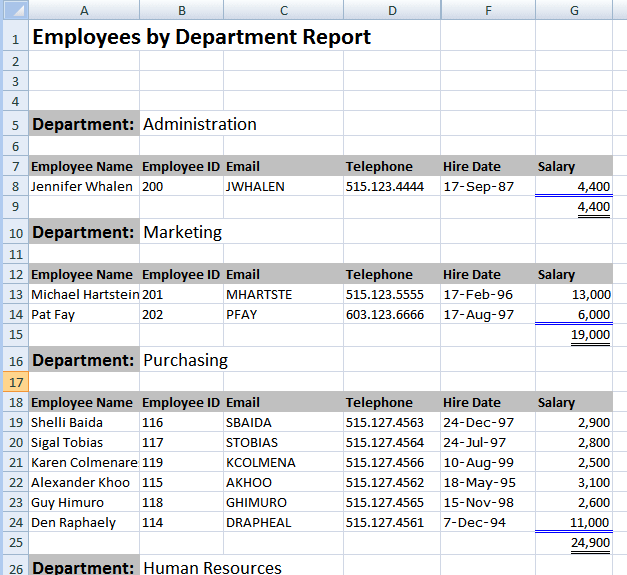
Description of "Figure 6-37 A Generated Report Showing Style Commands Applied to the XDO_?DEPT_TOTAL_SALARY? Cell"
6.7.2.2 Skipping a Row
Use the XDO_SKIPROW command to suppress the display of a row of data in a table when the results of an evaluation defined in Column B return the case insensitive string "True". Example entries are shown in Table 6-21.
| Column A Entry | Column B Entry |
|---|---|
|
XDO_SKIPROW_?cell_object_name? For example: XDO_SKIPROW_?EMPLOYEE_ID? |
<xsl evaluation that returns the string "True"/> For example: <xsl:if test="string-length(./EMPLOYEE_ID/@MANAGER) != 0"> <xsl:value-of select="./EMPLOYEE_ID/@MANAGER"/> </xsl:if> |
Example: Skipping a Row Based on Data Element Attribute
In this example, the Excel template suppresses the display of the row of employee data when the EMPLOYEE_ID element includes a "MANAGER" attribute with the value "True".
Assume data as shown below. Note that the EMPLOYEE_ID element for employee Michael Hartstein has the MANAGER attribute with the value "True". The other EMPLOYEE_ID elements in this set do not have the attribute.
<?xml version="1.0" encoding="UTF-8"?>

<EMPLOYEES>
  <G_DEPT>
    <DEPARTMENT_ID>20</DEPARTMENT_ID>
    <DEPARTMENT_NAME>Marketing</DEPARTMENT_NAME>
    <LIST_G_EMP>
      <G_EMP>
        <EMPLOYEE_ID MANAGER="TRUE">201</EMPLOYEE_ID>
        <EMP_NAME>Michael Hartstein</EMP_NAME>
        <EMAIL>MHARTSTE</EMAIL>
        <PHONE_NUMBER>515.123.5555</PHONE_NUMBER>
        <HIRE_DATE>1996-02-17T00:00:00.000-07:00</HIRE_DATE>
        <SALARY>13000</SALARY>
       </G_EMP>
       <G_EMP>
        <EMPLOYEE_ID>202</EMPLOYEE_ID>
        <EMP_NAME>Pat Fay</EMP_NAME>
        <EMAIL>PFAY</EMAIL>
        <PHONE_NUMBER>603.123.6666</PHONE_NUMBER>
        <HIRE_DATE>1997-08-17T00:00:00.000-06:00</HIRE_DATE>
        <SALARY>6000</SALARY>
       </G_EMP>
       <G_EMP>
        <EMPLOYEE_ID>652</EMPLOYEE_ID>
        <EMP_NAME>William Morgan</EMP_NAME>
        <EMAIL>WMORGAN</EMAIL>
        <PHONE_NUMBER>219.123.7776</PHONE_NUMBER>
        <HIRE_DATE>1994-10-17T00:00:00.000-06:00</HIRE_DATE>
        <SALARY>8000</SALARY>
       </G_EMP>
      </LIST_G_EMP>
  </G_DEPT>

...

</EMPLOYEES>
To suppress the display of the row of the employee data when the MANAGER attribute is set to "True", enter the entries shown in Table 6-22 in the Data Constraints section.
Table 6-22 Skipping a Row Based on Data Element Attribute
| Column A Entry | Column B Entry |
|---|---|
|
XDO_SKIPROW_?EMPLOYEE_ID? |
<xsl:if test="string-length(./EMPLOYEE_ID/@MANAGER) != 0"> <xsl:value-of select="./EMPLOYEE_ID/@MANAGER"/> </xsl:if> |
The output from this template is shown in Figure 6-38. Note that the employee Michael Hartstein is not included in the report.
6.7.3 Grouping Functions
Use the functions shown in Table 6-23 to create groupings of data in the template.
6.7.3.1 Grouping the data
Use the XDO_GROUP command to group flat data when the layout requires a specific data grouping, for example, to split the data across multiple sheets. Example entries are shown in Table 6-24.
| Column A Entry | Column B Entry | Column C Entry |
|---|---|---|
|
XDO_GROUP_?group element? For example: XDO_GROUP_?STATE_GROUP? |
<xsl beginning groupng logic/> For example: <xsl:for-each-group select="current-group()" group-by="./STATE"> <xsl:for-each-group select="current-group()" group-by="./RESOURCE_NAME"> <xsl:for-each select="current-group()"> |
<xsl ending groupng tags/> For example: </xsl:for-each> <xsl:for-each-group> <xsl:for-each-group> |
Define the XSL statements to be placed at the beginning and ending of the section of the group definition marked up by XDO_?cell object name?. You can mark multiple groups nested in the template, giving each the definition appropriate to the corresponding group.
6.7.3.2 Handling the Generated XDO Define Names in Nested Groups
When XDO_GROUP_? is used in a nested group, the ranges of XDO define names in the final report become meaningless. In this case, do not refer to the define names in formulas in the final report. You can disable the XDO markup activity in the final report using the command "XDO_MARKUP_?". Table 6-25 shows the usage of XDO_MARKUP_? in the XDO_METADATA sheet.
| Column A Entry | Column B Entry |
|---|---|
|
XDO_MARKUP_? |
"false" or "FALSE" (The cell must be formatted as Text in the Excel Format Cells dialog.) |
In addition, if your template includes a large number of defined names and these are used in multiple levels of nested groups, Excel may not be able to handle the number of generated defined names. In this case, use the XDO_MARKUP_? command to disable markup for the generated report.
When set to "false", BI Publisher does not produce any defined names for any result produced by XDO_GROUP_?
6.7.3.3 Regrouping the Data
The XDO_REGROUP regroups the data by declaring the structure using the defined names. The XDO_REGROUP logic is a shortened form of the XDO_GROUP logic and does not require the XSLTcoding requirements in the XDO_METADATA sheet. The definition must therefore be directly on XDO_REGROUP_? define names, or on any other definition on the XDO_METADATA sheet. Entries are shown in Table 6-26.
Table 6-26 Regrouping the Data
| Column A Entry | Column B Entry |
|---|---|
|
XDO_REGROUP_? |
XDO_REGROUP_?UniqueGroupID?levelName?groupByName?sortByName?sortByName?sortByName? where
|
Table 6-27, Table 6-28, and Table 6-29 show an example of how to create three nested groupings.
Table 6-27 Creating Nested Groupings, Example 1
| Column A Entry | Column B Entry |
|---|---|
|
XDO_REGROUP_? |
XDO_REGROUP_?PAYMENTSUMMARY_Q1?PAYMENTSUMMARY_Q1?PAY_TYPE_NAME? |
In the definition shown in Table 6-27, the most outer group is defined as PAYMENTSUMMARY_Q1, and it is grouped by PAY_TYPE_NAME
Table 6-28 Creating Nested Groupings, Example 2
| Column A Entry | Column B Entry |
|---|---|
|
XDO_REGROUP_? |
XDO_REGROUP_?COUNTRYGRP?XDO_CURRGRP_?COUNTRY? |
The definition shown in Table 6-28 creates a second outer group. The group is assigned the name COUNTRY_GRP and it is grouped by the element COUNTRY.
Table 6-29 Creating Nested Groupings, Example 3
| Column A Entry | Column B Entry |
|---|---|
|
XDO_REGROUP_? |
XDO_REGROUP_?STATEGRP?XDO_CURRGRP_?STATE? |
The definition shown in Table 6-29 creates the inner group STATEGRP and it includes a sortByName parameter: STATE.
6.8 Preprocessing the Data Using an XSL Transformation (XSLT) File
For the best performance, design the data model to perform as much of the data processing as possible. When it is not possible to get the required output from the data engine, you can preprocess the data using an XSLT file that contains the instructions to transform the data. Some sample use cases include:
-
To create groups to establish the necessary hierarchy to support the desired layout
-
To add style attributes to data elements
-
To perform complex data processing logic that may be impossible in the Excel Template or undesirable for performance reasons
Note:
The Template Builder for Excel does not support preview for templates that require XSLT preprocessing.
To use an XSLT preprocess file:
-
Create the file and save as .xsl.
-
Upload the file to the report definition in the BI Publisher catalog, as you would a template:
-
Navigate to the report in the catalog.
-
Click Edit.
-
Click Add New Layout.
-
Click Upload.
-
Complete the fields in the Upload dialog and select "XSL Stylesheet (HTML/XML/Text)" as the template Type.
-
After upload, click View a List. Deselect Active, so that users do not see this template as an option when they view the report.
Note:
For testing purposes, you might want to maintain the XSL template as active to enable you to view the intermediate data when the template is applied to the data. After testing is complete, set the template to inactive.
-
Save the report definition.
-
-
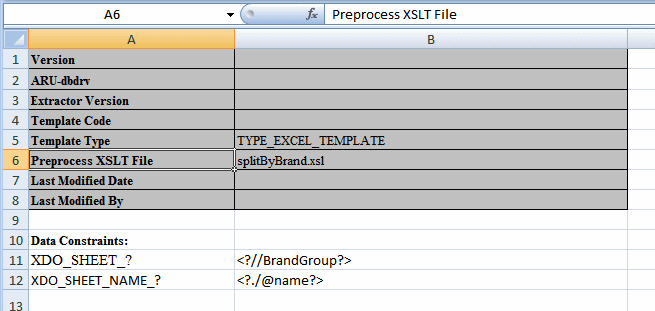
In the Excel template, on the XDO_METADATA sheet, in the Header section, enter the file name for the Preprocess XSLT File parameter. For example: splitByBrand.xsl
6.8.1 XSLT Preprocessing Examples: Splitting Flat Data into Multiple Sheets
This section includes two examples of using an XSLT preprocess file to group flat data so that it can be split into multiple sheets in Excel. The examples are:
-
Splitting the Data by Count of Rows
Splitting the data by row count is an option when your report data exceeds the sheet row size of Excel 2003 (65,536 rows per sheet).
Both examples use the following XML data:
 <ROWSET>
    <ROW>
    <Products.Type>COATINGS</Products.Type>
    <Products.Brand>Enterprise</Products.Brand>
    <Markets.Region>CENTRAL REGION</Markets.Region>
    <Markets.District>CHICAGO DISTRICT</Markets.District>
    <Periods.Year>2000</Periods.Year>
    <Measures.Dollars>1555548.0</Measures.Dollars>
   </ROW>
   <ROW>
    <Products.Type>COATINGS</Products.Type>
    <Products.Brand>Enterprise</Products.Brand>
    <Markets.Region>EASTERN REGION</Markets.Region>
    <Markets.District>NEW YORK DISTRICT</Markets.District>
    <Periods.Year>2000</Periods.Year>
    <Measures.Dollars>1409228.0</Measures.Dollars>
   </ROW>
...
</ROWSET>
6.8.1.1 Splitting the Data by a Specific Field
This example demonstrates how to use an XSLT preprocess file to create a grouping in the data that will enable the splitting of the data across multiple Excel sheets based on the grouping. This example groups the sample data by the Products.Brand field.
-
Create an XSLT file to group the data.
The following sample XSLT file groups the data according to
<Products.Brand>and creates a high level element<BrandGroup>for each of those groups.<?xml version="1.0" encoding="utf-8" ?> <xsl:stylesheet version="2.0" xmlns:xsl="http://www.w3.org/1999/XSL/Transform"> <xsl:template match="/"> <ROWSET> <xsl:for-each-group select="/ROWSET/ROW" group-by="./Products.Brand"> <xsl:variable name="var_brand" select="current-grouping-key()" /> <BrandGroup> <xsl:attribute name="name"> <xsl:value-of select="$var_brand" /> </xsl:attribute> <xsl:copy-of select="current-group()" /> </BrandGroup> </xsl:for-each-group> </ROWSET> </xsl:template></xsl:stylesheet>When applied to the data sample, this XSLT file generates intermediate data as follows:
<ROWSET> <BrandGroup name="Enterprise"> <ROW> <Products.Type>COATINGS</Products.Type> <Products.Brand>Enterprise</Products.Brand> <Markets.Region>CENTRAL REGION</Markets.Region> <Markets.District>CHICAGO DISTRICT</Markets.District> <Periods.Year>2000</Periods.Year> <Measures.Dollars>1555548.0</Measures.Dollars> </ROW> ... </BrandGroup> ... <ROWSET> -
Save the XSLT file as
splitByBrand.xsland upload the file to the report definition in the BI Publisher catalog. Select "XSL Stylesheet (HTML/XML/Text)" as the template Type. -
In the Excel template file, in the XDO_METADATA sheet, enter the following:
-
For the Preprocess XSLT File parameter, enter "splitByBrand.xsl"
-
In the Data Constraints region, make the entries shown in Table 6-30 to split the data into multiple sheets based on the
<BrandGroup>element created by the results of the XSLT preprocessing.Table 6-30 Entries in Data Constraints Region to Split by Brand
Column A Entry Column B Entry XDO_SHEET_?
<?//BrandGroup?>
XDO_SHEET_NAME_?
<?./@name?>
The sample entries in the XDO_METADATA sheet are shown in Figure 6-39.
-
-
Hide the XDO_METADATA sheet if you do not want your users to see it. Upload the Excel template file to the report definition in the BI Publisher catalog.
6.8.1.2 Splitting the Data by Count of Rows
This example demonstrates how to use an XSLT preprocess file to group the sample XML data by the count of occurrences of /ROWSET/ROW and then configure the Excel template to create a new sheet for each occurrence of the newly created group.
-
Create an XSLT file to create groups in the data according to a size specified in a variable.
The following sample XSLT file groups the occurrences of /ROWSET/ROW according to the value of
$var_sizeand creates a high level element<CountGroup>for each of those groups.<?xml version="1.0" encoding="utf-8" ?> <xsl:stylesheet version="2.0" xmlns:xsl="http://www.w3.org/1999/XSL/Transform"> <xsl:template match="/"> <ROWSET> <xsl:variable name="var_size" select="3" /> <xsl:for-each select="/ROWSET/ROW"> <xsl:variable name="var_pos" select="position()" /> <xsl:variable name="var_mod" select="$var_pos mod($var_size)" /> <xsl:if test="$var_mod = 1"> <xsl:variable name="var_groupNum" select="($var_pos - $var_mod) div number($var_size) + 1" /> <xsl:element name="CountGroup"> <xsl:attribute name="name"> <xsl:value-of select="concat('Group', $var_groupNum)" /> </xsl:attribute> <xsl:for-each select="/ROWSET/ROW[position() > ($var_pos -1) and position() < ($var_pos + $var_size)]"> <xsl:copy-of select="." /> </xsl:for-each> </xsl:element> </xsl:if> </xsl:for-each> </ROWSET> </xsl:template> </xsl:stylesheet>When applied to the data sample, this XSLT file generates intermediate data as follows:
<ROWSET> <CountGroup name="Group1"> <ROW> <Products.Type>COATINGS</Products.Type> <Products.Brand>Enterprise</Products.Brand> <Markets.Region>CENTRAL REGION</Markets.Region> <Markets.District>CHICAGO DISTRICT</Markets.District> <Periods.Year>2000</Periods.Year> <Measures.Dollars>1555548.0</Measures.Dollars> </ROW> ... </CountGroup> ... <ROWSET> -
Save the XSLT file as
splitByCount.xsland upload the file to the report definition in the BI Publisher catalog. Select "XSL Stylesheet (HTML/XML/Text)" as the template Type. -
In the Excel template file, in the XDO_METADATA sheet, enter the following:
-
For the Preprocess XSLT File parameter, enter "splitByCount.xsl"
-
In the Data Constraints region, make the entries shown in Table 6-31.
-
-
Hide the XDO_METADATA sheet so that it does not display to report consumers.
-
Upload the Excel template file to the report definition in the BI Publisher catalog.
6.9 Using the Template Viewer to Debug a Template
If the template preview is not generating the results expected, then you can use the Template Viewer to enable trace settings to view debug messages. The Template Viewer also enables you to save and view the intermediate XSL file that is generated after the sample data and template are merged in the XSL-FO processor. If you are familiar with XSL, then this can be a very useful debugging tool.
The Template Viewer is installed when you install the Template Builder for Word; see Section 6.1.5, "Desktop Tools for Excel Templates" for more information.
To preview with the Template Viewer and view log messages:
-
Open the Template Viewer:
From the Windows desktop, click Start, then Programs, then Oracle BI Publisher Desktop, then Template Viewer.
-
Click Browse to locate the folder that contains the sample data file and template file. The data file and template file must reside in the same folder.
-
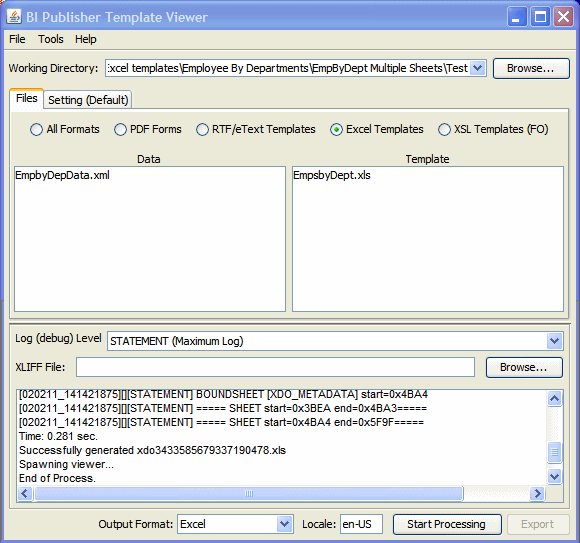
Select Excel Templates. The Data and Template regions display all .xml files and all .xls files present in the directory, as shown in Figure 6-40.
Figure 6-40 The Data and Template Regions Showing All .xml and .xls Files
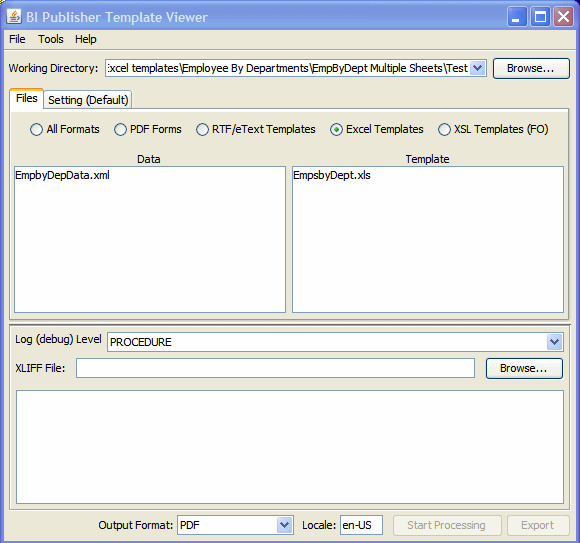
Description of "Figure 6-40 The Data and Template Regions Showing All .xml and .xls Files"
-
Click the appropriate data and template files to select them.
-
Select the log level.
-
From the Output Format list, select Excel.
-
Click Start Processing.
The Template Viewer merges the selected data with the selected template and spawn the appropriate viewer. View any log messages in the message box, as shown in Figure 6-41.
To view the generated XSL:
-
In the Template Viewer, select the data and template files and choose Excel output.
-
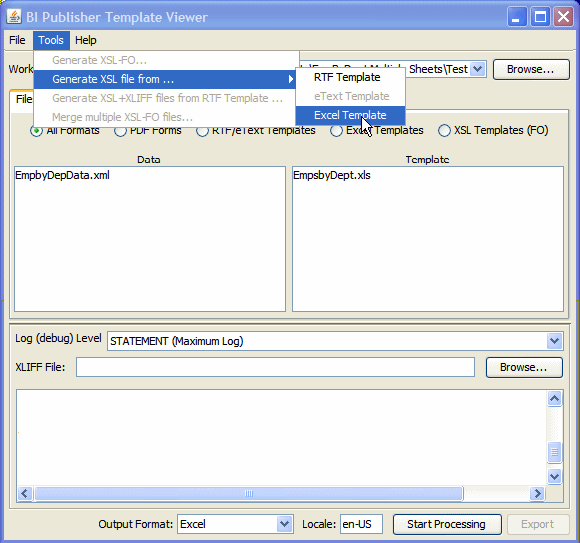
On the Tools menu, select Generate XSL file from and then choose Excel Template, as shown in Figure 6-42.
-
At the prompt, save the generated XSL file.
-
Navigate to the saved location and open the XSL file in an appropriate viewer.

