Adding Data Elements to a Blank Canvas
You can add data elements directly from the Data Elements pane to a blank canvas.
To add data elements to a blank canvas:
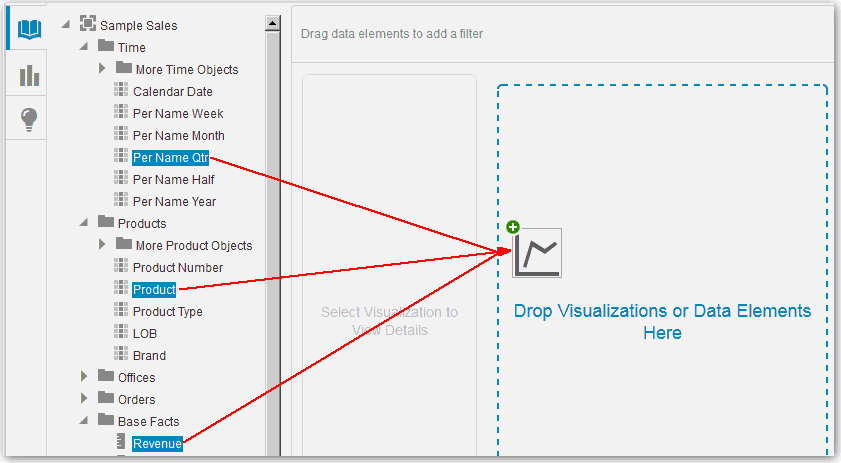
Drag one or more data elements to a blank canvas or between visualizations on the canvas. A visualization is automatically created and the best visualization type and layout are selected. For example, if you add time and product attributes and a revenue measure to a blank canvas, the data elements are placed in the best locations and the visualization type of Line is selected.

Description of the illustration GUID-C7427491-92B0-470B-B8D8-C25B313E4F8A-default.gif
Note:
If there are visualizations already on the canvas, then you can drag and drop data elements between them.