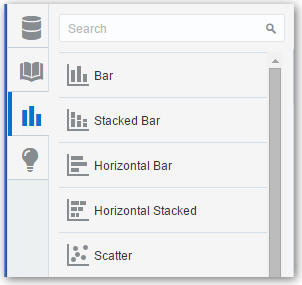
Changing Visualization Types

You can change visualization types to maximize the graphical representation of the data you are exploring.

The visualization type is automatically chosen based on the selected data elements. However, this is only true when you create a new visualization by dragging data elements to a blank area on the canvas. Once a visualization is created, dragging additional data elements to it won’t change the visualization type automatically.

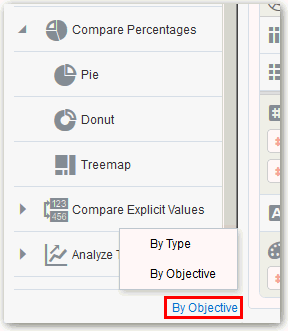
You can also search for visualization types by the type or objective. For example, you can search for visualization types to use for comparing percentages such as a pie or donut chart.

To change visualization types:
  1. Select a visualization on the canvas, and on the visualization toolbar, click Change Visualization Type.

    Note:

    You can also add a new visualization to the canvas by dragging it from the Visualizations pane to the canvas.
    Description of GUID-CCBFC4D9-00D4-46E2-9F45-4C6F79B36009-default.jpg follows
    Description of the illustration GUID-CCBFC4D9-00D4-46E2-9F45-4C6F79B36009-default.jpg
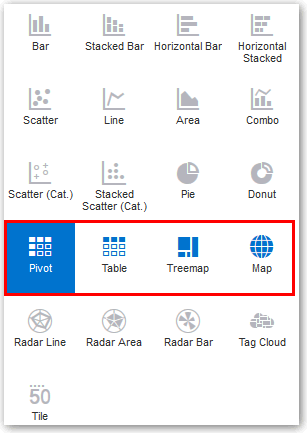
  2. In the View Select dialog, select a visualization type. For example, change the visualization type from Bar to Stacked Bar.

    Note:

    You can choose any visualization type, but the visualization types that are displayed in blue are the recommended ones based on the data elements you select and where they are positioned on the canvas.
    Description of GUID-019614D7-6CDF-4DB2-BA64-49F85762DF75-default.gif follows
    Description of the illustration GUID-019614D7-6CDF-4DB2-BA64-49F85762DF75-default.gif
    When you change the visualization type, the data elements are moved to matching drop target names. If an equivalent drop target does not exist for the new visualization type, then the data elements are moved to a drop target labeled “Unused”. You can then move them to the drop target you prefer.