You can work with color for specific visualizations on the canvas. Series and data point coloring are shared across all visualizations within a project, so if you change the series or data point color in one visualization, this can affect the colors in other visualizations.
To set color in visualizations:
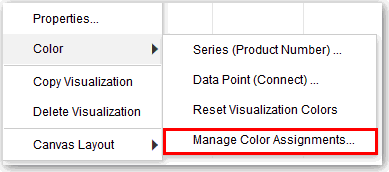
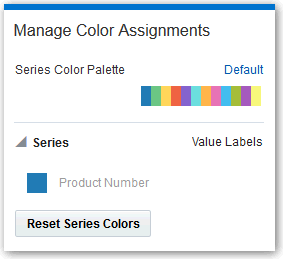
- To manage color assignments for attributes and measures in a visualization, right-click in the visualization, select Color, and then select Manage Color Assignments.
You can then reset the series colors, or select a different color palette by series. If you click Reset Series Colors, it re-renders the visualization and only the current data element colors in the visualization are reset.
- To reset the series and data point color overrides for attributes and measures in a specific visualization, right-click in the visualization, select Color, and then select Reset Visualization Colors.
Note:
You can also reset series and data point color overrides for all visualization in a project. See
Applying Color to Projects.
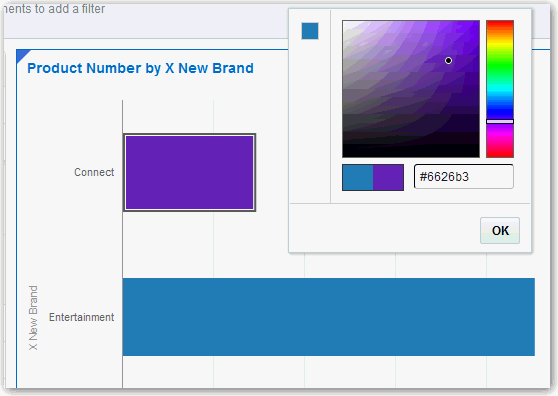
- To set color by data point in a visualization, right-click the visualization, select Color, and then select Data Point (HomeView). This is the home view value and the color is applied across a series in the visualization.
Note:
Color management tools apply to all visualization types with the exception of Tile.


