39.2 New Features and Benefits
Oracle Reports provides a convenient way for you to add a wide variety of graphs to both paper-based and JSP-based Web Reports.
Oracle Reports 12c (12.2.1.1) supports the following features:
-
Scalable Vector Graphics (SVG) image support
-
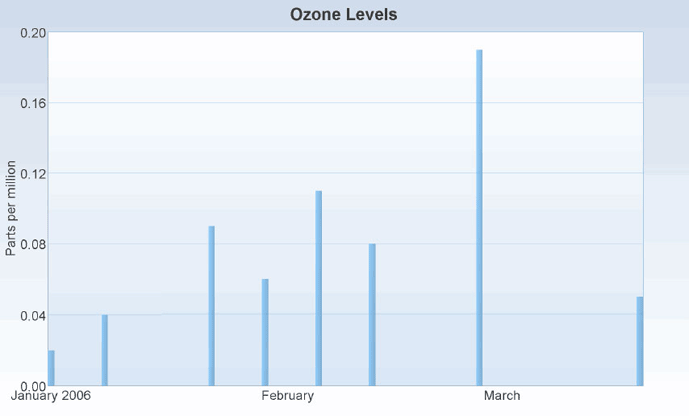
Plotting Irregular time periods. For more information, see Plotting Irregular Time Periods.
-
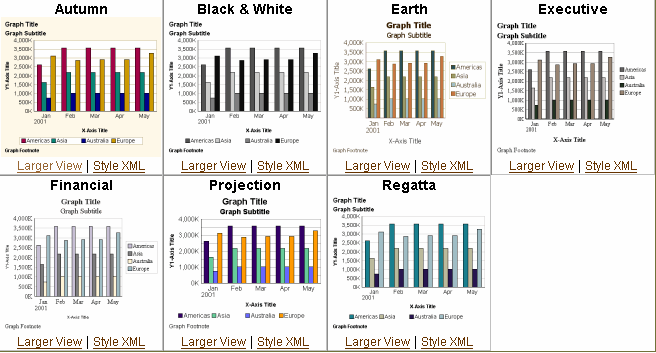
New Chart Style in Graph Wizard. For more information, see New Chart Styles.
-
Number formatting support in Graph Wizard
With the new graph types and features, Reports Builder provides the following benefits:
-
More graph types for the varied usage
-
Better graph image output without loosing resolution
-
Plot time data without restrictions
-
Format the numbers in the graph independent of the data model
Plotting Irregular Time Periods
Oracle Reports 12c (12.2.1.1) provides support for plotting irregular time periods on time axis. For more information see Figure 39-1, "Plotting Irregular Time Period".
Figure 39-1 Plotting Irregular Time Period

Description of ''Figure 39-1 Plotting Irregular Time Period''
Oracle Reports 12c (12.2.1.1) supports the following new chart styles:
-
Autumn
-
Black and White
-
Earth
-
Executive
-
Financial
-
Projection
-
Regatta
For more information, see Figure 39-2, "New Chart Styles".
