28 Building a Time Series Calculations Report
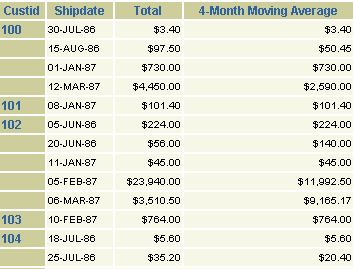
In this chapter, you will learn about reports that show data based on calculations over a period of time. By following the steps in this chapter, you can generate the report output shown in Figure 28-1.
Figure 28-1 Time series calculations report output

Description of ''Figure 28-1 Time series calculations report output''
Reports with time series calculations calculate values over a specified period of time. The techniques described for this report can be used to produce other formats of time series calculations, as well.
This time series calculations report uses a query that will compute four-month moving averages of customer purchases. The SELECT statement will sum the current purchase (TOTAL) with purchases made by that customer in the previous four months, then average that sum through use of a self-join. For example, if the data queried is 30-JUL-00, Oracle Reports will average all purchases the customer made between 30 MAR-00 and 30-JUL-00.
In this example, you will use the Report Wizard to create a simple time series calculations report for both paper and the Web that calculates and displays the four-month average of purchases for each customer. For the JSP-based Web report, you will modify the Web source to change labels and add format masks.
As you build this example report, you will:
-
Create a Query and the Layout using the Report Wizard to create a data model and layout for both the paper and Web reports.
-
Modify the Web Source of Your JSP Report to generate the JSP-based Web report.
To see a sample time series calculations report, open the examples folder named timeseries, then open the Oracle Reports example called timeseries.rdf. For details on how to open it, see "Accessing the Example Reports" in the Preface.