3 Using Consoles
This chapter describes the consoles, dashboards and widgets available to the business executive using Oracle Real-Time Integration Business Insight.
3.1 Overview
Oracle Real-Time Integration Business Insight provides executive-level metrics using consoles, dashboards, and home page widgets .
When a model is activated, Insight automatically creates a console , giving the business executive immediate visibility into the details of business performance. This console shows detailed metrics collected by Insight, focusing specifically on the milestones.
Consoles are intended for users acting only as business executives. Business executive users are assigned to the appropriate role in Insight, giving them access to the console and dashboard features of the product. Users not assigned to the business executive role are not able to view consoles, dashboards, or summary cards.
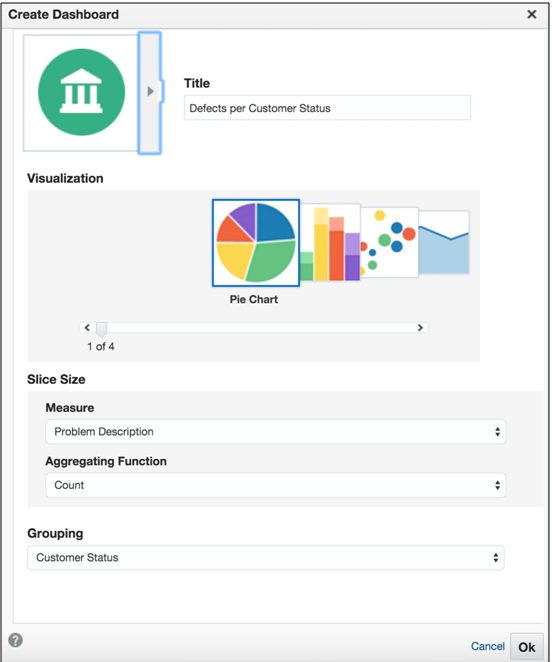
You can also create your own dashboards based on the indicators defined in the model. This allows you to track metrics specific to your business using custom visualizations that work for you.
3.2 Default Milestone Dashboards
This section describes the consoles and dashboards delivered with Oracle Real-Time Integration Business Insight.
3.2.1 Finding Your Console (Console Listing)
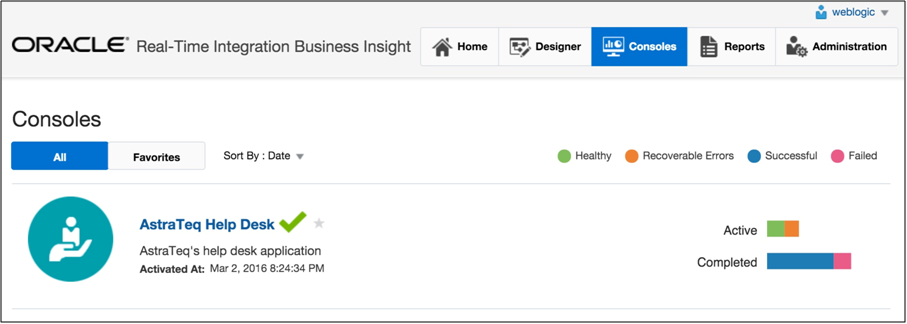
Clicking the Consoles tab takes you to the Console List page. Here, you can view all active models along with a summary of their current runtime activity over the past 24 hours. Clicking a model name opens the console for that model.
3.2.2 Filtering In the Console
The first part of the console is the filter criteria, which is collapsed by default.
When considering trends in the aggregate metrics shown on the console, or when trying to find specific sets of instances, it is often important to restrict instances to those that match specified criteria. The criteria that you specify here determines which instances are included in the various charts and tables on the console.
Only milestone-related filter criteria can be specified, including instance start date, end date, duration, passed milestones, and so on.
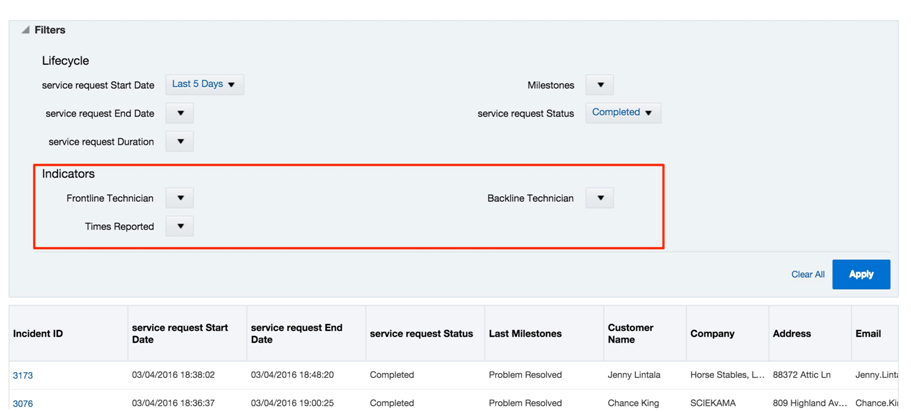
Note that for the Business Transaction Dashboard and Custom Dashboards, you can also specify criteria based on indicators in the model that have been marked as filterable.
3.2.3 Milestone Summary Dashboard
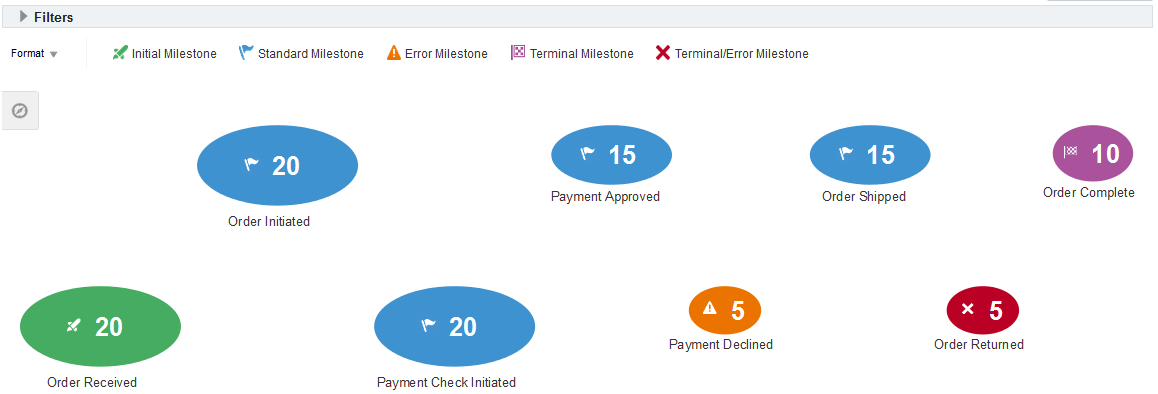
The Milestone Summary Dashboard in the console shows how long it took, on average, to move between milestones. This information is very useful for identifying hotspots in a business process. The default view of the Milestone Summary Dashboard is diagrammatic view.
For example, if over the past week it has taken an average of six hours to move from the “Order Initiated” milestone to the following milestone, which is generally “Order Shipped”, you can easily recognize whether this is within the company’s target for handling new problems at the help desk.
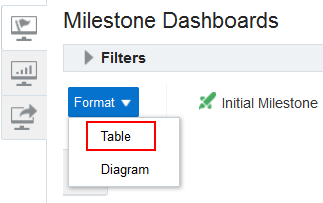
To make things easier to process visually, Insight also provides a tabular visualization of the Milestone Summary Dashboard. By changing the format from Diagram to Table, you can use a tabular representation to quickly identify milestones that have been passed most frequently.
3.2.4 Milestone Dashboards
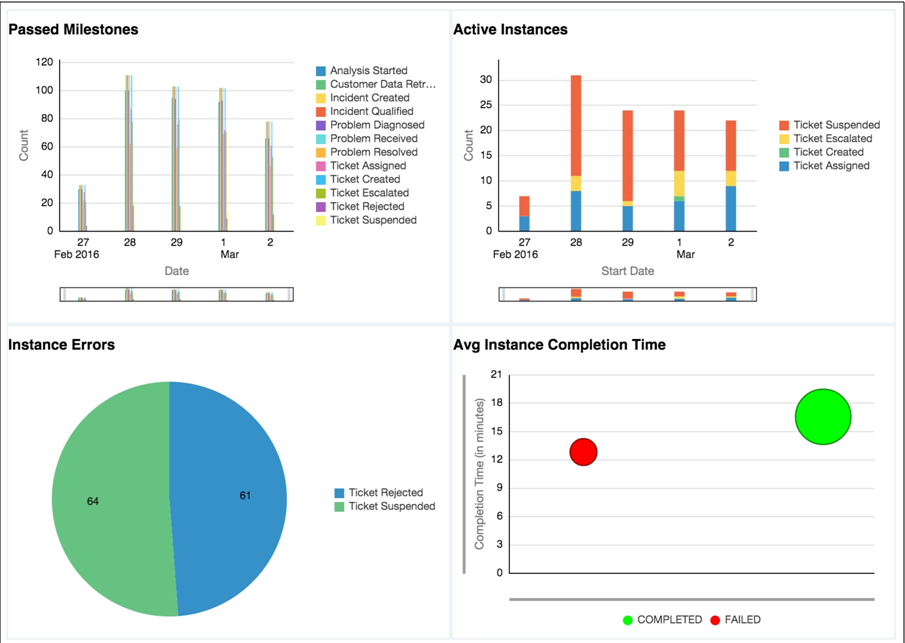
The console also includes four out-of-the-box milestone dashboards that are available immediately after a model is activated. Each dashboard shows a different view of the current status of the business application, based on aggregate milestone performance.
The dashboards are interactive, allowing the executive user to zoom, modify the legend, among other operations.
The Passed Milestones dashboard allows you to see number of passed milestones everyday.
The Active Instances dashboard shows information on the aggregate status of instances that are still active, that is instances that have not completed.
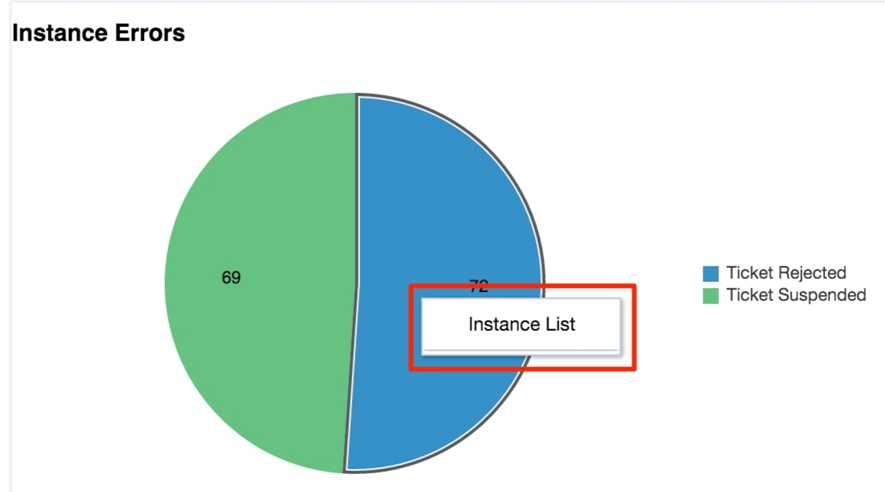
The Instance Errors dashboard shows the instances which have last passed an error milestone and have not progressed beyond that point.
Finally, the Average Instance Completion Time dashboard depicts the number of successful completions and the number of failures, along with how long each category took, on average.
3.3 Drilling to the Details
This section describes console functionality including search, drill across and navigation.
3.3.1 Searching
Executives can find specific instances of a model, for example a particular order or a specific help ticket using the search functionality of the console. Search is only supported on indicators’ values.
3.3.2 Drilling From Charts and Tables
Dashboards support the ability to “drill across” into the underlying set of instances that comprise the values in an aggregate dashboard. For example, if you want to see the set of instances that passed the “Ticket Rejected” milestone, right-clicking on the appropriate pie slice in the Instance Errors dashboard and selecting “Business Transaction Dashboard” shows you the list of instances.
3.3.3 Navigating the Business Transaction Dashboard
The Business Transaction Dashboard shows information including the start date, the end date, the last milestone passed, and the values of various indicators, collected by Insight and associated with the model. The Business Transaction Dashboard provides you with the ability to search for one instance by the unique identifier defined in the model.
Users with appropriate role privileges can inspect lists of instances that match search criteria from the Business Transaction Dashboard. From this list, you can drill down into instances and inspect detailed metrics, by clicking on the identifier value for any row (contained in the left-most column).
Figure 3-8 Business Transaction Dashboard
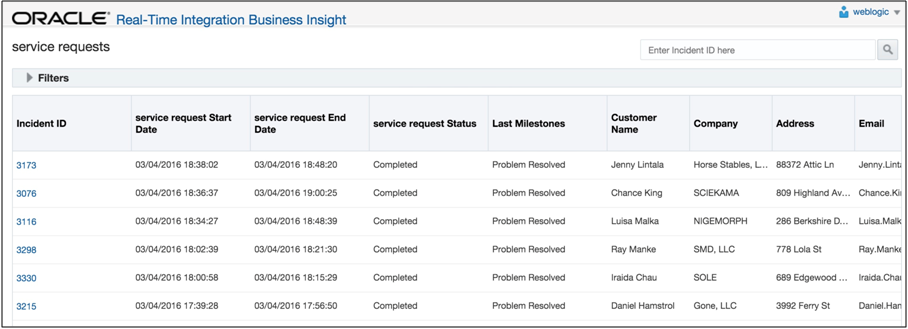
Description of "Figure 3-8 Business Transaction Dashboard"
Note:
You can also further refine the list of instances shown in the Business Transaction Dashboard by modifying the filter criteria. There are more options available in the Business Transaction Dashboard filter criteria than there are in the filter criteria on the console, since you can also filter here by indicator values.3.3.4 Milestone Details
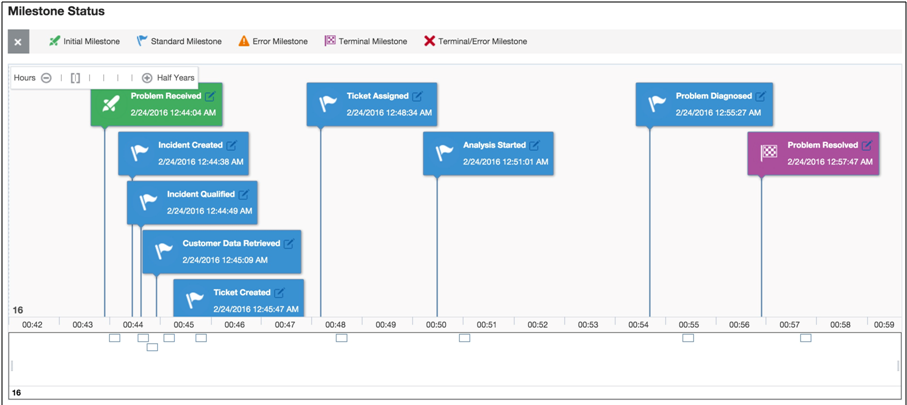
Drilling into a single instance from the Business Transaction Dashboard takes you to the Instance Details page. The Instance Details page shows a chronological detailed progression of the milestones that were passed for a single instance. The milestones for the instance are shown on a timeline, ordered from first (on the left) to last (on the right).
The Instance Details page also shows a list of indicators grouped according to the milestone with which they are associated, and the values of these indicators. Clicking on any milestone in the timeline will filter out only the indicators collected when that milestone was passed.
For more information, see the Instance Details Page in the Using Oracle Real-Time Integration Business Insight.
3.3.5 Submitting a Support Request
An important feature of Insight is the ability to report problems with individual instances to IT for support. Communication between IT and the business user is often impeded by differing vocabularies – business owners care about the performance of the business: “Where’s my order?”, while IT focuses on the technical performance of applications and services: “What exception was thrown how many times by which service?”.
Insight helps bridge this gap by allowing the business executive to escalate business failures to IT with both business context and technical details.
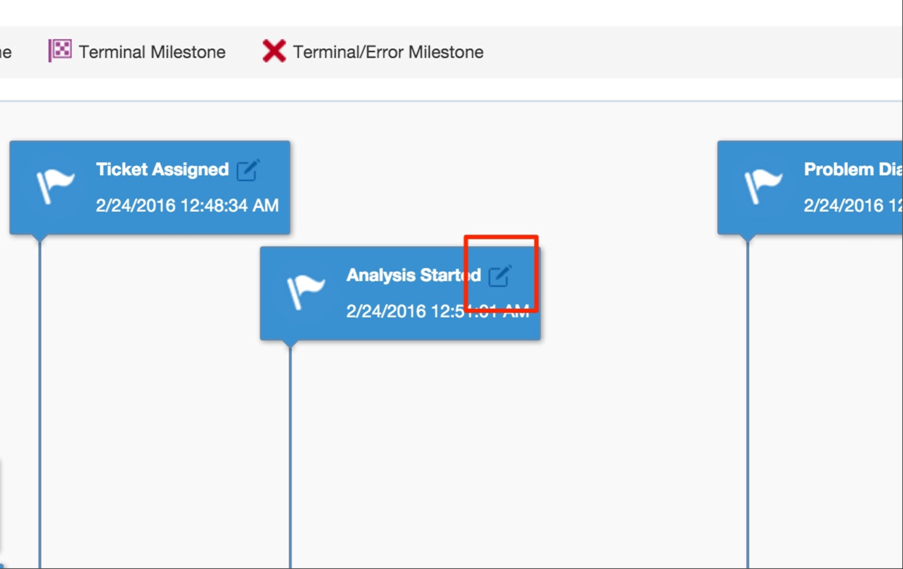
Business owners can use the Report a Problem feature on the Instance Details page, either for the entire instance or for an individual milestone. This feature generates an e-mail that provides the IT administrator with both the business context (such as which milestones have been passed), and immediate access to the technical details for the instance. The technical details come in the form of a link to the runtime instance flow trace in Enterprise Manager Fusion Middleware Control.
3.4 Custom Dashboards – Visualizing Your Indicators
Using custom dashboards in the console, you can track metrics, ratios, and trends that are important to your business. If a model has indicators, you can create custom dashboards to capture the data related to the indicators. As the milestones dashboards capture only data related to the milestones, a custom dashboard allows you to visualize graphs and charts for indicators. You can visualize the indicators defined and extracted as the application runs.
You can add as many custom dashboards as you like. Each custom dashboard is represented by a title and an icon (chosen while creating the dashboard).
3.5 Home Page Model Summary Cards
The Home page is where the executive user lands after logging into Insight. On the Home page you’ll find a number of useful widgets, including descriptive shortcuts to other parts of the application, links to frequently used reports, and summary cards.
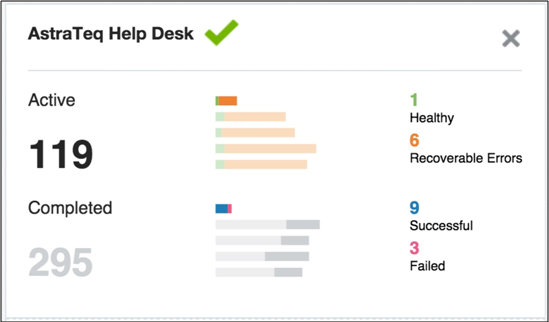
Summary cards are convenient for gaining a quick understanding of the current functioning state of a model, including how many instances of a model are active vs. completed over the last five days. You can add up to six summary cards to your Home page.
