1 Tutorial Overview
In this tutorial, it is assumed that you are a developer for a company called My Company. You have been asked to publish some content on the company intranet. Human resource managers for each branch should be able to view this content from any location. You must use the company's template (which is an HTML file) to make the data look good on the Web. At the same time, managers must be able to print a paper version of the report.
In this tutorial, you will build a report for the Web using JavaServer Pages (JSP) that displays the required information about employee salaries in each department. You will also create a graph so that managers can see an overview of the data. At the end of the tutorial, you will learn to generate a paper report based on the same data model.
Figure 1-1 shows an overview of the first part of the tutorial.
Figure 1-1 Tutorial Overview: Creating the Web Report
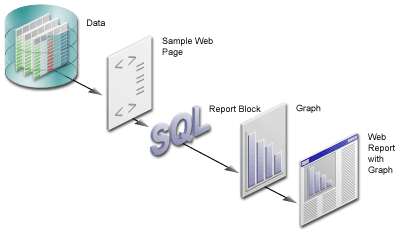
Description of ''Figure 1-1 Tutorial Overview: Creating the Web Report''
1.1 Tutorial Scenario
In the chapters of this tutorial:
-
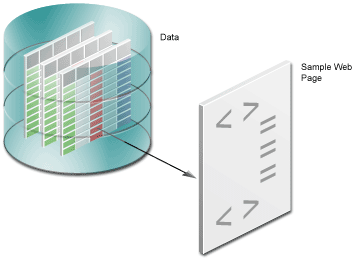
You will open the Web page that have been provided for you, which contains some simple HTML, then create a data model for the report, which will pull data from a sample data source into the report (Chapter 2, "Adding Data to a Report"). This Web page contains the template for My Company's look and feel.
-
In Chapter 3, "Reviewing the Source Code of the Web Report", you will review the resulting report to analyze what the steps you completed in Chapter 2, "Adding Data to a Report" did to the sample Web page to help you understand what Reports Builder did to the sample Web page. You can compare the sample Web page that have been provided with the resulting JSP-based Web page. Here, you will be able to examine how the data model looks in Reports Builder, and how it looks in XML.
-
In Chapter 5, "Creating a Report Block for the Web Report", you will use the Report wizard to add a report block to the JSP and generate a simple JSP-based Web report to your Web browser.
Figure 1-3 Creating a Report Block for your JSP-based Web Report
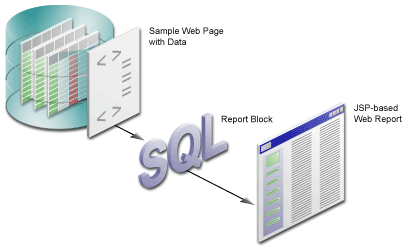
Description of ''Figure 1-3 Creating a Report Block for your JSP-based Web Report''
-
In Chapter 4, "Reviewing the Source Code for the Report Block", you will analyze the Web source of your report to review how the report block was inserted into your JSP-based Web report. Again, you will examine the XML code to see how the source code has changed.
-
In Chapter 6, "Creating a Graph for the Web Report", you will use the Graph wizard to add a graph to the JSP, then generate the completed JSP report to your Web browser.
Figure 1-4 Adding a Graph to a JSP-based Web Report
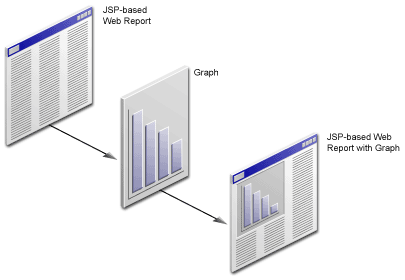
Description of ''Figure 1-4 Adding a Graph to a JSP-based Web Report''
-
In Chapter 7, "Reviewing the Source Code for the Graph", you will review the new code that Reports Builder added to your Web source to produce the graph.
-
In Chapter 8, "Generating a Paper Report", you will generate a paper report based on the same data model and layout that you created for the JSP-based Web report.
Figure 1-5 Generating a Paper Report from a JSP-based Web Report Data Model
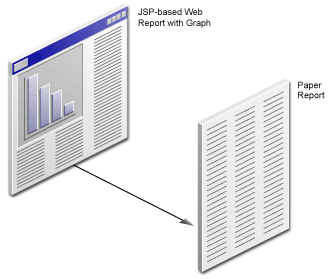
Description of ''Figure 1-5 Generating a Paper Report from a JSP-based Web Report Data Model''
1.2 Summary
Now that you know what this tutorial covers, you can go on to Chapter 2, "Adding Data to a Report" to learn how to create a data model for your report using the Data Wizard.
