

    |
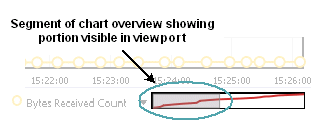
The chart overview is a horizontal bar that is displayed by default beneath the viewport of time series charts.

The dark grey segment of the chart overview indicates the portion of the chart that is visible in the viewport. You can use this segment as a scrollbar to pan the chart's data, as explained in Pan and zoom the metrics data shown in a chart.
| |