31 Testing and Debugging MAF Applications
This chapter provides information on testing and debugging MAF applications developed for both iOS and Android platforms.
This chapter includes the following sections:
31.1 Introduction to Testing and Debugging MAF Applications
Before you start any testing and debugging of your MAF application, you have to deploy it to one of the following:
-
iOS-powered device
-
iOS-powered device simulator
-
Android-powered device
-
Android-powered device emulator
You cannot run the MAF application until it is deployed. For more information, see Chapter 28, "Deploying Mobile Applications."
To test and debug a MAF application, you generally take the following steps:
-
Test the application's infrastructure, such as a splash screen, application feature navigation, authentication, and preferences, ensuring that all declared application features are available.
-
If the application includes MAF AMX content, test this application feature's logic, page flows, data controls, and UI components.
-
Make changes to the application as necessary.
-
Reconnect the mobile device or restart the simulator, and then deploy and run the application for further testing and debugging.
For more information, see the following:
31.2 Testing MAF Applications
There are two approaches to testing a MAF application:
-
Testing on a mobile device: this method always provides the most accurate behavior, and is also necessary to gauge the performance of your application. However, you may not have access to all the devices on which you wish to test, making device testing inconclusive.
-
Testing on a mobile device emulator or simulator: this method usually offers better performance and faster deployment, as well as convenience. However, even though a device emulator or simulator closely approximates the corresponding physical device, there might be differences in behavior and limitations on the capabilities that can be emulated.
Typically, a combination of both approaches yields the best results.
31.2.1 How to Perform Accessibility Testing on iOS-Powered Devices
You should use a combination of the following methods to test the accessibility of your MAF application developed for iOS-powered devices:
-
Testing with the Accessibility Inspector on an iOS-powered device simulator.
For detailed information, see the "Testing the Accessibility of Your iPhone Application" section in the Accessibility Programming Guide for iOS available through the iOS Developer Library.
-
Testing with the VoiceOver on an iOS-powered device.
For more information, see the "Using VoiceOver to Test Your Application" section in the Accessibility Programming Guide for iOS available through the iOS Developer Library.
31.3 Debugging MAF Applications
OEPE is equipped with debugging mechanisms that allow you to execute a Java program in debug mode and use standard breakpoints to monitor and control execution of an application.
In general, there are two different ways to debug an application, using Java remote debugging, or using JavaScript remote debugging. Only Java remote debugging is fully supported.
Since a MAF application cannot be run inside OEPE, the debugging approach is different: you can use the OEPE debugger to connect to a Java Virtual Machine (JVM) 1.4 instance on a mobile device or simulator and control the Java portions of your deployed MAF application.
MAF automatically configures the project properties for remote debugging (see Section 31.3.1, "What You May Need to Know About the Debugging Configuration"). The following are the steps you need to take to use OEPE to debug the Java code in your MAF application:
-
In the debug configuration, click the Debug tab and select Debug Java Code. This sets the following debugging parameter in the
maf.propertiesfile:java.debug.enabled=true
For more information, see Section 31.3.5, "How to Enable Debugging of Java Code and JavaScript."
-
Redeploy the application to the mobile device or simulator.
-
Launch the application in a mobile device or simulator by clicking the application icon.
-
Use a Remote Java Application configuration to connect to the remote VM.
-
Create a new Remote Java Application configuration. Click Run > Debug Configurations. In the configuration window, double-click Remote Java Application.
-
Give the configuration a name, and browse to the project of the application you are debugging.
-
Note:
To avoid timeout, start the debugger soon after launching the application on the mobile device or simulator.If the deployment is successful, and the application on the device is started in debug mode, it will block until remote debugging is connected. The timeout is usually a few minutes.
If you use the mobile device for debugging, perform the following tasks.
On Android
-
Ensure that port forwarding is established
On iOS
-
Ensure that your development computer and mobile device are visible to each other through TCP (they can ping each other).
-
Modify the Host field of the Remote Java Application configuration by replacing the localhost with the IP address of the mobile device.
For additional information, see Section 31.3.1, "What You May Need to Know About the Debugging Configuration"
31.3.1 What You May Need to Know About the Debugging Configuration
After you have created the application, you must create the deployment configuration and the remote debugging configuration, as follows:
-
From the OEPE main menu, click Run > Debug Configurations to open the launch configurations dialog.
-
In the list of configuration types, double-click the MAF Application node.
-
Give the new MAF Debug configuration a name, and on the Main tab choose the assembly project of the application.
-
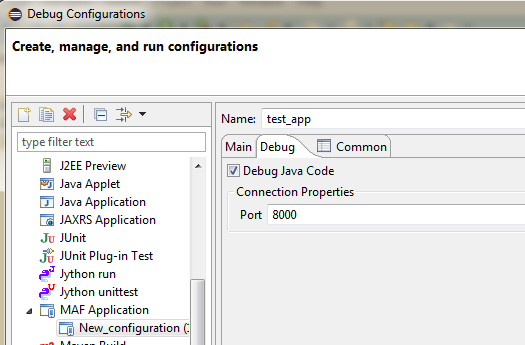
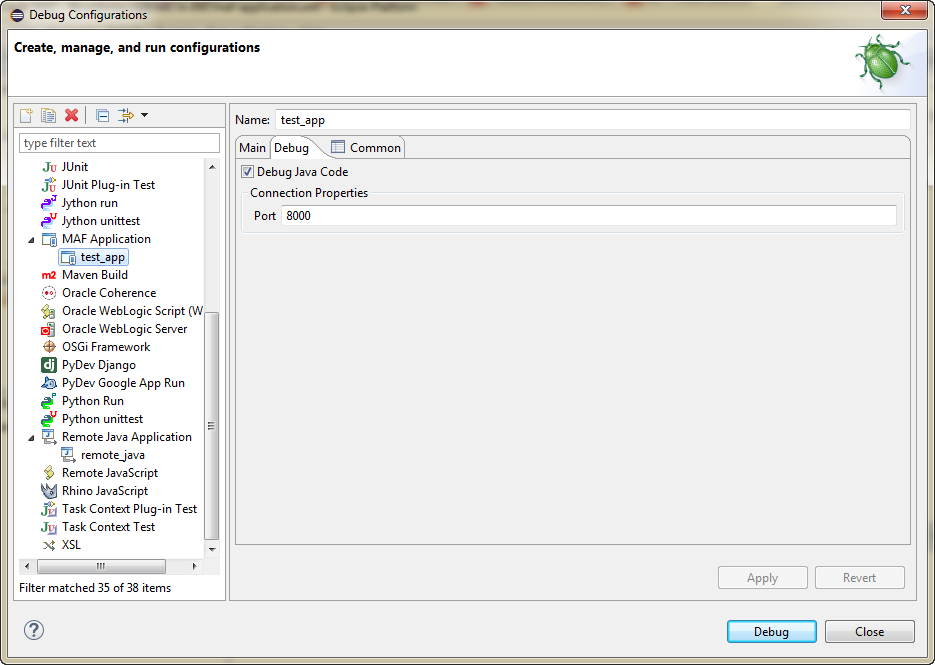
In the Debug tab, select Debug Java Code and set the port to the appropriate port number, as shown in Figure 31-1.
-
Click Apply to save the configuration settings.
-
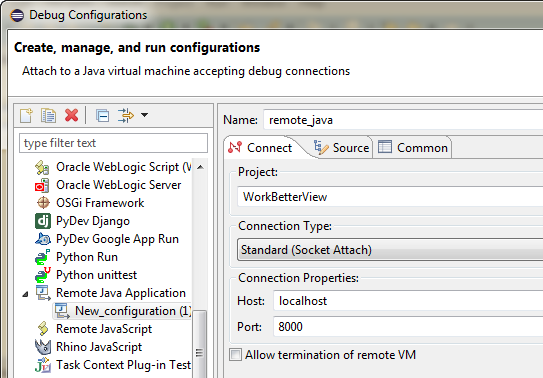
In the list of configuration types, double-click the Remote Java Applications node. On the Connect tab, as shown in Figure 31-2:
-
Browse to the project you want to debug.
-
Set the host:
-
For simulator or emulator debugging, set to localhost.
-
For remote debugging on Android, set to be the host IP of the computer where the Android Debug Bridge (adb) is running (usually
localhost). adb must have port forwarding enabled and the remote debugging port to use is the same port that is forwarded to. Use the commandadb forward --listto show all ports to forward to. -
For remote debugging on iOS, ensure that your development computer can access that device over the network (you may use the
pingcommand to test network access), and then enter the device's IP address.
-
-
Set the port:
-
For simulator or emulator debugging, set the port to the same port number at the debug configuration.
-
For remote debugging on Android, adb (Android Debug Bridge) must have port forwarding enabled. Set the port to the same port that is forwarded to. Use the command
adb forward --listto show all ports to forward to. -
For remote debugging on iOS, set the port to the same port number at the debug configuration.
-
-
MAF specifies the following debugging parameter in the maf.properties file:
java.debug.port=8000
This port number matches the one set in OEPE.
31.3.2 How to Debug on iOS Platform
To debug a MAF application on the iOS platform using OEPE, follow the generic debugging procedure described in Section 31.3, "Debugging MAF Applications."
For information on how to configure an iOS-powered device or simulator and how to deploy a MAF application for debugging, see the following:
31.3.3 How to Debug on Android Platform
To debug a MAF application on the Android platform using OEPE, follow the generic debugging procedure described in Section 31.3, "Debugging MAF Applications."
For information on how to configure an Android-powered device or emulator and how to deploy a MAF application for debugging, see Section 28.3.2, "How to Deploy an Android Application to an Android Emulator."
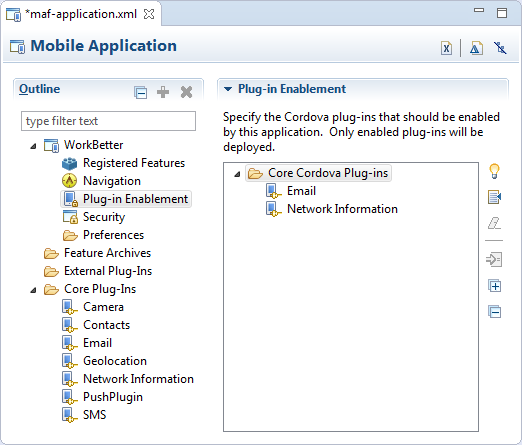
To allow debugging of a MAF application running on an Android-powered device or its emulator, networking and internet access is automatically enabled when debugging. The Network Information plugin is enabled in the MAF Application Editor, as Figure 31-3 shows.
When you debug Java code, either on an Android-powered device connected through USB or on an Android-powered device emulator, the final step of deployment automatically executes port forwarding. This is the same as if you executed the following command on a terminal:
-
For the device debugging:
adb -d forward tcp:8000tcp:8000 -
For the emulator debugging:
adb -e forward tcp:8000 tcp:8000
Sometimes the adb process freezes and you need to kill the process and restart it.
To kill the process, use:
-
Windows: use the process manager
-
Mac terminal: use the
kill -9procIDcommand
Restart the adb daemon by executing the following command on a terminal:
adb devices
A deployment that succeeded before adb froze will still be deployed. To debug an application, redeploy it.
The Debug Java Code in the Debug tab in the Launch configuration controls java.debug.* properties in the maf.properties file. Selecting Debug Java Code sets:
java.debug.enabled=true
Changing the default port number sets:
java.debug.port=nnnn
For more information, see Section 31.3.5, "How to Enable Debugging of Java Code and JavaScript."
Note:
If the connection is made through Wi-Fi, ensure that this connection is correct. It is recommended to place both the debugger and target on the same network without the use of the virtual private network (VPN).31.3.4 How to Debug the MAF AMX Content
If your MAF application includes the MAF AMX content, after you configure the device or emulator, you can set breakpoints, view the contents of variables, and inspect the method call stack just as you would when debugging other types of applications in OEPE.
Note:
You can only debug your Java code and JavaScript (see Section 31.3.5, "How to Enable Debugging of Java Code and JavaScript"). Debugging of EL expressions or other declarative elements is not supported.31.3.5 How to Enable Debugging of Java Code and JavaScript
A maf.properties file allows you to specify startup parameters for the JVM and web views of MAF to enable debugging of the Java code and JavaScript. The maf.properties file is automatically created and placed in the Descriptors/META-INF directory under the Application Resources (see Section 31.4, "Using and Configuring Logging"), which corresponds to the <application_name>/META-INF location in your application file system.
You can use the following debugging properties in the maf.properties file:
-
java.debug.enabled: Enables or disables Java debugging for MAF. Valid values aretrueandfalse.Caution:
Whenjava.debug.enabledis set totrue, the JVM waits for a debugger to establish a connection to it. Failure of the debugger to connect will result in the failure of the MAF AMX application feature to load. -
java.debug.port: Specifies the port to be used during debugging. The valid value is an integer. -
javascript.debug.enabled: Enables or disables JavaScript debugging when the application is running in the device simulator. Valid values aretrueandfalse. -
javascript.debug.feature: Specifies the application feature that is to trigger the activation of JavaScript debugging in MAF. The format of the value isfeatureId:port. The port must be specified (it is initially set to a placeholder value).
Note:
Thejavascript.debug.enabled and javascript.debug.feature settings are only valid on iOS and Safari versions earlier than 6.0.
If both iOS and Safari versions are later than 6.0, then neither of these two properties should be specified. Instead, follow the instructions from Section 31.3.5.1, "What You May Need to Know About Debugging of JavaScript Using an iOS-Powered Device Simulator on iOS 6 Platform."
The contents of the maf.properties file may be similar to the following:
java.debug.enabled=true
java.debug.port=8000

javascript.debug.enabled=true
javascript.debug.feature=products:8888
After the maf.properties file has been configured to debug JavaScript, you can navigate to the following URL to see a listing of all the loaded pages that can be debugged in MAF:
http://localhost:9999
For information on how to use OEPE to debug the Java code, see Section 31.3, "Debugging MAF Applications."
31.3.5.1 What You May Need to Know About Debugging of JavaScript Using an iOS-Powered Device Simulator on iOS 6 Platform
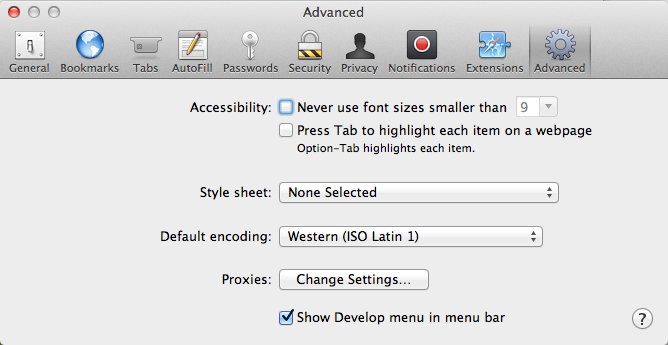
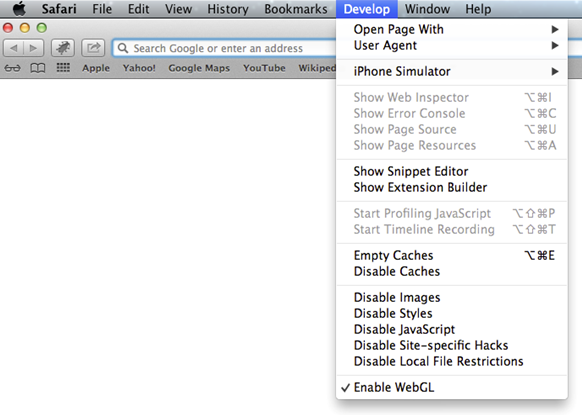
If you are working with the iOS 6 platform, you can use the Safari 6 browser to debug JavaScript. To do so, open the Safari preferences, select Advanced, and then enable the Develop menu in the browser by selecting Show Develop menu in menu bar, as shown in Figure 31-4.
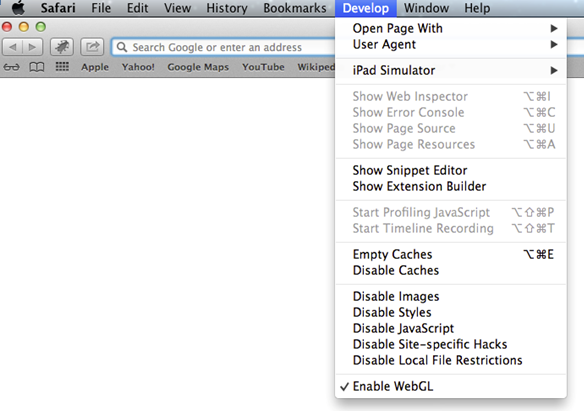
When the Develop menu is enabled, select either iPhone Simulator or iPad Simulator, as Figure 31-5 and Figure 31-6 show, and then select a UIWebView that you are planning to debug. Whether the Develop menu displays an iPhone Simulator or iPad Simulator option depends on which device simulator is launched.
31.3.6 How to Configure the Debug Mode
You use the application's deployment profile to specify either the release or debug execution mode for your MAF application. Only the debug mode enables you to interactively debug Java and JavaScript code. The debug mode allows for inclusion of special debugging libraries and symbols at compile time.
Figure 31-7 shows how to set the debug mode option on Android or iOS.
For more information, see the following:
31.4 Using and Configuring Logging
For your MAF application, you can enable logging on all supported platforms through JavaScript (see Section 31.4.2, "How to Use JavaScript Logging") and embedded code (see Section 31.4.3, "How to Use Embedded Logging") using a single configuration with the log output directed to a single file. This log output includes the output produced by System.out.println and System.err.println statements.
The default MAF's logging process is as follows:
-
The logging begins at application startup.
-
The existing log file from the previous application run is deleted, so only the contents of the current run are available.
-
When you are running your application on an iOS-powered device simulator, all logging output is typically sent to the console which you can access through the
Application/Utilitiesdirectory on your development computer. However, if your development computer is running on Mac OS 10.8.n, you can only access the Java logging output through a file of whose name and location you are notified as soon as the output redirection occurs and the file is generated. One of the possible locations for this file is/Users/<userid>/Library/Application Support/iPhone Simulator/6.0/Applications/<AppID>/Documents/logs/application.logWhen you are running your application on an iOS-powered device, the console output is redirected to an
application.logfile that is placed in theDocuments/logsdirectory of your application.On Android, the output is forwarded to a text file with the same name as the application. The output file location is
/sdcard. If this location is not present or is configured as read-only, the log output is rerouted to the application's writable data directory. -
The
logging.propertiesfile is automatically created and placed in the<assembly project>/META-INFlocation in your application file system (see Section 31.4, "Using and Configuring Logging"). In this file, it is defined that all loggers use thecom.sun.util.logging.ConsoleHandlerandSimpleFormatter, and the log level is set toSEVERE. You can edit this file to specify different logging behavior (see Section 31.4.1, "How to Configure Logging Using the Properties File").Note:
In your MAF application, you cannot use loggers from thejava.util.loggingpackage.
MAF loggers are declared in the oracle.adfmf.util.Utility class as follows:
public static final String APP_LOGNAME = "oracle.adfmf.application";
public static final Logger ApplicationLogger = Logger.getLogger(APP_LOGNAME);

public static final String FRAMEWORK_LOGNAME = "oracle.adfmf.framework";
public static final Logger FrameworkLogger = Logger.getLogger(FRAMEWORK_LOGNAME);
The logger that you are to use in your MAF application is the ApplicationLogger.
You can also use methods of the oracle.adfmf.util.logging.Trace class.
For more information, see Java API Reference for Oracle Mobile Application Framework.
31.4.1 How to Configure Logging Using the Properties File
This example shows the logging.properties file that you use to configure logging.
# default - all loggers to use the ConsoleHandler
.handlers=com.sun.util.logging.ConsoleHandler
# default - all loggers to use the SimpleFormatter
.formatter=com.sun.util.logging.SimpleFormatter

oracle.adfmf.util.logging.ConsoleHandler.formatter=
             oracle.adfmf.util.logging.PatternFormatter
oracle.adfmf.util.logging.PatternFormatter.pattern=
             [%LEVEL%-%LOGGER%-%CLASS%-%METHOD%]%MESSAGE%

#configure the framework logger to only use the adfmf ConsoleHandler
oracle.adfmf.framework.useParentHandlers=false
oracle.adfmf.framework.handlers=oracle.adfmf.util.logging.ConsoleHandler
oracle.adfmf.framework.level=SEVERE

#configure the application logger to only use the adfmf ConsoleHandler
oracle.adfmf.application.useParentHandlers=false
oracle.adfmf.application.handlers=oracle.adfmf.util.logging.ConsoleHandler
oracle.adfmf.application.level=SEVERE
The oracle.adfmf.util.logging.ConsoleHandler plays the role of the receiver of the custom formatter.
The oracle.adfmf.util.logging.PatternFormatter allows the following advanced formatting tokens that enable log messages to be printed:
-
%LEVEL%—the logging level. -
%LOGGER%—the name of the logger to which the output is being written. -
%CLASS%—the class that is being logged. -
%METHOD%—the method that is being logged. -
%TIME%—the time the logging message was sent. -
%MESSAGE%—the actual message.
The following logging levels are available:
-
SEVERE: this is a message level indicating a serious failure. -
WARNING: this is a message level indicating a potential problem. -
INFO: this is a message level for informational messages. -
FINE: this is a message level providing tracing information. -
FINER: this level indicates a fairly detailed tracing message. -
FINEST: this level indicates a highly detailed tracing message.
Caution:
When selecting the amount of verbosity for a logging level, keep in mind that by increasing the verbosity of the output at theSEVERE, WARNING, and INFO level negatively affects performance of your application.There are two consoles in OEPE available when running applications on devices: iOS Console and for each device (including emulator) additional console for Android. Both types of console can stream the logging and standard output, using two additional logging.properties file properties which allow you to filter the output to the OEPE console:
oepe.console.filter.android=<some string>
oepe.sonsole.filter.ios=<some string>
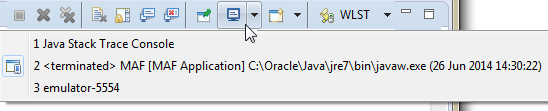
You switch from one console to another using the Display Selected Console button in the Console menubar. To cycle through the consoles available, click ![]() . Alternatively, click the down arrow next to the button and choose from the list, as shown in Section 31.4.1, "Choosing the Console.".
. Alternatively, click the down arrow next to the button and choose from the list, as shown in Section 31.4.1, "Choosing the Console.".
The logger defined in the logging.properties file matches the logger obtained from the oracle.adfmf.util.Utility class (see Section 31.4, "Using and Configuring Logging"). The logging levels also match. If you decide to use the logging level that is more fine-grained than INFO, you have to change the ConsoleHandler's logging level to the same level, as the example below shows.
oracle.adfmf.util.logging.ConsoleHandler.formatter=
             oracle.adfmf.util.logging.PatternFormatter
oracle.adfmf.util.logging.ConsoleHandler.level=FINEST
oracle.adfmf.util.logging.PatternFormatter.pattern=
             [%LEVEL%-%LOGGER%-%CLASS%-%METHOD%]%MESSAGE%
31.4.2 How to Use JavaScript Logging
JavaScript writes the output to the console.log or.error/.warn/.info. This output is redirected into the file through the System.out utility.
You customize the log output by supplying a message. The following JavaScript code produces "Message from JavaScript" output:
<script type="text/javascript" charset="utf-8">
   function test_function() { console.log("Message from JavaScript"); }
</script>
To make use of the properties defined in the logging file, you need to use the adf.mf.log package and the Application logger that it provides.
The following logging levels are available:
-
adf.mf.log.level.SEVERE -
adf.mf.log.level.WARNING -
adf.mf.log.level.INFO -
adf.mf.log.level.CONFIG -
adf.mf.log.level.FINE -
adf.mf.log.level.FINER -
adf.mf.log.level.FINEST
To trigger logging, use the adf.mf.log.Application logger's logp method and specify the following through the method's parameters:
-
the logging level
-
the current class name as a String
-
the current method as a String
-
the message string as a String
The example below shows how to use the logp method in a MAF application.
adf.mf.log.Application.logp(adf.mf.log.level.WARNING,
                            "myClass",
                            "myMethod",
                            "My Message");
Upon execution of the logp method, the following output is produced:
[WARNING - oracle.adfmf.application - myClass - myMethod] My Message
31.4.3 How to Use Embedded Logging
Embedded logging uses the com.sun.util.logging.Logger, as illustrated in the example below. Note that the EmbeddedClass represents a Java class defined in the project.
import com.sun.util.logging.Level;
import com.sun.util.logging.Logger;
import oracle.adfmf.util.logging.*;
...
   Utility.ApplicationLogger.logp(Level.WARNING,
                                  EmbeddedClass.class.getName(),
                                  "onTestMessage",
                                  "embedded warning message 1");
   Logger.getLogger(Utility.APP_LOGNAME).logp(Level.WARNING,
                    this.getClass().getName(),
                    "onTestMessage",
                    "embedded warning message 2");
   Logger.getLogger("oracle.adfmf.application").logp(Level.WARNING,
                                                this.getClass().getName(),
                                                "onTestMessage",
                                                "embedded warning message 3");
The preceding code produces the following output:
[WARNING - oracle.adfmf.application - EmbeddedClass - onTestMessage] embedded warning message 1
[WARNING - oracle.adfmf.application - EmbeddedClass - onTestMessage] embedded warning message 2
[WARNING - oracle.adfmf.application - EmbeddedClass - onTestMessage] embedded warning message 3
31.4.4 How to Use Xcode for Debugging and Logging on iOS Platform
Even though it is not recommended to manipulate your MAF projects with Xcode because you can lose some or all of your changes during the next deployment with OEPE, you may choose to do so in exceptional circumstances.
Deploy the application to the iOS simulator from OEPE.
To open the generated project directly in Xcode:
-
Navigate to the
workspace_directory\deploy\deployment profile name\temporary_xcode_project\. -
Open the Xcode project called
Oracle_ADFmc_Container_Template.xcodeproj.
If your development computer is running on Mac OS 10.8.n and you are debugging your MAF application using Xcode, you cannot see the Java output in the IDE (on either OEPE console or Xcode console). Instead, the output is redirected to a file (see Section 31.4, "Using and Configuring Logging"). By adding the following argument to your application's schema, you can disable this behavior and enable access to the Java, JavaScript, and Objective-C log output in Xcode in real time when debugging on either an iOS-powered device or its simulator:
-consoleRedirect=FALSE
31.4.5 How to Access the Application Log
Using the following APIs, you can access the application log information:
-
oracle.adfmf.framework.api.PerfMon -
oracle.adfmf.framework.api.LogEntry -
oracle.adfmf.util.HOTS
For more information, see Java API Reference for Oracle Mobile Application Framework.
31.4.6 How to Disable Logging
You can prevent the logging output from being directed to the application log file, in which case the log file either remains blank or is not created in the first place. When logging is disabled, trace statements are absent from the application log and any output directed to stderr and stdout is redirected to either a null location or other location that is not accessible to the end user.
To disable all logging, set the disableLogging property to true in the application's adf-config.xml file, as follows:
<adf-property name="disableLogging" value="true"/>
By default, logging is enabled in MAF applications and the disableLogging property is set to false.
For information on the adf-config.xml file, see Appendix C, "Introduction to MAF Application and Project Files."