30 Testing and Debugging MAF Applications
This chapter provides information on testing and debugging MAF applications.
This chapter includes the following sections:
-
Section 30.1, "Introduction to Testing and Debugging MAF Applications"
-
Section 30.3, "Configuring OEPE and MAF Applications to Debug Code"
-
Section 30.4, "Debugging MAF Applications Deployed on the Android Platform"
-
Section 30.5, "Debugging MAF Applications Deployed on the iOS Platform"
-
Section 30.6, "Using and Configuring Logging in MAF Applications"
-
Section 30.8, "Sending Diagnostic Information to Oracle Mobile Cloud Service"
-
Section 30.9, "Sending Analytics Information to Oracle Mobile Cloud Service"
30.1 Introduction to Testing and Debugging MAF Applications
To test or debug your MAF application, deploy it in debug mode to a device on one of the platforms (Android or iOS) that MAF supports. MAF and respective platform provides tools that let you connect the OEPE development environment with the MAF application executing on a device or a virtual device. For example, if you want to test your MAF application on an Android device, you deploy your MAF application in debug mode from OEPE to an Android device or to an Android Virtual Device (AVD). iOS provides similar tools.
Note:
Debugging is not available for MAF applications developed for Universal Windows Platform.The high-level steps to debug a MAF application include the following tasks:
-
Use a debug configuration to deploy the MAF application to the test environment so that it deploys the MAF application in debug mode.
-
Deploy the MAF application to the test environment.
-
Use the appropriate tools for the debugging task that you want to complete. If, for example, you want to debug Java code in your MAF application, use the tools that OEPE provides. If you want to debug the code that renders the user interface (HTML, CSS, or JavaScript) of your MAF application, use the tools that each platform provides for this task.
MAF provides other features to assist testing your application. These include the ability to monitor your application's performance, plus send analytics and diagnostic information to Oracle Mobile Cloud service (if your application accesses resources from that service).
30.2 Testing MAF Applications
There are two approaches to testing a MAF application:
-
Testing on a mobile device: this method always provides the most accurate behavior, and is also necessary to gauge the performance of your application. However, you may not have access to all the devices on which you want to test, making device testing inconclusive.
-
Testing on a mobile device emulator or simulator: this method usually offers better performance and faster deployment, as well as convenience. However, even though a device emulator or simulator closely approximates the corresponding physical device, there might be differences in behavior and limitations on the capabilities that can be emulated.
Typically, a combination of both approaches yields the best results.
30.2.1 How to Perform Accessibility Testing on iOS-Powered Devices
You should use a combination of the following methods to test the accessibility of your MAF application developed for iOS-powered devices:
-
Testing with the Accessibility Inspector on an iOS-powered device simulator.
For detailed information, see the "Testing the Accessibility of Your iPhone Application" section in the Accessibility Programming Guide for iOS available through the iOS Developer Library.
-
Testing with the VoiceOver on an iOS-powered device.
For more information, see the "Using VoiceOver to Test Your Application" section in the Accessibility Programming Guide for iOS available through the iOS Developer Library.
30.3 Configuring OEPE and MAF Applications to Debug Code
OEPE is equipped with debugging mechanisms that allow you to execute a Java program in debug mode and use standard breakpoints to monitor and control execution of an application.
Since a MAF application cannot be run inside OEPE, the debugging approach is different: you can use the OEPE debugger to connect to a Java Virtual Machine instance on a mobile device or simulator and control the Java portions of your deployed MAF application.
MAF automatically configures the project properties for debugging (see Section 30.3.1, "What You May Need to Know About the Debugging Configuration"). The following are the steps you need to take to use OEPE to debug the Java code in your MAF application:
To test or debug an application:
-
From OEPE's main menu, click Run > Debug Configuration to select a debug configuration.
-
Click Debug to run the application with debugging enabled.
For additional information, see the following:
30.3.1 What You May Need to Know About the Debugging Configuration
When you create a new MAF debug configuration, OEPE automatically configures the application for debugging. These debug configurations allow you to debug a MAF application by clicking the OEPE Debug button in the configuration. Once the application has been deployed, it automatically starts with the debugger.
For information on how to create and edit run configurations, see Section 30.3.1.1, "Creating and Configuring a Debug Configuration."
30.3.1.1 Creating and Configuring a Debug Configuration
To create a new configuration or to modify an existing one, complete the Debug Configuration dialog as follows:
-
From OEPE's main menu, click Run > Debug Configurations to open the Debug Configuration dialog.
-
Create a new debug configuration by right-clicking MAF Application and choosing New.
-
Complete the Main tab of the dialog as follows:
-
For Android, follow the steps in Section 27.3.1, "How to Create an Android Deployment Configuration"
-
For iOS, follow the steps in Section 27.4.1, "How to Create an iOS Deployment Configuration"
-
-
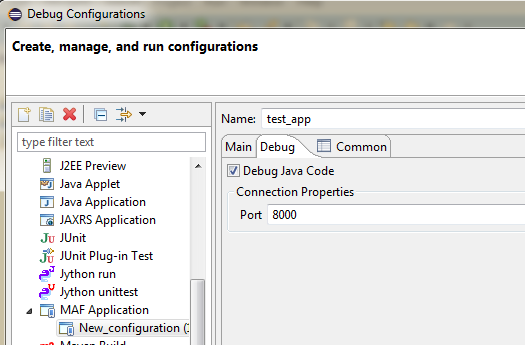
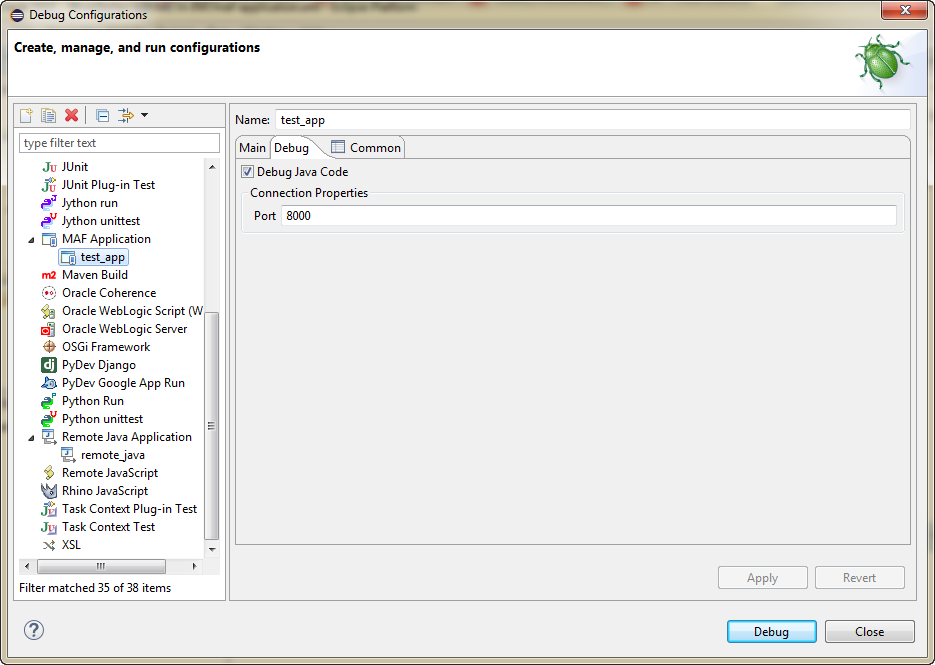
In the Debug tab, select Debug Java Code and set the port to the appropriate port number, as shown in Figure 30-1.
Note:
To avoid timeout, start the debugger soon after launching the application on the mobile device or simulator.If the deployment is successful, and the application on the device is started in debug mode, it will block until remote debugging is connected. The timeout is usually a few minutes.
On Android
-
Ensure that port forwarding is established
On iOS
-
Ensure that your development computer and mobile device are visible to each other through TCP (they can ping each other).
-
Modify the Host field of the Remote Java Application configuration by replacing the localhost with the IP address of the mobile device.
For additional information, see Section 30.3.1, "What You May Need to Know About the Debugging Configuration"
30.3.2 How to Enable Debugging of Java Code and JavaScript
You use the application's deployment configuration to specify either the release or debug execution mode for your MAF application. Only the debug mode enables you to interactively debug Java and JavaScript code. The debug mode allows for inclusion of special debugging libraries and symbols at compile time.
Figure 30-2 shows how to set the debug mode option.
For more information, see the following:
-
Section 27.3.1, "How to Create an Android Deployment Configuration"
-
Section 27.4.1, "How to Create an iOS Deployment Configuration"
A maf.properties file allows you to specify startup parameters for the JVM and web views of MAF to enable debugging of the Java code and JavaScript. The maf.properties file is automatically created and placed in the {assembly_project}/META-INF directory (see Section 30.6, "Using and Configuring Logging in MAF Applications"), which corresponds to the <application_name>/META-INF location in your application file system.
You can use the following debugging properties in the maf.properties file:
-
java.debug.enabled: Enables or disables Java debugging for MAF. Valid values aretrueandfalse.Caution:
Whenjava.debug.enabledis set totrue, the JVM waits for a debugger to establish a connection to it. Failure of the debugger to connect will result in the failure of the MAF AMX application feature to load. -
java.debug.port: Specifies the port to be used during debugging. The valid value is an integer. -
javascript.debug.enabled: Enables or disables JavaScript debugging when the application is running in the device simulator. Valid values aretrueandfalse. -
javascript.debug.feature: Specifies the application feature that is to trigger the activation of JavaScript debugging in MAF. The format of the value isfeatureId:port. The port must be specified (it is initially set to a placeholder value).
Note:
Thejavascript.debug.enabled and javascript.debug.feature settings are only valid on iOS and Safari versions earlier than 6.0.
If both iOS and Safari versions are later than 6.0, then neither of these two properties should be specified. Instead, follow the instructions from Section 30.3.2.1, "What You May Need to Know About Debugging of JavaScript Using an iOS-Powered Device Simulator on iOS 6 Platform."
The contents of the maf.properties file may be similar to the following:
java.debug.enabled=true
java.debug.port=8000

javascript.debug.enabled=true
javascript.debug.feature=products:8888
After the maf.properties file has been configured to debug JavaScript, you can navigate to the following URL to see a listing of all the loaded pages that can be debugged in MAF:
http://localhost:9999
For information on how to use OEPE to debug the Java code, see Section 30.3, "Configuring OEPE and MAF Applications to Debug Code."
30.3.2.1 What You May Need to Know About Debugging of JavaScript Using an iOS-Powered Device Simulator on iOS 6 Platform
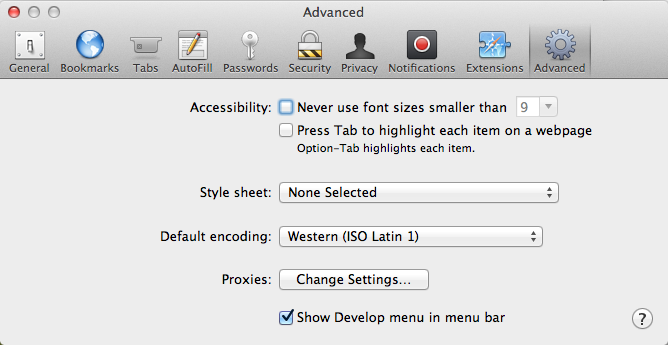
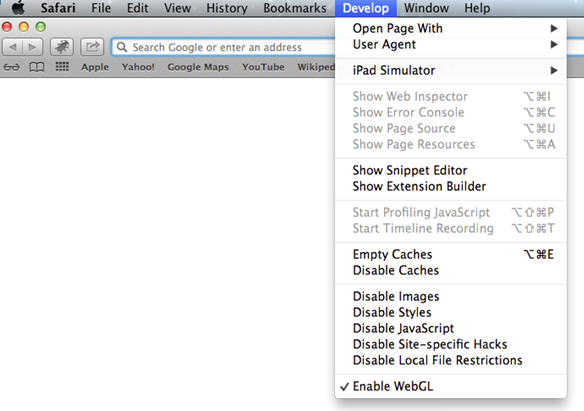
If you are working with the iOS 6 platform, you can use the Safari 6 browser to debug JavaScript. To do so, open the Safari preferences, select Advanced, and then enable the Develop menu in the browser by selecting Show Develop menu in menu bar, as shown in Figure 30-3.
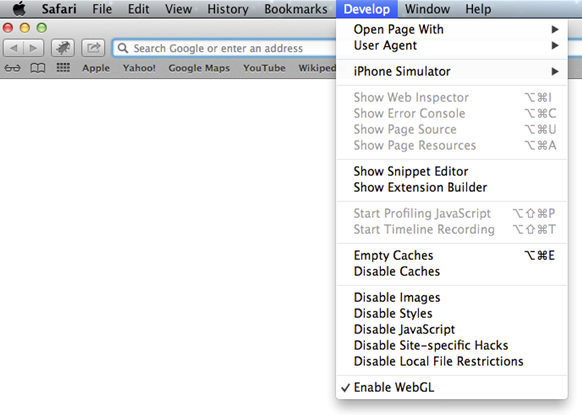
When the Develop menu is enabled, select either iPhone Simulator or iPad Simulator, as Figure 30-4 and Figure 30-5 show, and then select a UIWebView that you are planning to debug. Whether the Develop menu displays an iPhone Simulator or iPad Simulator option depends on which device simulator is launched.
30.3.3 How to Debug the MAF AMX Content
If your MAF application includes the MAF AMX content, after you configure the device or emulator, you can set breakpoints, view the contents of variables, and inspect the method call stack just as you would when debugging other types of applications in OEPE.
Note:
You can only debug your Java code and JavaScript (see Section 30.3.2, "How to Enable Debugging of Java Code and JavaScript"). Debugging of EL expressions or other declarative elements is not supported.30.4 Debugging MAF Applications Deployed on the Android Platform
To debug a MAF application on the Android platform using OEPE, follow the generic debugging procedure described in Section 30.3, "Configuring OEPE and MAF Applications to Debug Code."
To debug Java code, you must create a debug configuration and configure the debug mode in it. For more information about these tasks, see Section 30.3.2, "How to Enable Debugging of Java Code and JavaScript" and Section 30.3, "Configuring OEPE and MAF Applications to Debug Code." Once you complete these tasks, you can deploy your MAF application in debug mode to debug your Java code, as described in Section 30.4.1, "How to Debug Java Code on the Android Platform"
To debug UI code (JavaScript, HTML, and CSS), you configure the debug mode in your debug configuration. Once you complete this task, you can debug your UI code, as described in Section 30.4.2, "How to Debug UI Code on the Android Platform"
30.4.1 How to Debug Java Code on the Android Platform
To debug a MAF application's Java code on the Android platform using OEPE, follow the debugging procedure described in Section 30.3, "Configuring OEPE and MAF Applications to Debug Code."
For information on how to configure an Android-powered device or emulator and how to deploy a MAF application for debugging, see Section 27.3.2, "How to Deploy an Android Application to an Android Emulator."
To allow debugging of a MAF application running on an Android-powered device or its emulator, verify that the Network Information plugin is enabled, as described in Introduction to Chapter 9, "Using Plugins in MAF Applications".
30.4.1.1 Troubleshooting adb
When you debug Java code, either on an Android-powered device connected through USB or on an Android-powered device emulator, the final step of deployment automatically executes port forwarding. This is the same as if you executed the following command on a terminal:
-
For the device debugging:
adb -d forward tcp:8000tcp:8000 -
For the emulator debugging:
adb -e forward tcp:8000 tcp:8000
Sometimes the adb process freezes and you need to kill the process and restart it.
To kill the process, use:
-
Mac terminal: use the
kill -9procIDcommand
Restart the adb daemon by executing the following command on a terminal:
adb devices
A deployment that succeeded before adb froze will still be deployed. To debug an application, redeploy it.
30.4.2 How to Debug UI Code on the Android Platform
When developing a MAF application, you may need to debug code that renders the user interface (UI) of your application on an Android device. The code that renders the UI can include JavaScript, HTML, and CSS. You can debug this code using Google's Chrome DevTools when you deploy the MAF application from your development machine to the Android device. Figure 30-6 shows the Chrome DevTools inspecting an AMX page from a MAF application.
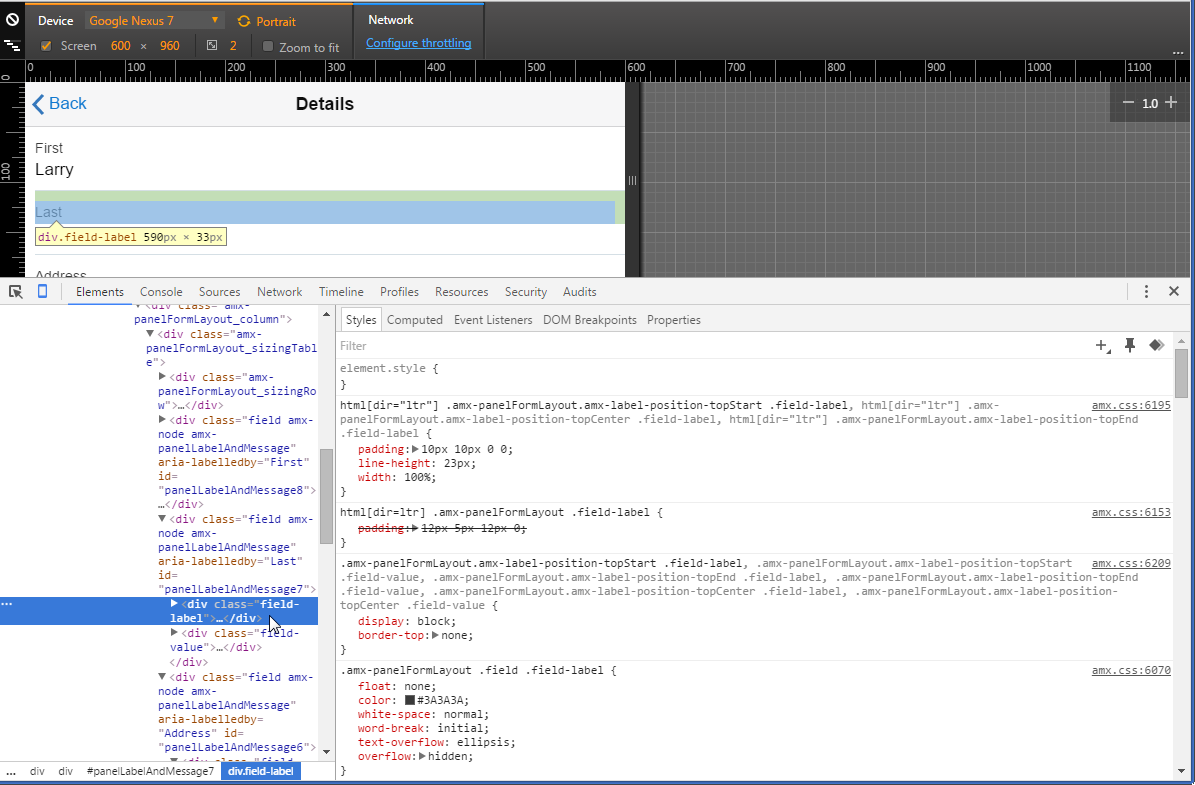
For more information on the Chrome DevTools, including the requirements to use it, see Remote Debugging on Android with Chrome DevTools on the Google Developers' site.
See also the ”Debugging HTML in Oracle MAF Applications on Android” video on the Oracle Mobile Platform YouTube channel for an overview of how to debug UI code on Android. Note that the latter video makes reference to a cvm.properties file. This file has been renamed to maf.properties.
To deploy a MAF application to an Android device to debug its UI code, you need to:
-
Configure the
maf.propertiesfile to include the following entry:javascript.debug.enabled=trueFor more information on the maf.properties file, see Section 30.3.2, "How to Enable Debugging of Java Code and JavaScript."
-
Deploy in debug mode. For more information, see Chapter 27, "Deploying MAF Applications."
30.5 Debugging MAF Applications Deployed on the iOS Platform
Before you can debug Java code, you must create a debug configuration and configure the debug mode in it. For more information about these tasks, see Section 30.3.2, "How to Enable Debugging of Java Code and JavaScript" and Section 30.3, "Configuring OEPE and MAF Applications to Debug Code.". Once you complete these tasks, you can deploy your application in debug mode to the iOS device and debug your Java code. For more information about how to deploy in debug mode, see Section 30.5.1, "How to Debug Java Code on the iOS Platform."
To debug UI code (JavaScript, HTML, and CSS), you configure the debug mode in the debug configuration. Once you complete this task, you can debug your UI code, as described in Section 30.5.2, "How to Debug UI Code on the iOS Platform."
30.5.1 How to Debug Java Code on the iOS Platform
To debug a MAF application's Java code on the iOS platform using OEPE, follow the debugging procedure described in Section 30.3, "Configuring OEPE and MAF Applications to Debug Code.".
30.5.2 How to Debug UI Code on the iOS Platform
If you are working with the iOS platform, you can use the Safari browser to debug JavaScript. To do so, open the Safari preferences, select Advanced, and then enable the Develop menu in the browser by selecting Show Develop menu in menu bar.
When the Develop menu is enabled, select either iPhone Simulator or iPad Simulator, as Figure 30-3 and Figure 30-4 show, and then select a UIWebView that you are planning to debug, as Figure 30-5 shows.
Note:
Whether the Develop menu displays an iPhone Simulator or iPad Simulator option depends on which device simulator is launched.Use the featureContentDelay additional build argument to record log messages and errors from your custom JavaScript before the first page from your application loads. This argument specifies a delay before the WebView is populated with content. Set the additional build argument -featureContentDelay to 20.
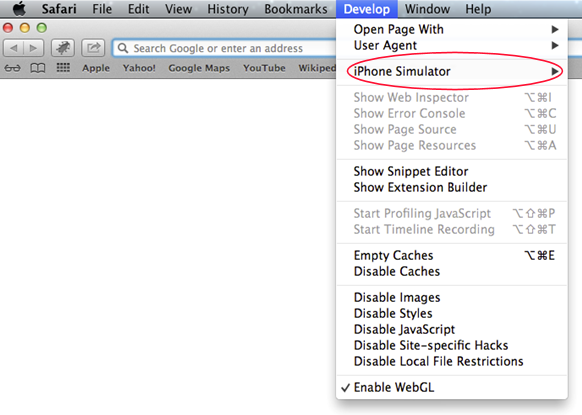
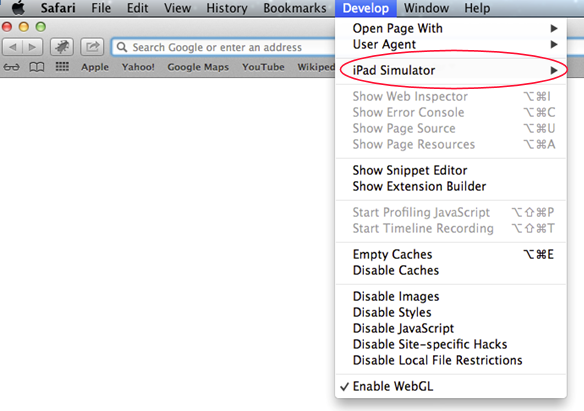
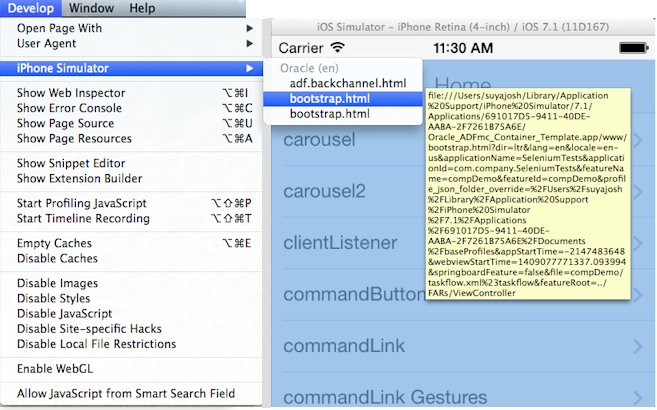
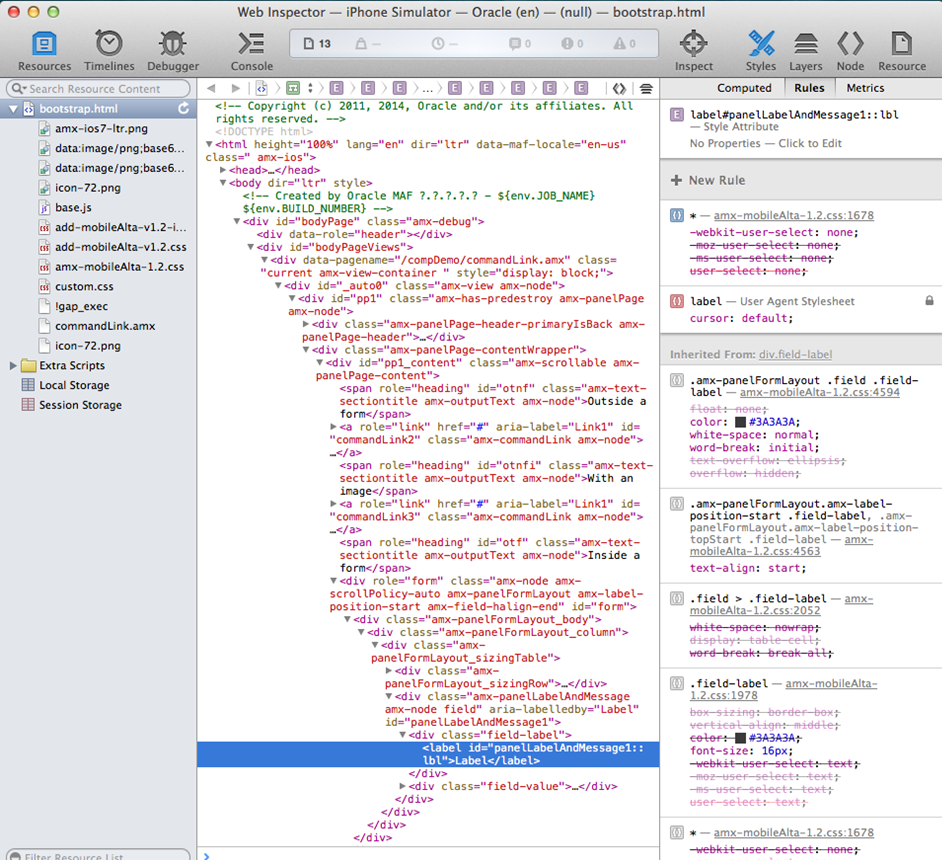
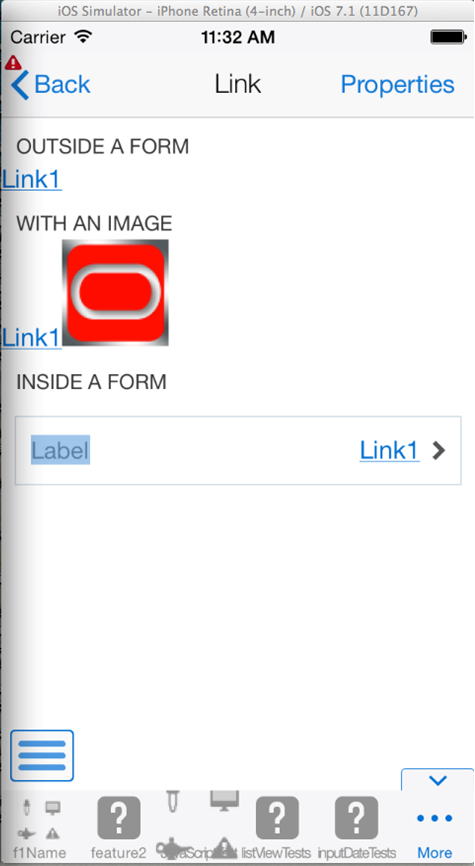
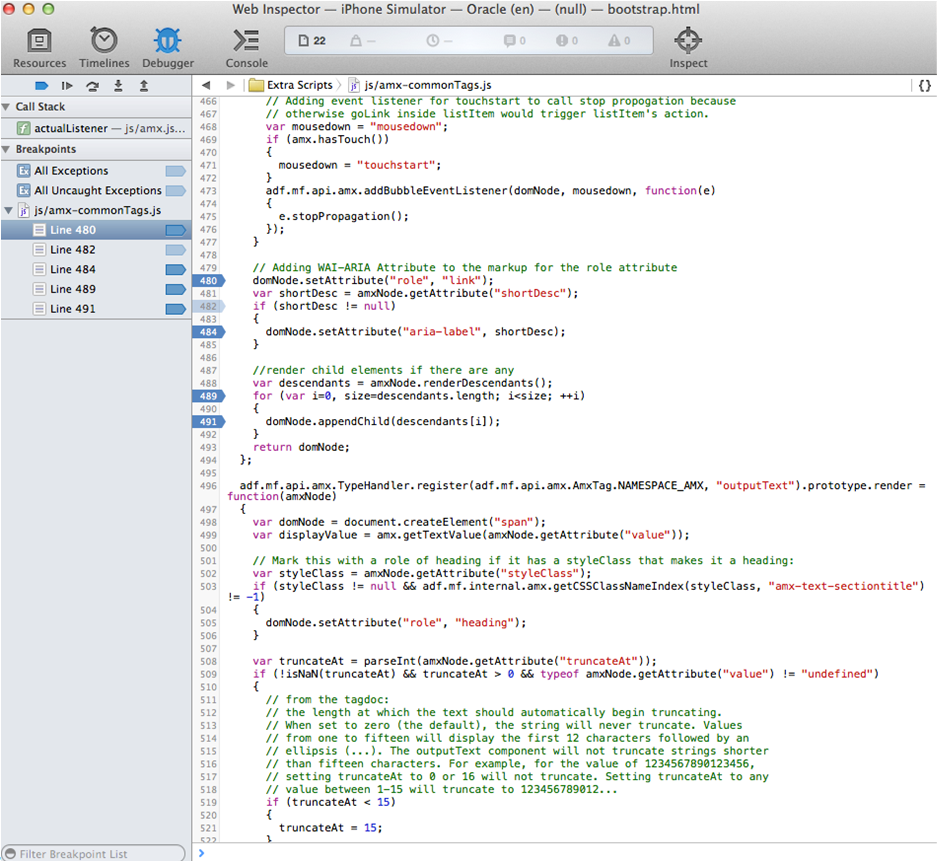
Figure 30-11 and Figure 30-12 show JavaScript debugging using breakpoints inside the Safari browser.
30.6 Using and Configuring Logging in MAF Applications
For your MAF application, you can enable logging on all supported platforms through JavaScript (see Section 30.6.2, "How to Use JavaScript Logging") and embedded code (see Section 30.6.3, "How to Use Embedded Logging") using a single configuration with the log output directed to a single file. This log output includes the output produced by System.out.println and System.err.println statements.
The default MAF's logging process is as follows:
-
The logging begins at application startup.
-
The existing log file from the previous application run is deleted, so only the contents of the current run are available.
-
When you are running your application on an iOS-powered device simulator, all logging output is typically sent to the console which you can access through the
Application/Utilitiesdirectory on your development computer. However, if your development computer is running on Mac OS 10.8.n, you can only access the Java logging output through a file of whose name and location you are notified as soon as the output redirection occurs and the file is generated. One of the possible locations for this file is/Users/<userid>/Library/Application Support/iPhone Simulator/6.0/Applications/<AppID>/Documents/logs/application.logWhen you are running your application on an iOS-powered device, the console output is redirected to an
application.logfile that is placed in theDocuments/logsdirectory of your application.On Android, the output is forwarded to a text file with the same name as the application. The output file location is
/sdcard. If this location is not present or is configured as read-only, the log output is rerouted to the application's writable data directory. -
The
logging.propertiesfile is automatically created and placed in the<assembly project>/META-INFlocation in your application file system (see Section 30.6, "Using and Configuring Logging in MAF Applications"). In this file, it is defined that all loggers use thecom.sun.util.logging.ConsoleHandlerandSimpleFormatter, and the log level is set toSEVERE. You can edit this file to specify different logging behavior (see Section 30.6.1, "How to Configure Logging Using the Properties File").Note:
In your MAF application, you cannot use loggers from thejava.util.loggingpackage.MAF loggers are declared in the
oracle.adfmf.util.Utilityclass as follows:public static final String APP_LOGNAME = "oracle.adfmf.application"; public static final Logger ApplicationLogger = Logger.getLogger(APP_LOGNAME); public static final String FRAMEWORK_LOGNAME = "oracle.adfmf.framework"; public static final Logger FrameworkLogger = Logger.getLogger(FRAMEWORK_LOGNAME);
The logger that you are to use in your MAF application is the
ApplicationLogger.You can also use methods of the
oracle.adfmf.util.logging.Traceclass.For more information, see Java API Reference for Oracle Mobile Application Framework.
When you are running your application on an iOS-powered device, the console output is redirected to an application.log file that is placed in the
Documents/logsdirectory of your application. You can access this directory as follows on your iOS-powered device:-
Navigate to Xcode > Devices.
-
Select the application from the list in the Installed Apps section.
-
Click the gear icon.
-
Select Download Container.
-
Right-click the downloaded
*.xcappdatafile and select Show Package Contents. -
Open AppData > Documents > Logs.
-
Right-click the downloaded
*.xcappdatafile and select Show Package Contents.
On Android, the output is forwarded to a text file with the same name as the application. The output file location is
/sdcard. If this location is not present or is configured as read-only, the log output is rerouted to the application's writable data directory. The contents of the log file is replicated in the Android Logcat utility (seehttp://developer.android.com/tools/debugging/debugging-log.html). OEPE displays the logging output from the Logcat when you use OEPE to deploy your MAF application to an Android-powered device or emulator.For both iOS and Android, the logging output appears in OEPE's log window immediately after the deployment. If you use a Run/Debug configuration to build, deploy, and launch the MAF application, the Terminate button in the toolbar terminates the MAF application along with the process that performs the log redirection.
-
-
The
logging.propertiesfile is automatically created and placed in theMETA-INFdirectory under the assembly project which corresponds to the<application_name>/META-INFlocation in your application file system. In this file, it is defined that all loggers use thejava.util.logging.ConsoleHandlerandSimpleFormatter, and the log level is set toSEVERE. You can edit this file to specify different logging behavior (see Section 30.6.1, "How to Configure Logging Using the Properties File").Note:
In your MAF application, you cannot use loggers from the java.util.logging package.
MAF loggers are declared in the oracle.adfmf.util.Utility class as follows:
public static final String APP_LOGNAME = "oracle.adfmf.application";
public static final Logger ApplicationLogger = Logger.getLogger(APP_LOGNAME);

public static final String FRAMEWORK_LOGNAME = "oracle.adfmf.framework";
public static final Logger FrameworkLogger = Logger.getLogger(FRAMEWORK_LOGNAME);
You can also use methods of the oracle.adfmf.util.logging.Trace class.
For more information, see Java API Reference for Oracle Mobile Application Framework.
30.6.1 How to Configure Logging Using the Properties File
This example shows the logging.properties file that you use to configure logging.
# default - all loggers to use the ConsoleHandler
.handlers=com.sun.util.logging.ConsoleHandler
# default - all loggers to use the SimpleFormatter
.formatter=com.sun.util.logging.SimpleFormatter

oracle.adfmf.util.logging.ConsoleHandler.formatter=
             oracle.adfmf.util.logging.PatternFormatter
oracle.adfmf.util.logging.PatternFormatter.pattern=
             [%LEVEL%-%LOGGER%-%CLASS%-%METHOD%]%MESSAGE%

#configure the framework logger to only use the adfmf ConsoleHandler
oracle.adfmf.framework.useParentHandlers=false
oracle.adfmf.framework.handlers=oracle.adfmf.util.logging.ConsoleHandler
oracle.adfmf.framework.level=SEVERE

#configure the application logger to only use the adfmf ConsoleHandler
oracle.adfmf.application.useParentHandlers=false
oracle.adfmf.application.handlers=oracle.adfmf.util.logging.ConsoleHandler
oracle.adfmf.application.level=SEVERE
The oracle.adfmf.util.logging.ConsoleHandler plays the role of the receiver of the custom formatter.
The oracle.adfmf.util.logging.PatternFormatter allows the following advanced formatting tokens that enable log messages to be printed:
-
%LEVEL%—the logging level. -
%LOGGER%—the name of the logger to which the output is being written. -
%CLASS%—the class that is being logged. -
%METHOD%—the method that is being logged. -
%TIME%—the time the logging message was sent. -
%MESSAGE%—the actual message.
The following logging levels are available:
-
SEVERE: this is a message level indicating a serious failure. -
WARNING: this is a message level indicating a potential problem. -
INFO: this is a message level for informational messages. -
FINE: this is a message level providing tracing information. -
FINER: this level indicates a fairly detailed tracing message. -
FINEST: this level indicates a highly detailed tracing message.
Caution:
When selecting the amount of verbosity for a logging level, keep in mind that by increasing the verbosity of the output at theSEVERE, WARNING, and INFO level negatively affects performance of your application.There are two consoles in OEPE available when running applications on devices: iOS Console and for each device (including emulator) additional console for Android. Both types of console can stream the logging and standard output, using two additional logging.properties file properties which allow you to filter the output to the OEPE console:
oepe.console.filter.android=<some string>
oepe.sonsole.filter.ios=<some string>
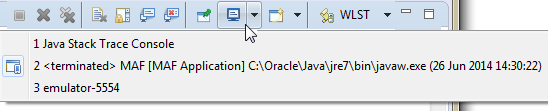
You switch from one console to another using the Display Selected Console button in the Console menubar. To cycle through the consoles available, click ![]() . Alternatively, click the down arrow next to the button and choose from the list, as shown in Section 30.6.1, "Choosing the Console.".
. Alternatively, click the down arrow next to the button and choose from the list, as shown in Section 30.6.1, "Choosing the Console.".
The logger defined in the logging.properties file matches the logger obtained from the oracle.adfmf.util.Utility class (see Section 30.6, "Using and Configuring Logging in MAF Applications"). The logging levels also match. If you decide to use the logging level that is more fine-grained than INFO, you have to change the ConsoleHandler's logging level to the same level, as the example below shows.
oracle.adfmf.util.logging.ConsoleHandler.formatter=
             oracle.adfmf.util.logging.PatternFormatter
oracle.adfmf.util.logging.ConsoleHandler.level=FINEST
oracle.adfmf.util.logging.PatternFormatter.pattern=
             [%LEVEL%-%LOGGER%-%CLASS%-%METHOD%]%MESSAGE%
30.6.2 How to Use JavaScript Logging
JavaScript writes the output to the console.log or.error/.warn/.info. This output is redirected into the file through the System.out utility.
You customize the log output by supplying a message. The following JavaScript code produces "Message from JavaScript" output:
<script type="text/javascript" charset="utf-8">
   function test_function() { console.log("Message from JavaScript"); }
</script>
To make use of the properties defined in the logging file, you need to use the adf.mf.log package and the Application logger that it provides.
The following logging levels are available:
-
adf.mf.log.level.SEVERE -
adf.mf.log.level.WARNING -
adf.mf.log.level.INFO -
adf.mf.log.level.CONFIG -
adf.mf.log.level.FINE -
adf.mf.log.level.FINER -
adf.mf.log.level.FINEST
To trigger logging, use the adf.mf.log.Application logger's logp method and specify the following through the method's parameters:
-
the logging level
-
the current class name as a String
-
the current method as a String
-
the message string as a String
The example below shows how to use the logp method in a MAF application.
adf.mf.log.Application.logp(adf.mf.log.level.WARNING,
                            "myClass",
                            "myMethod",
                            "My Message");
Upon execution of the logp method, the following output is produced:
[WARNING - oracle.adfmf.application - myClass - myMethod] My Message
For more information, see Oracle Fusion Middleware Securing Applications with Oracle Platform Security Services.
30.6.3 How to Use Embedded Logging
Embedded logging uses the com.sun.util.logging.Logger, as illustrated in the example below. Note that the EmbeddedClass represents a Java class defined in the project.
import com.sun.util.logging.Level;
import com.sun.util.logging.Logger;
import oracle.adfmf.util.logging.*;
...
   Utility.ApplicationLogger.logp(Level.WARNING,
                                  EmbeddedClass.class.getName(),
                                  "onTestMessage",
                                  "embedded warning message 1");
   Logger.getLogger(Utility.APP_LOGNAME).logp(Level.WARNING,
                    this.getClass().getName(),
                    "onTestMessage",
                    "embedded warning message 2");
   Logger.getLogger("oracle.adfmf.application").logp(Level.WARNING,
                                                this.getClass().getName(),
                                                "onTestMessage",
                                                "embedded warning message 3");
The preceding code produces the following output:
[WARNING - oracle.adfmf.application - EmbeddedClass - onTestMessage] embedded warning message 1
[WARNING - oracle.adfmf.application - EmbeddedClass - onTestMessage] embedded warning message 2
[WARNING - oracle.adfmf.application - EmbeddedClass - onTestMessage] embedded warning message 3
30.6.4 How to Use Xcode for Debugging and Logging on iOS Platform
Even though it is not recommended to manipulate your MAF projects with Xcode because you can lose some or all of your changes during the next deployment with OEPE, you may choose to do so in exceptional circumstances.
Deploy the application to the iOS simulator from OEPE.
To open the generated project directly in Xcode:
-
Navigate to the
workspace_directory\deploy\deployment profile name\temporary_xcode_project\. -
Open the Xcode project called
Oracle_ADFmc_Container_Template.xcodeproj.
If you are debugging your MAF application using Xcode, you cannot see the Java output in the IDE (on neither OEPE console nor Xcode console). Instead, the output is redirected to a file (see Section 30.6, "Using and Configuring Logging in MAF Applications"). By adding the following argument to your application's schema, you can disable this behavior and enable access to the Java, JavaScript, and Objective-C log output in Xcode in real time when debugging on either an iOS-powered device or simulator:
-consoleRedirect=FALSE
30.6.5 How to Access the Application Log
Using the following APIs, you can access the application log information:
-
oracle.adfmf.framework.api.PerfMon -
oracle.adfmf.framework.api.LogEntry -
oracle.adfmf.util.HOTS
For more information, see Java API Reference for Oracle Mobile Application Framework.
30.6.6 How to Disable Logging
You can prevent the logging output from being directed to the application log file, in which case the log file either remains blank or is not created in the first place. When logging is disabled, trace statements are absent from the application log and any output directed to stderr and stdout is redirected to either a null location or other location that is not accessible to the end user.
To disable all logging, set the disableLogging property to true in the application's adf-config.xml file, as follows:
<adf-property name="disableLogging" value="true"/>
By default, logging is enabled in MAF applications and the disableLogging property is set to false.
For information on the adf-config.xml file, see Appendix C, "Introduction to MAF Application and Project Files."
30.7 Measuring MAF Application Performance
MAF assists you in monitoring and measuring the performance of your MAF application. You can, for example, measure the time it takes for the following events in your application to complete:
-
An action that a button invokes to complete
-
A page to load
-
A REST call to return a response
In addition, you can print statistics that show the mean and standard deviation time of operations that you monitor in your MAF application.
You enable performance measurement by configuring logging levels for the following performance loggers in your application's logging.properties file. The values assigned to the loggers in the following example are for illustrative purposes. See Table 30-1 for descriptions of all possible values.
oracle.adfmf.amx.useParentHandlers=false
oracle.adfmf.amx.handlers=oracle.adfmf.util.logging.ConsoleHandler
oracle.adfmf.amx.level=SEVERE

# used to control what monitors are captured in the list of monitors
oracle.maf.performance.monitor.captured.level = FINEST

# used to control what monitors are reported in the dumpStatistics
oracle.maf.performance.monitor.reported.useParentHandlers=false
oracle.maf.performance.monitor.reported.handlers=oracle.adfmf.util.logging.ConsoleHandler
oracle.maf.performance.monitor.reported.level = FINEST

# used to control what monitor observations (start/stop times) are logged.
oracle.maf.performance.monitor.observations.reported=false
oracle.maf.performance.monitor.observations.reported.handlers=oracle.adfmf.util.logging.ConsoleHandler
oracle.maf.performance.monitor.observations.reported.level = FINEST
Once performance measurement completes, you can review the data that MAF collected while it measured the performance of your application. The following example shows an extract of the output that MAF produces after it monitors performance. In the example, the monitor observed 5 occurrences of a Process AMX event that had a mean completion time of 1435.5 milliseconds with a standard deviation of 1990.567….
INFO - oracle.maf.performance.monitor.reported - MonitorFactory - dumpStatistics]
PERFMON-JAVA STATS: Monitor 'com.company.WorkBetter.**Perf_Monitor**.Springboard.Container.Process AMX event' description:
'Time to process event'  observations: 5  mean: 1435.4 standard deviation: 1990.5674567821106
Table 30-1 describes the available performance monitor levels that you can set in the logging.properties file.
Table 30-1 Performance Monitor Levels
| Level | Description |
|---|---|
|
|
This is the coarsest monitor level. It monitors events and actions. Using this level, you can, for example, monitor the loading of a page or the completion of an end user action, such as a button click. Use of this monitor level has minimal impact on performance. |
|
|
This level monitors more performance indicators that it orders into the following categories:
Use of this monitor level impacts the performance of your application and should not be enabled by default. Consider using this level to gain insight into how your code executes with a view to restructuring or refining your application. |
|
|
Use to monitor significant performance issues, such as how it long it takes to process nodes in an AMX page, data change events or EL expressions. |
|
|
Use this monitor level to debug the performance of your application. |
The monitor level that you specify in logging.properites takes effect when you first start the application.
Note:
MAF provides a number of setPerformanceMonitor methods in the oracle.adfmf.framework.api package's PerfMon class that enable you to change the performance monitor level at runtime. For more information, see the Java API Reference for Oracle Mobile Application Framework.In addition to specifying a monitor level in the logging.properties file, you can add monitors to your application to collect the performance data. MAF uses the Java class, oracle.adfmf.performance.Monitor (monitor), to collect performance data. A monitor is a stop watch that can be started, stopped and can add observations. By adding observations, you can use monitors to gain insights, such as the standard deviation for a given measurement. Each monitor has a unique ID and an optional description.
Monitor exposes a number of addObservation() methods that enable a monitor to measure the duration of an event or the number of occurrences of an event. When measuring duration, start the monitor before the event. After the event occurs, invoke an addObservation() method from the monitor. This stops the monitor. Duration is the time between the start() and the addObservation() method. You can restart a monitor that was never stopped. As you might expect, you cannot stop a monitor that was never started. An attempt to stop such a monitor logs an error.
A monitor that measures the number of occurrences of an event does not need to be started or stopped. Use the addObservation(double duration) method that does not stop the monitor, as demonstrated in the following example that counts the number of occurrences of JSON serialization in the application where you monitor performance. The duration parameter specifies the time since the monitor last added an observation.
The following example demonstrates how you create a monitor to measure the duration of an event. The example also shows a sample of the statistical information that this monitor produces.
import oracle.adfmf.performance.Monitor;
....

 public void measurePerformance()
  {
    Monitor monitor = null;

    try
    {
      //// Check that the appropriate monitor level is set before you create the monitor
      if (Utility.PerformanceMonitorCaptured.isLoggable(Level.INFO))
      {
        monitor = MonitorFactory.getInstance().getMonitor("REST call", Level.INFO, "REST call timing");
        monitor.start();
      }

      //
      // Perform your custom logic here:
      //
    }
    finally
    {
      if (monitor != null)
      {
        monitor.addObservation();
      }
    }
  }

  public void countCalls()
  {
    Monitor monitor = null;

    try
    {
      if (Utility.PerformanceMonitorCaptured.isLoggable(Level.FINE))
      {
        monitor = MonitorFactory.getInstance().getMonitor("Call count", Level.FINE, "Count number of calls");
        monitor.start();
      }

      //
      // Perform your custom logic here:
      //
    }
    finally
    {
      if (monitor != null)
      {
        monitor.addObservation(1);
      }
    }
  }
To create a monitor that collects performance data in your application, you configure the logging.properties file to enable the performance monitor capture level to collect the data. In the example aboves, MAF will not collect performance data for the monitor if the application's logging.properties file does not contain the following entry:
# used to control what monitors are captured in the list of monitorsoracle.maf.performance.monitor.captured.level = FINEST
For more information about monitor (oracle.adfmf.performance.Monitor), see Java API Reference for Oracle Mobile Application Framework.
In addition to monitor, MAF also provides oracle.adfmf.performance.Story (story). A story allows you to start and end the collection of performance data. Once you end collection of the performance data for a story, MAF presents a hierarchical view of the collected performance data using a story ID that you assigned when you started the story. The hierarchical view shows the individual timing measurements for events that took place during the story. In addition, MAF performs a health of the system (HOTS) checkpoint at the end of the story. As part of this HOTS checkpoint, standard deviations for all of the monitor data collected during the story will be computed, so you can gain insight into how individual story events measure up statistically. All monitor data will then be cleared from the MonitorFactory.
Note:
You can perform a HOTS checkpoint independently of a story by invoking the oracle.adfmf.util.HOTS.checkpoint() method. This determines information for your application, such as total memory used by the JVM, free memory, used memory (total minus free), and the number of active features. The following shows a sample of the data returned bycheckpoint():
HOTS.memory.used (N/A) count: 1.0335056E7
HOTS.memory.free (N/A) count: 1.365112E7
HOTS.memory.total (N/A) count: 2.3986176E7
HOTS.memory.max (N/A) count: 4.9152E7
HOTS.threads.active (N/A) count: 20.0
HOTS.features.active (N/A) count: 6.0
The following example shows a managed bean that exposes methods to start a story with a story ID (**Perf_Monitor**) and stop the story. This story could be started and ended from a button in the UI of the application that you want to measure the performance. For example, you may want to measure the loading of a page, so you expose a UI button that enables you to start the story prior to navigating to the page and another button that ends the story once the page loads.
package mobile;

import oracle.adfmf.amx.event.ActionEvent;
import oracle.adfmf.performance.Story;

public class PerfBean
{
  public PerfBean()
  {
    super();
  }
  public void startStory(ActionEvent ae)
  {
    Story.startStory("**Perf_Monitor**");
  }

  public void endStory(ActionEvent ae)
  {
    Story.endStory();
  }

}
The performance monitor level that you specify in the logging.properties file determines how much data the story captures. That is, a logging.properties file entry of oracle.maf.performance.monitor.reported.level = FINEST produces a more verbose story than an entry of INFO. When the story ends, all performance data captured during a story is sorted based on timing. This sorting presents monitor observations corresponding to JavaScript events at a correct time, since the time when these observations were recorded might be different from the time when the measured events took place. MAF then iterates through the sorted records and produces indented output, as demonstrated in the following example.
MAF writes the story into the application log file. A sample output for an application that navigates from one AMX page to another AMX page might look like the following:
Example 30-1 MAF Performance Monitor Data Generated using Story
[INFO - oracle.maf.performance.monitor.observations.reported - Monitor - start]
                      PERFMON-JAVA START: **Perf_Monitor**.Navigation.Embedded.Story **Perf_Monitor** (Story Book) at 1452728427473

[INFO - oracle.maf.performance.monitor.observations.reported - Monitor - start]
                      PERFMON-JAVA START: **Perf_Monitor**.Navigation.Container.Process AMX event Page:
                      /view1.amx event of type action on node cb2 (Time to process event) at 1452728427416

[INFO - oracle.maf.performance.monitor.observations.reported - Monitor - stop]
                      PERFMON-JAVA STOP:  **Perf_Monitor**.Navigation.Container.Process AMX event Page:
                      /view1.amx event of type action on node cb2 (Time to process event) took: 14897.0ms
                      (started at 1452728427416)

[INFO - oracle.maf.performance.monitor.observations.reported - Monitor - start]
                      PERFMON-JAVA START: **Perf_Monitor**.Navigation.Container.Process AMX event Page:
                      /view1.amx event of type action on node cb1 (Time to process event) at 1452728442323

[INFO - oracle.maf.performance.monitor.observations.reported - Monitor - stop] PERFMON-JAVA STOP:
                      **Perf_Monitor**.Navigation.Container.Process AMX event Page:
                      /view1.amx event of type action on node cb1 (Time to process event) took:
                      586.0ms (started at 1452728442323)

[INFO - oracle.maf.performance.monitor.observations.reported - Monitor - start] PERFMON-JAVA START:
                      **Perf_Monitor**.Navigation.Container.Load page /view2.amx
                      (Time to fully render the page) at 1452728442441

[INFO - oracle.maf.performance.monitor.observations.reported - Monitor - stop] PERFMON-JAVA STOP:
                       **Perf_Monitor**.Navigation.Container.Load page /view2.amx
                      (Time to fully render the page) took: 468.0ms (started at 1452728442441)

[INFO - oracle.maf.performance.monitor.observations.reported - Monitor - start] PERFMON-JAVA START:
                       **Perf_Monitor**.Navigation.Embedded.Evaluate method expression #{myBean2.endStory}
                       (UserSpace) at 1452728450665

[INFO - oracle.maf.performance.monitor.observations.reported - Monitor - stop] PERFMON-JAVA STOP:
                       **Perf_Monitor**.Navigation.Embedded.Evaluate method expression #{myBean2.endStory}
                       (UserSpace) took: 78.0ms (started at 1452728450665)

[INFO - oracle.maf.performance.monitor.observations.reported - Monitor - start] PERFMON-JAVA START:
                       **Perf_Monitor**.Navigation.Container.Process AMX event Page: /view2.amx
                       event of type action on node cb2 (Time to process event) at 1452728450626

[INFO - oracle.maf.performance.monitor.observations.reported - Monitor - stop] PERFMON-JAVA STOP:
                       **Perf_Monitor**.Navigation.Container.Process AMX event Page: /view2.amx
                       event of type action on node cb2 (Time to process event)
                       took: 85.0ms (started at 1452728450626)
[INFO - oracle.maf.performance.monitor.observations.reported - Monitor - stop] PERFMON-JAVA STOP:
                       **Perf_Monitor**.Navigation.Embedded.Story **Perf_Monitor** (Story Book)
                       took: 23367.0ms (started at 1452728427473)

[INFO - oracle.maf.performance.monitor.reported - MonitorFactory - dumpStatistics] PERFMON-JAVA STATS:
                       Monitor 'com.company.aPerfMonDocApp.**Perf_Monitor**.Navigation.Container.Process AMX event'
                       description: 'Time to process event'  observations: 3
                       mean: 5189.333333333333 standard deviation: 8410.817102596711

[INFO - oracle.maf.performance.monitor.reported - MonitorFactory - dumpStatistics] PERFMON-JAVA STATS:
                       Monitor 'com.company.aPerfMonDocApp.**Perf_Monitor**.Navigation.Container.Load page'
                       description: 'Time to fully render the page'  observations: 1
                       mean: 468.0 standard deviation: NaN

[INFO - oracle.maf.performance.monitor.reported - MonitorFactory - dumpStatistics] PERFMON-JAVA STATS:
                       Monitor 'com.company.aPerfMonDocApp.**Perf_Monitor**.Navigation.Embedded.Evaluate
                       method expression' description: 'UserSpace'  observations: 1  mean: 78.0
                       standard deviation: NaN

[INFO - oracle.maf.performance.monitor.reported - MonitorFactory - dumpStatistics] PERFMON-JAVA STATS:
                       Monitor 'com.company.aPerfMonDocApp.**Perf_Monitor**.Navigation.Embedded.Story'
                       description: 'Story Book'  observations: 1  mean: 23367.0 standard deviation: NaN

1452728427473  0001.0001 [0000] Start: **Perf_Monitor**.Navigation.Embedded.Story **Perf_Monitor** (INFO)
1452728442323    0002.0002 [0001] Start: **Perf_Monitor**.Navigation.Container.Process AMX event Page:
                                                      /view1.amx event of type action on node cb1 (INFO)

1452728442441      0003.0003 [0002] Start: **Perf_Monitor**.Navigation.Container.Load page /view2.amx (INFO)
1452728442909      0003.0003 [0002] Stop: **Perf_Monitor**.Navigation.Container.Load page /view2.amx
                                                              (took = 468.0) started at 1452728442441 (INFO)

1452728442909    0002.0002 [0001] Stop: **Perf_Monitor**.Navigation.Container.Process AMX event Page:
                                                /view1.amx event of type action on node cb1 (took = 586.0)
                                                started at 1452728442323 (INFO)

1452728450626    0004.0002 [0001] Start: **Perf_Monitor**.Navigation.Container.Process AMX event Page:
                                                /view2.amx event of type action on node cb2 (INFO)

1452728450665      0005.0003 [0004] Start: **Perf_Monitor**.Navigation.Embedded.Evaluate
                                                method expression #{myBean2.endStory} (INFO)

1452728450711    0004.0002 [0001] Stop: **Perf_Monitor**.Navigation.Container.Process AMX event Page:
                                                /view2.amx event of type action on node cb2 (took = 85.0)
                                                started at 1452728450626 (INFO)

1452728450743      0005.0003 [0004] Stop: **Perf_Monitor**.Navigation.Embedded.Evaluate method
                                              expression #{myBean2.endStory} (took = 78.0)
                                              started at 1452728450665 (INFO)

1452728450840  0001.0001 [0000] Stop: **Perf_Monitor**.Navigation.Embedded.Story **Perf_Monitor**
                                              (took = 23367.0) started at 1452728427473 (INFO)
30.8 Sending Diagnostic Information to Oracle Mobile Cloud Service
MAF applications that access REST web services use RestServiceAdapter to access these services. If your application accesses REST services hosted by MCS and you want to use MCS Diagnostics to monitor and/or debug your application's calls to REST services hosted by MCS, create a McsRestServiceAdapter to send the following information to MCS:
-
Mobile diagnostic session ID.
This attribute maps an application session on a specific device. The application sends this information through the
Oracle-Mobile-DIAGNOSTIC-SESSION-IDHTTP request header. -
Mobile device ID
Correlates the REST API requests sent to MCS with the physical device that makes the request. The mobile application supplies this information through the
Oracle-Mobile-Device-IDHTTP request header. -
Client request time,
Indicates the API call time stamp that is captured on the client side immediately before the application submits the request. The mobile application supplies this information using the HTTP request header
Oracle-Mobile-CLIENT-REQUEST-TIMEattribute.
The following example shows the type of information that a MAF application using this type of adapter inserts into HTTP request headers:
Oracle-Mobile-Diagnostic-Session-ID: 19975
Oracle-Mobile-Device-ID: d09379504b0a3247
Oracle-Mobile-Client-Request-Time: 2016-02-09T09:03:17.777Z
The following example shows how you create the McsRestServiceAdapter:
...
import oracle.maf.api.dc.ws.rest.RestServiceAdapterFactory;
import oracle.maf.api.dc.ws.rest.RestServiceAdapter;

...
RestServiceAdapterFactory factory = RestServiceAdapterFactory.newFactory();
RestServiceAdapter mcsRestServiceAdapter = factory.createMcsRestServiceAdapter();
30.9 Sending Analytics Information to Oracle Mobile Cloud Service
A MAF application with one or more mobile backends (MBE) hosted on MCS can send analytics information about application usage to MCS Analytics.
Analytics information that MAF generates to send to MCS provides information about the application lifecycle and an end user's interaction with the MAF application. MAF categorizes analytics events into MAF Framework events and business events. You send information captured in response to MAF Framework events to MCS by configuring properties in your application's logging.properties file. Examples of MAF framework events includes application start, feature events like activate and feature navigation, and user authentication events. MAF logs these events by default when you configure your application to send analytics information to MCS.
The following example shows the payload that MAF generates and transfers to MCS for a FeatureNavigation MAF framework event that occurs when an end user is redirected to a login application feature (LF1) before navigating to secured application features (secure-feature-1, and secure-feature-2). MAF logs all MAF framework events within a session that starts when a MAF application that is configured to send analytics information activates. The session ends when the MAF application deactivates. In the following example, the sessionID property identifies the session.
OEPE's Log window displays this payload when you deploy your MAF application to a device in debug mode.
"name":"FeatureNavigation", "properties":{"SourceId":"null","DestinationId":"LF1"}, "type":"custom", "timestamp":"2015-11-06T20:35:27.384Z",
                                                    "sessionID":"com.company.MafAnalytics_736ad3d4-3443-4f65-8378-4e653ade2d30_160121114922"

"name":"FeatureNavigation", "properties":{"SourceId":"LF1","DestinationId":"secure-feature-1"}, "type":"custom",
             "timestamp":"2015-11-06T20:35:27.384Z", "sessionID":"com.company.MafAnalytics_736ad3d4-3443-4f65-8378-4e653ade2d30_160121114922"

"name":"FeatureNavigation", "properties":{"SourceId":"secure-feature-1","DestinationId":"secure-feature-2"}, "type":"custom",
              "timestamp":"2015-11-06T20:35:27.384Z", "sessionID":"com.company.MafAnalytics_736ad3d4-3443-4f65-8378-4e653ade2d30_160121114922"
Business events are events that you (the application developer) define in your application. You capture the analytics information for the event using the APIs that MAF provides in oracle.maf.api.analytics.AnalyticsUtilities. MAF also exposes a data control method (fireEventListener) on the ApplicationFeatures data control. Drag and drop this data control method to an AMX page where you can configure it to listen for the event that you define. These APIs can also be used to send analytics from MAF Framework events to MCS.
MAF also enables you to send context event information (device model, country, time zone, and so on) to MCS or to another repository that you choose.
You can also send analytics to repositories other than MCS.
For more information, see:
-
Section 30.9.1, "How to Configure the Transfer of Analytics to Oracle Mobile Cloud Service"
-
Section 30.9.2, "How to Programmatically Send Analytics to Oracle Mobile Cloud Service"
-
Section 30.9.3, "How to Send Context Events to Oracle Mobile Cloud Service"
-
Section 30.9.4, "How to Send Analytics to Other Repositories"
-
Section 30.9.5, "MAF Framework Events that Capture Analytics Information" (Describes the MAF Framework events that MAF provides.)
-
For information about the classes in the
oracle.maf.api.analyticspackage that you can extend and customize, see Java API Reference for Oracle Mobile Application Framework.
30.9.1 How to Configure the Transfer of Analytics to Oracle Mobile Cloud Service
MAF populates the logging.properties file in a new MAF application with the properties that you need to configure to send analytics information from your MAF application to MCS Analytics.
The following example shows the ready-to-use entries that the logging.properties file contains when you create a new MAF application.
# Configure the analytics logger
# Analytics events are logged only if oracle.maf.api.analytics.level=ALL
# Set to OFF or any level other than ALL to disable analytics
oracle.maf.api.analytics.level=ALL
oracle.maf.api.analytics.handlers=oracle.maf.api.analytics.LoggerAnalyticsHandler, oracle.maf.api.analytics.McsAnalyticsHandler
oracle.maf.api.analytics.custom.level=INFO
oracle.maf.api.analytics.LoggerAnalyticsHandler.level=INFO

# Configure MCSHandler
oracle.maf.api.analytics.McsAnalyticsHandler.level=INFO
oracle.maf.api.analytics.McsAnalyticsHandler.connectionId=Mcs_Connection_Id
oracle.maf.api.analytics.McsAnalyticsHandler.batchSize=25
oracle.maf.api.analytics.McsAnalyticsHandler.offlineWrite=false
oracle.maf.api.analytics.McsAnalyticsHandler.recordUsername=false
oracle.maf.api.analytics.McsAnalyticsHandler.contextProviderClassName=oracle.maf.api.analytics.McsContextProvider
Of the properties listed in the previous example, only connectionId is mandatory. Table 30-2 describes the optional properties. The connectionId property is where you define a valid connection to a MCS MBE. Use the connectionId defined in your application's connection.xml as the value for this property. If you do not specify a valid connectionId, MAF does not send events to MCS. Instead, MAF appends these events on disk until the maximum number of events allowed by the device is reached.
A valid connectionId in your application's connection.xml file uses the ID of the MBE (oracle-mobile-backend-id) and the application key (oracle-mobile-application-key) that is generated when the MAF application registers with the MBE. MAF adds these two values to the HTTP header that creates a connection to MCS. These values identify the MBE to which the MAF application sends analytic events and identify the application from which the analytics events originate.
Note:
You do not need to register your MAF application as a client on MCS for all 3 platforms (Android, iOS, and Universal Windows Platform). Register the MAF application for one platform and use the generated application key as a value fororacle-mobile-application-key.If the connection to the MCS MBE uses HTTP basic authentication type, associate oracle/wss_http_token_client_policy with the connection. For connections that use Oauth, associate oracle/http_oauth2_token_mobile_client_policy with the connection. If you do not associate the correct policy with the connection, MAF does not flush analytics events to MCS. For more information about associating a security policy with a connection, see Section 15.3, "Accessing Secure Web Services.".
The following example shows extracts of an application connections.xml file with values for the properties just discussed.
<References xmlns="http://xmlns.oracle.com/adf/jndi">
  <Reference name="Mcs_Connection_Id" className="oracle.adf.model.connection.url.HttpURLConnection"
             adfCredentialStoreKey="McsLoginConn" xmlns="">
    ...
    <RefAddresses>
      <XmlRefAddr addrType="Mcs_Connection_Id">
        <Contents>
          <urlconnection name="Mcs_Connection_Id" url="http://mcs_instance.oracle.com:7201"/>
    ...
  </Reference>
  <Reference name="McsLoginConn" className="oracle.adf.model.connection.adfmf.LoginConnection"
             adfCredentialStoreKey="McsLoginConn" partial="false" manageInOracleEnterpriseManager="true"
             deployable="true" xmlns="">
    <Factory className="oracle.adf.model.connection.adfmf.LoginConnectionFactory"/>
    <RefAddresses>
      <XmlRefAddr addrType="adfmfLogin">
        <Contents>
          <login url="http://mcs_instance.oracle.com:7201/mobile/platform/users/login"/>
          <logout url="http://mcs_instance.oracle.com:7201/mobile/platform/users/logout"/>
          <customAuthHeaders>
            <header name="oracle-mobile-backend-id" value="0e4a9dfa-046a-4aaa-b8dd-331044ad81f4"/>
            <header name="oracle-mobile-application-key" value="be53201a-8674-48d7-96d0-bb02f4cd06c5"/>
          </customAuthHeaders>
    ...
</References>
Configure the following optional entries in the logging.properties file to implement the described functionality.
Table 30-2 Optional Properties to Manage the Transfer of Analytics from a MAF Application
| Property | Description |
|---|---|
|
|
An optional property that determines the number of events saved locally before the MAF application sends them to an associated MCS instance. Events will be uploaded in batches to MCS. There is a limit on maximum batch size (65). If |
|
|
An optional property that determines if offline buffering of events should be enabled or not. It is possible that events get generated while a device is offline or the client is not able to establish a connection with MCS. Configure the |
|
|
An optional property that determines if username should be captured or not. Set to |
|
|
Optional. Provide a value for this property when the context event is generated. The value you specify determines the class that generates the context event for MCS. The context event contains information like timezone offset, geolocation and device information. It can also contain username if |
30.9.2 How to Programmatically Send Analytics to Oracle Mobile Cloud Service
MAF provides an API in oracle.maf.api.analytics.AnalyticsUtilities that you can use to send events to MCS.
The AnalyticsUtilities class provides the following API:
public static void fireEvent(Level level, String category, String eventName)
// Send an event without a payload

public static void fireEvent(Level level, String category, String eventName, JSONObject payload)
// Send an event with a JSON payload


level:     The logging level of the event. Set to any standard level supported by Java logging.

category:  The category of the event. Set to 'custom' for all events except context,
           sessionStart(MAF Framework event) and sessionEnd(MAF Framework event). Set the latter events to 'system'.

eventName: Provide your own event name if you do not use an event provided in the AnalyticsUtilities class.
           Throws an exception if null.

payload:   A JSONObject that contains key-value pairs for custom events. The JSONObject must be of type String.
           No other data type is supported.
Configure your application's logging.properties file with the values necessary to transfer analytics to MCS before you use this API. Specify, for example, the MCS connectionID.
The following example demonstrates how to use this API to send analytics from a MAF application to MCS.
//  Sending events from your application.

        //  The following logs event when there is no payload to register for an event.
        AnalyticsUtilities.fireEvent(Level.WARNING, AnalyticsUtilities.CATEGORY_CUSTOM, "EVENT_VIDEO_ACTIONS");

        //  The following logs event when there is a JSON payload to send for a custom event.
        try
                {
                  JSONObject   payload = new JSONObject();
                  payload.put("PAYLOAD_VIDEONAME", getFileName());
                  payload.put("PAYLOAD_ACTION", getAction());
                  // Creating a custom event 'EVENT_VIDEO_ACTIONS' of level INFO
                  AnalyticsUtilities.fireEvent(Level.INFO, AnalyticsUtilities.CATEGORY_CUSTOM, "EVENT_VIDEO_ACTIONS" , payload);
                }

           catch(Throwable t)
                {
                // log the error
                }
You can set different log levels to capture events based on user interaction. For example, the EVENT_VIDEO_ACTIONS event in the previous example could be of INFO level when your end user performs a play action. Alternatively, it could be set to WARNING level to capture events in case of failure. You manage the logging level in the logging.properties file. For example, to manage the logging of EVENT_VIDEO_ACTIONS events, configure the logging.properties file as follows:
// Set to  WARNING to log events for the play action. Set to INFO (or a lower level)
// to log events for the play action plus failure events
oracle.maf.api.analytics.custom.EVENT_VIDEO_ACTIONS.level=WARNING

// Disable logging of EVENT_VIDEO_ACTIONS
oracle.maf.api.analytics.custom.EVENT_VIDEO_ACTIONS.level=OFF
30.9.3 How to Send Context Events to Oracle Mobile Cloud Service
MAF applications can capture context events and send the collected information to MCS or to a repository other than MCS.
A context event defines the context of subsequent events until another context event is logged. An event can be logged from a MAF Framework event or from events that you define in your application.
Table 30-3 lists key names that MCS accepts in the key-value pairs of the JSON object(s) that transmit context events from the MAF application. MCS requires that all properties be of type String. All properties in the following table are optional.
Note:
MCS translates latitude and longitude information to city, state, country, and postal code. Provide latitude and longitude information or locality, region, postalCode and country, but not both.Table 30-3 Valid Key Names to Send Context Event Information to MCS
| Key Name | Description |
|---|---|
|
userName |
The user of the device who was logged in to the secured feature when the context events were logged. |
|
timezone |
Device's offset from UTC in seconds |
|
model |
Device's model name |
|
osName osVersion |
Device operating system name Device operating system version |
|
latitude |
Device's GPS latitude |
|
longitude |
Device's GPS longitude |
|
locality |
Device's locality |
|
region |
Device's region |
|
postalCode |
Device's postal code |
|
country |
Device's country |
To send context event information from your MAF application to MCS, configure the following entry in your logging.properties file:
oracle.maf.api.analytics.McsAnalyticsHandler.contextProviderClassName= oracle.maf.api.analytics.McsContextProvider
With this entry configured in your logging.properties file, MAF sends the context event information listed in Table 30-3 to MCS. You also need to set recordUsername to True in the logging.properties file if you want the MAF application to send the user name to MCS.
If you want to generate context events that contain fields you define, configure the following entry in your logging.properties file:
oracle.maf.api.analytics.McsAnalyticsHandler.contextProviderClassName=oracle.maf.demo.CustomContextProvider
Where oracle.maf.demo.CustomContextProvider is a class that implements oracle.maf.api.analytics.ContextProvider, as shown in Example 29-2. The generated context event contains the timezone, carrier, and manufacturer information.
Example 30-2 Custom Context Provider to Send Context Information
package oracle.maf.demo;

import java.util.Date;
import java.util.TimeZone;
import oracle.maf.api.analytics.ContextProvider;
import oracle.adfmf.json.JSONObject;

public class CustomContextProvider
  implements ContextProvider
  {
  public CustomContextProvider()
  {
    super();
  }

  public JSONObject generateContext()
  {
    JSONObject myCustomCtx = new JSONObject();

    //
    // TimeZone - Mobile device's offset from UTC in seconds
    //
    Date date = new Date();
    int offset = TimeZone.getDefault().getOffset(date.getTime()) / 1000;

    try
    {
      myCustomCtx.put("timezone", new Integer(offset).toString());
      myCustomCtx.put("carrier", "AT&T");
      myCustomCtx.put("manufacturer", "Apple");
    }
    catch(Exception ex)
    {
      ex.printStackTrace();
    }

    return myCustomCtx;
  }
  }
30.9.4 How to Send Analytics to Other Repositories
MAF applications can send analytics to repositories other than MCS.
To achieve this, you write a custom class that extends oracle.maf.api.analytics.McsAnalyticsHandler and overrides processEvent() method, as shown in the following example.
package oracle.maf.demo;

import java.io.IOException;
import oracle.adfmf.framework.exception.AdfException;

import oracle.adfmf.json.JSONArray;
import oracle.adfmf.resource.CDCErrorBundle;
import oracle.adfmf.util.ResourceBundleHelper;
import oracle.maf.api.analytics.McsAnalyticsHandler;
import oracle.maf.api.dc.ws.rest.RestServiceAdapter;
import oracle.maf.api.dc.ws.rest.RestServiceAdapterFactory;

public class CustomHandler extends McsAnalyticsHandler
{
  public CustomHandler()
  {
    super();
  }

  //
  // Establish the connection to a different repository and flush the events.
  //
  protected void processEvents() throws AdfException
  {
    // Extract the events to be flushed
    _events = super.getEvents();

    RestServiceAdapter restAdapter = RestServiceAdapterFactory.newFactory().createRestServiceAdapter();
    restAdapter.clearRequestProperties();

    // Get valid connectionId of the repository.
    restAdapter.setConnectionName(getConnectionId());
    restAdapter.setRequestMethod(RestServiceAdapter.REQUEST_TYPE_POST);
    restAdapter.addRequestProperty("Content-Type", "application/json");
    restAdapter.setRequestURI(_ANOTHER_REPOSITORY_URI);
    restAdapter.setGenerateAnalyticsEvents(false);

    // make REST call to send events
    try
    {
      String responseMessage = restAdapter.send(_events.toString());
    }
    catch (IOException ex)
    {
      throw new AdfException(AdfException.ERROR, ResourceBundleHelper.CDC_ERROR_BUNDLE,
                             CDCErrorBundle.ERR_ANALYTICS_FLUSH_EVENTS, new Object[] { ex });
    }
  }

  private JSONArray _events = new JSONArray();
  private static final String _ANOTHER_REPOSITORY_URI = "_repository_uri";
}

You also need register the custom class in the logging.properties file. For example, to register CustomHandler, configure logging.properties as shown in the following example:

# Configure the analytics logger
oracle.maf.api.analytics.level=ALL
oracle.maf.api.analytics.handlers=oracle.maf.demo.CustomHandler
oracle.maf.api.analytics.custom.level=INFO


# Configure CustomHandler
oracle.maf.demo.CustomHandler.level=INFO
oracle.maf.demo.CustomHandler.connectionId=RepositoryConn
oracle.maf.demo.CustomHandler.batchSize=7
oracle.maf.demo.CustomHandler.offlineWrite=true
oracle.maf.demo.CustomHandler.recordUsername=false
oracle.maf.demo.CustomHandler.contextProviderClassName=oracle.maf.api.analytics.McsContextProvider
30.9.5 MAF Framework Events that Capture Analytics Information
MAF provides a range of MAF Framework events that capture analytics information.
These events are grouped into two categories (custom and system). Configure your application's logging.properties file so that the application sends these events to MCS. First, configure your application's logging.properties file to enable the sending of analytics information by, among other things, specifying the MCS connectionID. You then specify the events that you want to send. Use the information in the following tables for this latter task.
Table 30-4 lists the MAF Framework events (custom category) that you can configure in the logging.properties file to send analytics information to MCS from your application. You can disable each event by setting it to OFF or to a higher logging level than the level that enables logging of the event.
Table 30-4 MAF Framework Events (Custom Category)
| Event Name | Logging Level | Enable or Disable Logging |
|---|---|---|
|
|
FINE |
|
|
|
INFO |
|
|
|
INFO |
|
|
|
FINER |
|
|
|
INFO for Operations: Warning and Expired FINE for Operation: Adjust |
|
|
|
INFO |
|
|
|
FINER |
|
|
|
INFO |
|
|
|
INFO |
|
|
|
INFO |
|
|
|
INFO |
|
Table 30-5 lists the MAF Framework events (system category) that you can configure in the logging.properties file to send analytics information to MCS from your application.
Table 30-5 MAF Framework Events (System Category)
| Event Name | Logging Level | Description |
|---|---|---|
|
|
INFO |
MAF reserves the use of this event name to identify the session that it starts when a MAF application activates and starts to log analytics information. Do not define events in your MAF application that use this event name. |
|
|
INFO |
MAF reserves the use of this event name to identify the session that it stops when a MAF application deactivates and stops logging analytics information. Do not define events in your MAF application that use this event name. MAF flushes events to MCS when sessionEnd occurs, irrespective of whether |
|
|
INFO |
Sends context event information (for example, the timezone, carrier, and manufacturer of the device). Enable this event as follows:
oracle.maf.api.analytics.McsAnalyticsHandler
    .contextProviderClassName=oracle.maf.api
    .analytics.McsContextProvider
For more information about the context event information, see Section 30.9.3, "How to Send Context Events to Oracle Mobile Cloud Service." |