9 Testing and Profiling Java Application Projects
This chapter describes how to use the tools provided by the IDE to run unit tests and to profile Java applications.
This chapter contains the following sections:
9.1 About Testing and Profiling Java Application Projects
The IDE provides tools for creating and running unit tests and for profiling Java applications. Unit tests enable you to test the code in Java applications. Profiling is the process of examining an application to locate memory or performance-related issues.
When profiling a Java application, you can monitor the Java Virtual Machine (JVM) and obtain data about application performance, including method timing, object allocation and garbage collection. You can use this data to locate potential areas in your code that can be optimized to improve performance.
You can use the IDE to test and to profile the following types of Java applications:
-
Java SE projects
-
Java EE and Web applications
-
Java Free-form projects
-
NetBeans Modules and Module suites
The following profiling capabilities are available:
-
Telemetry—profiles CPU, memory usage, number of threads and loaded classes. See Section 9.17, "Profiling Telemetry"
-
Methods—profiles methods execution times and invocation count, including call trees. See Section 9.18, "Profiling Methods."
-
Objects—profiles size and count of allocated objects including allocation paths. See Section 9.19, "Profiling Objects."
-
Threads—profiles threads time and state. See Section 9.20, "Profiling Threads."
-
Locks—profiles locks content data. See Section 9.21, "Profiling Locks."
9.2 Testing Java Application Projects with Unit Tests
The IDE provides built-in support for generating and executing unit tests based on the JUnit, TestNG, Mocha frameworks and Selenium tool suite.
The IDE supports JUnit 3 and JUnit 4 unit testing. For more information about JUnit, see http://www.junit.org
For more information about TestNG, see http://testng.org/doc/index.html
For more information about Mocha, see http://mochajs.org/
The IDE supports Selenium 2.0 testing. For more information about Selenium, see http://www.seleniumhq.org/docs/index.jsp
9.2.1 Test Types in the IDE
You can use the IDE to create the following:
-
Empty Tests. Test skeletons without testing methods, for which no class has been designated to be tested.
-
Tests for Existing Classes. Classes containing the actual testing methods which mirror the structure of the sources being tested.
-
Test Suites. Groups of test classes clustered to permit testing of an entire application or project.
You can generate tests and test suites by selecting any class or package node in the Projects window and choosing Tools > Create/Update Tests from the main menu.
9.2.2 Unit Test Structure
The IDE represents unit tests as subtrees which mirror the project's Java package structure. By default, when the IDE generates tests each test class has the name of the class it is testing appended by the word Test (for example, MyClassTest.java).
Each standard project has a default test folder that is used to store the unit tests and test suites. This folder is displayed as the Test Packages node in the Projects window. You can add any number of test folders to your project. Test files and the source files they test cannot be located in the same source tree.
9.3 Creating a Unit Test
The unit test generator enables you to create unit test suites and compilable test classes for use as skeletons in your unit tests. You can create unit tests for single classes and entire packages, as well as empty test skeletons to be used with sources you create later.
JUnit 4.x is backwards-compatible with JUnit 3.x. If you decide to downgrade from JUnit 4.x to JUnit 3.x, tests using unsupported features such as annotation descriptions and static imports are ignored.
Note:
The JUnit 4.x option is only available if your project is running on the Java 5.0 platform or higher.9.3.1 Changing the JUnit Version
You can update support for the JUnit versions by updating the JUnit libraries in the project's Test Libraries node. View the project's JUnit libraries by expanding the project's Test Libraries node in the Projects window.
To add a new library, right-click the Test Libraries node in the Projects window and choose Add Library and select the library in the Add Library dialog box. To remove a library, right-click the library and choose Remove.
9.3.2 How to Create a Unit Test
Generated tests are distinguished by appending Test to the tested classes' names (for example, MyClassTest.java).
Note:
Depending on the version of the unit testing framework you are using, the name of the test class is not required to end withTest.To create a test, the project must have a test directory for the tests. The IDE creates a Test Packages directory by default when you create a project. If no test directory exists in your project or you want to specify a different directory for your test, you can specify a test directory in the project properties dialog.
To create a test for a single class:
-
Right-click the class in the Projects window and choose Tools > Create/Update Tests (Ctrl+Shift+U) to open the Create Tests dialog box.
You can modify the default name of the test class, but some of the navigation in the IDE between classes and test classes might not function if the name of the test class does not contain the name of the class that is tested.
-
Select a unit test framework.
-
Select the desired code generation options and click OK.
Alternatively, you can create a test by choosing File > New File, selecting the Unit Tests category, and selecting JUnit Test or TestNG Test Case in the File Types pane.
-
Right-click the package node containing the source files for which you want to generate the test suite in the Projects window and choose Tools > Create Tests (Ctrl+Shift+U) from the context menu.
-
Select a unit test framework.
-
Select the Generate Test Suites checkbox.
-
Select the desired code generation options and click OK.
The IDE generates test classes for all enclosed classes and stores them in the project's Test Packages node. If any of the test classes already exist, those classes are updated. By default the IDE includes all the test classes as part of the generated test suite.
Alternatively, you can create a test suite by choosing File > New File, selecting the Unit Test category, and selecting Test Suite or TestNG Test Suite in the File Types pane.
-
Choose File > New File from the main menu.
-
In the New File wizard, select the Unit Test category and JUnit Test or TestNG Test Case in the File Types pane. Click Next.
-
Specify the test class name, folder and package.
-
Select the desired code generation options and click Finish.
When you create an empty test the IDE generates a test class that does not contain any skeleton methods. The IDE creates the test suite class based on the parameters you have specified and opens the class in the editor. The test suite class then appears in the Projects window under the package-name node in the test folder.
To create a new test for an existing class:
-
Choose File > New File from the main menu.
-
In the New File wizard, select the Unit Test category and Test for Existing Class in the File Types pane. Click Next.
-
Specify the test class name and folder.
-
Select the desired code generation options and click Finish.
When you create a test for an existing class, you specify the class that you want to test and the IDE generates a test class that contains skeleton methods based on the methods in the specified class. The IDE opens the class in the editor. The test class then appears in the Projects window in the test folder. The IDE creates the test class under the package-name node that replicates the package structure of the tested class.
-
Right-click the project node in the Projects window and choose Properties.
-
In the Properties window, select Sources in the Categories pane.
-
Define the properties of the test packages folder in the Test Package Folders list.
You can add or remove the folders that are used for test packages and modify the names of the test packages folder as it appears in the Projects window.
-
Click Close.
Your project must have a test package folder to generate unit tests. If the test packages folder for your project is missing or unavailable, create a new folder in your project and then designate the new folder as the test packages folder in the project's Properties window.
9.4 Running a Unit Test
Once you have created a test or test suite, use the Run Test command to initiate execution of the test. Run Test commands are available on source nodes only. After you run a test, you can rerun individual test methods executed during the test and displayed in the Test Results window.
9.4.1 How to Run a Unit Test
You can run unit tests for a specific class or method or for a project.
To run tests for an entire project:
-
Select any node or file in the project you want to test in the Projects or Files window.
-
From the main menu, choose Run > Test Project project_name (Alt+F6).
The IDE executes all of the project's tests.
If you want to run a subset of the project's tests or run the tests in a specific order, you can create test suites that specify the tests to run as part of that suite. After creating a test suite you run the suite in the same way you run a single test class.
You can select multiple projects in the Projects window and run tests for them at once by choosing Run > Test number_of_selected_projects Projects (Alt+F6) from the main IDE's menu. If you want to run a subset of the project's tests or run the tests in a specific order, you can create test suites that specify the tests to run as part of that suite. After creating a test suite you run the suite in the same way you run a single test class.
To run a test for a single class:
-
Select the node of the class for which you want to run a test in the Projects or Files window.
-
From the main menu, choose Run > Test File (CtrlF6).
You can also run a class's test by right-clicking the test class node itself in the Projects window and choosing Test File (Ctrl+F6).
-
Run the test class or suite containing the test method.
-
In the Test Results window, right-click the test method and choose Run Again.
To run a single test method the method must be listed in the Test Results window.
9.4.2 Working with Unit Test Output
When you run a test, the IDE shows the following test results in two panes in the Test Results window:
-
A summary of the passed and failed tests and the description of failed tests are displayed in the left pane of the window. You can use the filter icons in the left side of the window to filter the test results.
-
The textual output from the unit tests themselves is displayed in the right pane of the window.
The output from the process that builds and runs the test is displayed in the Output window. you can double-click any error to jump to the line in the code where the error occurred.
After you run a test class, you can right-click any test method displayed in the Test Results window and choose Run Again from the context menu to run the individual test method again or Debug to debug the test.
9.5 Debugging a Unit Test
You can debug a test class as you would any class. After you set your breakpoints in the test class you can run your unit test in the debugger and step through the code to locate problems in your test classes.
-
Place your breakpoints in your test class.
-
Select the node for the class whose test you wish to debug.
-
Choose Debug > Debug Test File (Ctrl+Shift+F6) from the main menu.
When you choose Debug Test File the IDE starts the test in the debugger and opens the Debugging window. For information on using the Debugging window, see Section 10.9, "Using the Debugger Windows."
9.6 Configuring Unit Test Settings
The IDE enables you to customize the process of test generation as you create tests. You can also edit the list of sources the IDE references when compiling tests.
9.6.1 How to Edit Unit Test Settings
Modify the test settings to create a custom tests.
To edit unit test settings as you create tests:
-
Right-click the sources for which you wish to create tests.
-
Choose Tools > Create Tests (Ctrl+Shift+U).
-
Select a unit test framework.
-
In the Create Tests dialog box, select the Code Generation options you require for the tests.
The IDE creates the tests with the specified options.
9.6.2 How to Edit the Classpath for Compiling or Running Tests
Edit the classpath as needed to include specific projects, libraries, or JAR files.
To edit the classpath for compiling or running tests:
-
Right-click the project's Test Libraries node and choose one of the following:
-
Add Project. The build output, source files, and Javadoc files of another IDE project.
-
Add Library. A collection of binary files, source files, and Javadoc files.
-
Add JAR/Folder. A JAR file or folder somewhere on your system.
-
-
Click OK.
The IDE adjusts and stores the classpath priorities based on the new settings. For information on setting the classpath for a project, see Section 6.2.3.1, "Managing the Classpath."
9.7 Creating a Selenium Test
You can create a Selenium test by choosing File > New File, selecting the Selenium Tests category, and selecting Selenium Test Case in the File Types pane.
-
Choose File > New File from the main menu.
-
Select the Selenium Tests category.
-
Select Selenium Test Case in the File Types pane.
-
Click Next.
-
Provide the required information in the Name and Location panel of the wizard.
-
Click Finish.
A Selenium Mocha/Protractor test case with a default test method is created.
To create a Selenium Test for a single class (applies to Maven java related project types only):
-
Right-click the class in the Projects window and choose Tools > Create/Update Tests to open the Create Tests dialog box.
Note:
You can modify the default name of the test class, but some of navigation between classes and test classes might be disabled in the IDE if the name of the test class does not contain the name of the class that is tested. -
Select Selenium as the test framework.
-
Click OK.
9.8 Configuring Selenium Server Settings
Configure the Selenium server settings as needed to test.
-
Right-click the Selenium Server node in the Services tab.
-
Provide the required information.
-
Click OK.
9.9 Starting a Profiling Session
If you have a project that is targeted to run on your local machine, you can profile the project without any additional configuration. When you profile a local project, you launch the project and start the profiling session from within the IDE.
If you want to profile a local application but you cannot or do not want to start the application from the IDE, you can profile the application by attaching the IDE to the application.
To profile a local project, the project must be open in the IDE. You can start the profiling session after you select the profiling task.
| Command | Description |
|---|---|
|
Profile > Profile Project |
The selected task is run on the project that is selected in the Projects window or on the main project if a main project is set. |
|
Profile > Profile File |
The profiling task is run on the selected file. The selected file must have a main method. |
|
Profile > Profile Test File |
If a test file is selected the profiling task is run on the test file. If the selected file is not a test file, the profiling task is run on the test file associated with the selected file. |
|
Profile > Attach to Project |
Opens the Profile window. In the Profile window, you select the profiling task. |
|
Profile > External Process |
Opens the Profile window. In the Profile window, you select the profiling task to profile remote applications or applications that you start outside the IDE. |
Note:
Before you can use the profiler in the IDE, you must calibrate the profiler. You only have to calibrate the profiler once. For information, see Section 9.9.2, "How to Calibrate the Profiler."9.9.1 How to Profile a Project
To profile an individual project:
-
Right-click a project in the Projects window and choose Profile.
Alternatively, you can select a project in the Projects window and choose Profile > Profile Project from the main menu.
-
On the main window click the Configure Session button and select a profiler mode by clicking on it. You can change the profiler mode at any point by clicking the Profile drop-down arrow.
-
On the main window, click the Profile button. The application and the profiling session are started.
If a project is set as the main project, the Profile Project command in the Profile menu always profiles the main project.
-
In the Projects window, select the class that you want to profile. (This class must contain a runnable method.)
-
Choose Profile > Profile File from the main menu.
-
On the main window, click the Profile button. The profiling session is started.
For information on profiling an application that you started outside the IDE, see Section 9.11, "Attaching the Profiler."
For information on monitoring an application thread activity, see Section 9.20, "Profiling Threads". For information on examining CPU performance and memory usage, see Section 9.17, "Profiling Telemetry".
9.9.2 How to Calibrate the Profiler
You must calibrate the IDE before you can use the IDE to profile an application. You must run the calibration process for each JDK that you use for profiling. You do this because instrumenting the bytecode of the application imposes some overhead, and the time spent in code instrumentation needs to be "factored out" to achieve more accurate results.
You only have to calibrate the IDE once for each JDK that you use. However, you should run the calibration process again when anything changes on your local or remote configuration that could affect system performance. The following could affect system performance:
-
Any hardware upgrade
-
Any significant change or upgrade of the operating system
-
An upgrade of the Java platform used for profiling
To calibrate the IDE to the local system:
-
Close any other programs that are running.
The IDE runs the calibration if other applications are running, but running any CPU-intensive programs when performing the calibration might affect the accuracy of profiling results.
-
Go to Tools > Options > Java > Profiler.
-
Select the General category and click Manage in the Profiling specific options. The Manage Calibration Data dialog box displays.
-
Select the Java Platform to be used for profiling. Click Calibrate.
You can click Java Platforms to open the Java Platform Manager to add a new Java platform. The Manage Calibration Data dialog box displays the date that the most recent calibration was performed.
When you click Calibrate, the IDE collects calibration data on the selected Java platform. When the calibration process is complete you can start using the IDE to profile your applications.
Do not share calibration data between various computers or systems.
You cannot perform a calibration of a remote platform from the Manage Calibration Data dialog box. Calibration of a remote platform is performed the first time that you profile an application on the remote platform.
To calibrate the IDE to a remote system:
-
To calibrate the IDE to a remote system, see the NetBeans FAQ at
http://wiki.netbeans.org/wiki/view/FaqProfilerCalibration.
9.9.3 Understanding the Toolbar Icons
Table 9-2 contains the various icons used when profiling. These icons are available from areas in the NetBeans user interface, including Profile window with Methods, Profile window with Threads, Profile window with Objects, Profile window with Telemetry, and Profile window with Locks.
Table 9-2 Profiling Methods Icons
| Icon | Name | Description |
|---|---|---|
|
|
Pause live results |
Allows to stop updating live results. Pressed automatically when a context menu is displayed for the profiling results. |
|
|
Update live results |
Is enabled when the Pause live results button is pressed, allows to manually update paused live results. |
|
|
Show delta/absolute values |
Controls switching between absolute and incremental values. |
|
|
Forward calls |
Shows or hides the Forward calls view (visible by default). |
|
|
Hot spots |
Shows or hides the Hot spots view (hidden by default). |
|
|
Reverse calls |
Shows or hides the Reverse calls view (visible by default). |
|
|
Select threads |
Shows a list of threads to be included or excluded from the displayed results. |
|
|
Take snapshot |
Saves the currently available profiling data to a file which can be reopened later for offline analysis or compared with another snapshot. |
|
|
Reset results |
Clears the currently available profiling data, enabling to start collecting new data from a defined point. |
|
|
Take thread dump |
Takes snapshot of all threads in the profiled JVM including their call stacks and displays it in a separate view. |
|
|
Take heap dump |
Saves a snapshot of all objects currently stored in the heap memory in a .hprof format and optionally opens it in a heap viewer. |
|
|
Request garbage collection |
Requests garbage collection in the profiled JVM. There's no guarantee when or if at all the garbage collection will be performed. To make sure GC will be run, the action should be invoked several times. |
9.10 Selecting a Profiling Task
When you start a profiling session, you first select and configure the profiling task. You choose the profiling task according to the type of profiling results you want to obtain from the session.
Each profiling task has default settings that are sufficient in most situations. You can configure the basic settings of each profiling task to modify the profiling results that are returned.
Table 9-3 describes the profiling tasks and the profiling results obtained from running the task.
Table 9-3 Profiling Tasks and Results
| Profiling Task | Results |
|---|---|
|
Telemetry |
Choose this to monitor CPU, memory usage, number of threads and loaded classes. |
|
Methods |
Choose this to profile methods execution times and invocation count, including call trees. |
|
Objects |
Choose this to profile size and count of allocated objects including allocation paths. |
|
Threads |
Choose this to profile threads time and state. |
|
Locks |
Choose this to profile locks content data. |
9.10.1 How to Select a Profiling Task
Each time you start or modify a profiling session, you first select a profiling task. You cannot run more than one profiling session at one time. You can profile a project or an individual file if the file has a runnable method. You can also profile test classes.
-
Select a project or file in the Projects window and choose Profile > Profile Project from the main menu.
Alternatively, you can right-click a project node in the Projects window and choose Profile, or right-click a file and choose Profile File or Profile Test File.
-
(Required when you run a profiling session for the first time only.) Select a profiling task by clicking one of the tasks in the Configure Section drop-down list.
-
Click Profile.
9.10.2 Using a Load Generator Script
The IDE supports using a load generator to replay previously saved load testing scripts. By using a load testing script, you can simulate a heavy load on your server or application to achieve more accurate results when testing application performance.
The IDE supports the Apache JMeter load testing tool. To work with the Apache JMeter load testing tool in the IDE, use the Plugins manager download and install the JMeter plugin from the Update Center by choosing Tools > Plugins from the main menu. This plugin installs additional Load Generator and Profiler/Load Generator Bridge plugins. A sample JMeter script is downloaded as a part of the JMeter plugin. The sample script is available in userdir/modules/jmeter/extras/Test.jmx.
Once you install the JMeter integration, a new Plugins section with a Load Generator item appears in the Profile or Attach drop-down menu. Choose Load Generator to start a JMeter script when starting the profiling session.
To create a new load testing script:
-
Choose File > New File from the main menu.
-
Select Load Testing Scripts > JMeter Plans in the Categories list and New JMeter Plan in the New File dialog and click Next.
-
In the Name and Location panel of the dialog specify the name of the new test jmx file and its location. Click Finish.
For more about using Apache JMeter, see http://jakarta.apache.org/jmeter/index.html.
9.11 Attaching the Profiler
The easiest way to profile your application is to use the Profile Project command. However, if you must start your application outside of the IDE, you can use the attach mode to profile an application. For example, you might want to use the attach mode in the following cases:
-
Your application needs to be started from the command line or uses a complex launch script
-
You want to obtain profiling data on the startup of the application or target JVM
-
You want to profile the application without restarting the application
You must use the attach mode in the following cases:
-
You want to profile an application running on a remote JVM, such as a remote application server
-
You want to profile a Java EE or web application and the target server is not Tomcat, GlassFish, WebLogic or JBoss
The Attach mode enables you to attach the profiling tool to an application that is already running, or just about to start on a local or remote machine. Using the attach mode is useful for profiling long-running applications, and in particular for profiling web or enterprise applications running on top of an application server. You can also use the Attach mode to profile the code of the application server itself.
9.11.1 How to Configure the Attach Settings
Before you can attach to an application, the startup options for the target application or server must be configured. You use the Attach Settings dialog box to specify the attachment settings for a project. You only have to configure the attachment settings once. The attachment settings are project specific, which means that each project has its own settings. You can open the Attach Settings dialog box at any time if you want to review or modify any of the attachment settings.
To configure the attach settings:
-
Choose Profile > Attach to Project or Profile > Attach to External Process (
 ) from the main menu to open the Profile window.
 -
Click the Attach button to display the Attach Settings dialog box and make the appropriate selections.
Based on the attach mode you choose in the Profile drop-down list, the Attach Settings dialog box provides you with a set of instructions on how to configure the application so that you can attach the profiler.
-
Click OK.
The attach mode you choose depends on the type of profiling data you want to obtain and the details of the target JVM platform. Table 9-4 provides an overview of the attach modes:
| Attach Mode | Description |
|---|---|
|
Already running local Java process |
Use this mode if you want to obtain profiling data on a local application. To use this mode, the application needs to be running on JDK 1.6, 1.7, or 1.8. When you use this mode, you can attach to and detach from the application without restarting application. |
|
Manually started local Java process |
Use this mode if you want to obtain profiling data on the startup of a local application. When you use this mode, the target JVM and application wait until you attach the profiler before starting. After you detach from the application, you must restart the application to start another profiling session. |
|
Manually started remote Java process |
Use this mode if you want to obtain profiling data on an application running on a remote JVM. To use this mode, you must install the Profiler Remote Pack on the remote target machine. You specify the details of the remote system and generate the Profiler Remote Pack using the Attach Settings dialog box. When you use this mode, the remote application starts after the profiler is attached. This mode enables you to obtain profiling data on the startup of the target JVM. |
To profile an applet using the Local Direct or Remote attach mode:
-
Specify the agent parameters in the Java Control Panel and restart the browser.
9.11.2 How to Attach the Profiler to a Local Application
Use the attach mode to profile a local application when you must start the application outside of the IDE. For example, you may want to use the attach mode in the following cases:
-
Your application needs to be started from the command line or uses a complex launch script.
-
You want to obtain profiling data on the startup of the application or target JVM.
-
You want to profile the application without restarting the application (Already running local Java process attach mode, requires JDK 1.6, 1.7, or 1.8).
To attach to a local application, you must first configure the attachment settings using the Attach Settings dialog box. These settings are associated with the project you are profiling. You only have to configure the attach settings for your project once, but you can modify the settings at any time in the Attach Settings dialog box.
When you configure the settings for attaching to a local application, you can choose from the following attachment modes:
-
Already running local Java process. This mode allows you to detach from and attach to the application at any time without stopping the application. This mode requires JDK 1.6, 1.7, or 1.8 but does not require any additional configuration.
-
Manually started local Java process. This mode enables you to obtain profiling data on the startup of the local application. This mode requires you to modify the startup script and start the application when you want to attach the profiler.
Once the connection is established and the profiler is attached to the target application, you can change the profiling task you are running on the target application without stopping or restarting the application.
To attach to a local application:
-
Choose Profile > Attach to Project (
) from the main menu to open the Profile window. -
Click the Attach button to open the Attach Settings dialog box.
-
Select either Already running local Java process or Manually started local Java process as the attach mode.
-
Follow the instructions in the Attach Settings dialog box for configuring the application, if necessary. Click OK.
A profiling session tracking the running application is started.
-
Choose Profile > Finish Profiler Session from the main menu or click the Finish profiler button in the Profiler window.
When you finish profiler session, the connection to the target JVM is closed. You can re-attach to the application by choosing Profile > Attach to Project from the main menu.
To change the profiling task without finishing profiler session:
Click the Attach drop-down arrow to change the profiling mode at any point.
The target application is instrumented again without starting or stopping the application.
9.12 Attaching the Profiler to a Remote Application
You can profile an application that is running on a remote system by attaching the profiling tool to the application. When you use this attach mode, the remote application starts after the profiler is attached. This mode enables you to obtain profiling data on the startup of the target JVM.
To attach the profiling tool, you use the Attach Settings dialog box to specify the attachment settings for your project. In the Attach Settings dialog box, specify the location, OS and JVM of the remote target. Based on the details that you provide, the Attach Settings dialog box provides you with a set of instructions on how to configure the remote application to support profiling.
9.12.1 How to Attach to a Remote Application
To attach the profiler to a remote application you must configure the application to load some profiler libraries on startup to enable the profiling tool to attach to the application. You use the Attach Settings dialog box to specify the details of the remote system and to generate a Remote Profiler Pack archive that contains the necessary profiler libraries. You must copy the contents of the Remote Profiler Pack archive to the remote system and then configure the remote application to load the profiler libraries.
After you configure the remote application according to the instructions, you can start the remote application and attach the profiler. You only have to configure the attach mode once. The attachment settings are associated with that project. You can open the Attach Settings dialog box at any time to change the attachment settings.
To attach to a remote application:
-
Choose Profile > Attach to External Project from the main menu. The Profile External Process window displays.
-
Select the Configure Session button and select Setup Attach to Process. The Attach Settings dialog box displays.
-
Set the profiler mode to Manually started remote Java process in the Profile drop-down list.
-
Specify the Hostname and select the OS and JVM from the drop-down list.
-
Follow the detailed instructions in the Attach Settings dialog to start profiling.
-
Click OK.
After the IDE is attached to the remote application you can do the following:
-
Detach from the remote application.
When you detach from the remote application, the remote application does not stop but you stop receiving profiling data about the remote application. To attach to the remote application, use the startup options provided by the Attach Settings dialog box and start the remote application again.
-
Modify the profiling session.
You can modify the profiling session without detaching from the remote application. For example, you can change the profiling task to monitoring to reduce the profiling overhead, and then modify the task again later. This way you do not have to re-attach and restart the remote application.
9.12.2 Attaching to a Remote Server
Similar to attaching the profiler to a remote application, you must copy the profiler libraries in the Remote Profiler Pack to the remote system to attach the profiling tool to a remote server. You must also modify the server configuration files to specify the path to the JDK and to specify the path to the profiler agent. When you start the server using the modified startup script, the server waits until the profiler attaches to the server.
You can retrieve the path to the profiler agent when you use the Attach Settings dialog box to configure your attach settings. The path to the profiler agent is similar to the following path.
-agentpath:<remote>\lib\deployed\jdk16\windows\profilerinterface.dll=\lib,5140
The placeholder <remote> refers to the full path to the root directory containing the profiler libraries that you copied to the remote system. The number 5140 is the Communication Port that the profiling tool uses to connect to the application. Modify the port number in the Profiler tab in the Java category in the Options window.
Table 9-5 identifies the startup scripts and the parameters that must be modified to specify the paths to the JDK and the profiler libraries:
| Server | File | Modification |
|---|---|---|
|
Tomcat 7.x and 8.0.27 |
|
Set For server, modify |
|
GlassFish Server Open Source Edition 4.1.1 |
|
Set For server, add jvm-options to include profile |
|
WebLogic 12c |
|
Set For server, modify |
|
JBoss AS 7.x |
|
Set For server, modify |
For the GlassFish server, set the path to the JDK in the asenv.bat/asenv.conf file and the path to the profiler agent in domain.xml.
For more details about configuring the servers for attaching the profiler tool, see the following NetBeans FAQ: http://wiki.netbeans.org/wiki/view/FaqProfilerAttachRemoteServer
For more details about modifying server startup scripts, consult the documentation for the server.
9.13 Profiling a Free-form Project
In a free-form project, you have to create Ant targets to be able to profile a file or project. You generally want one target in your free-form project's build script for profiling a project and one target for profiling individual files.
If you do not have a profile target written for your project the IDE will offer to generate a basic target for you when you first try to profile the project. You can then inspect the target and customize it according to the specific requirements of the project.
The first time that you choose the Profile Project or Profile File command on a free-form project you must create the targets. The IDE can create the targets for you based on the information for the target that is mapped to the Run command for the project. You only have to generate the targets once.
Note:
Before the profile target is generated it is recommended that you first confirm that you have a target mapped to the Run Project command. When the IDE generates a profile target the IDE looks for the information in the target that is mapped to the Run Project command to determine details such as the run classpath and the project's main class. If a target is already mapped to the Run Project command there is a good chance that the generated profile target will work without further customization.To profile a free-form project:
-
Set the free-form project as the main project by choosing Run > Set Main Project in the main menu and selecting the project.
-
Choose Profile > Profile Main Project in the main menu.
-
Click the Configure Session button and select the required profiling mode.
-
Click the Profile button to start profiling.
Before profiling your free-form project, be aware of the following conditions:
-
The project output must be set before you can profile a free-form application.
-
If you click Generate in the Profile Project dialog box to generate the targets the IDE creates a build script named
ide-targets.xmland generates a target namedprofile-nb. Verify that the generatedprofile-nbtarget properly takes into account all of the elements of your project. In some cases, you might have to modify the classpath argument in the target if it does not include all of the items in your run classpath. -
The IDE also modifies
project.xml to map theprofile-nbtarget to the Profile Project command in the IDE. If you write the target from scratch, you must also create this mapping yourself.For example, the
profile-nbtarget that the IDE generates inide-targets.xmlmight look similar to the following example:Example 9-1 Sample profile-nb Target
<?xml version="1.0" encoding="UTF-8"?>
    <project basedir=".." name="YourProjectName">
        <import file="../build.xml"/>
        <target name="-profile-check">
            <startprofiler freeform="true"/>
        </target>
        <!-- TODO: edit the following target according to your needs -->
        <target name="profile-nb" if="profiler.configured" depends="-profile-check">
            <java classname="${mainclass}" dir="." fork="true">
                <classpath>
                    <pathelement path="ClasspathSpecifiedInYourRunTarget"/>
                </classpath>
                <jvmarg line="${agent.jvmargs}"/>
            </java>
        </target>
    </project>
In this example the IDE attempted to guess the runtime classpath for the project.
-
If you do not have a run target mapped or the IDE otherwise cannot determine the project's classpath or main class, the generated profile target includes "TODO" placeholders for you to fill in these values.
9.13.1 Profiling Free-form Web Projects
Typically the server is started using a startup script, not the java command directly. Therefore you cannot use the <jvmarg .../> element to pass additional argument to it. Instead, you have to modify the server startup script to configure it for profiling.
The recommended approach is to create a new script for starting the server for profiling and use it in the profile target. The Attach Settings dialog box can provide steps to help you modify the startup script. If your target server does not support automatic integration, you can create the script by following the integration steps described in the Attach Settings dialog box. You always have to set up the integration for Local Direct attach.
The other steps for profiling a free-form web project are the same as those above for profiling a standard J2SE projects.
9.13.1.1 A Typical Free-Form Project Profile Target
The generated Ant target does the following:
-
Starts the profiler with the startprofiler task. Setting the freeform attribute to true will force displaying the profiling session configuration dialog.
-
The previous task sets the
profiler.configuredtotrueif the configuration was confirmed. It also stores the profiler agent JVM arguments in theagent.jvmargsproperty. -
Establishes the runtime classpath. If the IDE is not able to determine your runtime classpath the IDE adds placeholders to the script which you need to fill in yourself.
-
Runs the application in profile mode. Setting
fork="true"ensures the process is launched in a separate virtual machine.
Note:
You can add any additional JVM arguments or program arguments in the javatask as well.A generated profile target where the IDE is able to guess the runtime classpath will look similar to the following (where the italicized items would have values specific to your project).
<?xml version="1.0" encoding="UTF-8"?>
    <project basedir=".." name="YourProjectName">
        <import file="../build.xml"/>
        <target name="-profile-check">
            <startprofiler freeform="true"/>
        </target>
        <!-- TODO: edit the following target according to your needs -->
        <!-- (more info: https://netbeans.org/kb/articles/freeform-config.html#profilej2se) -->
        <target name="profile-nb" if="profiler.configured" depends="-profile-check">
            <java classname="${mainclass}" dir="." fork="true">
                <classpath>
                    <pathelement path="ClasspathSpecifiedInYourRunTarget"/>
                </classpath>
                <jvmarg line="${agent.jvmargs}"/>
            </java>
        </target>
    </project>
If you do not have a run target mapped or the IDE otherwise cannot determine the project's classpath or main class, the generated profile target includes "TODO" placeholders for you to fill in these values as in the example below.
<?xml version="1.0" encoding="UTF-8"?>
    <project basedir=".." name="YourProjectName">
        <target name="-profile-check">
            <startprofiler freeform="true"/>
        </target>
        <!-- TODO: edit the following target according to your needs -->
        <!-- (more info: https://netbeans.org/kb/articles/freeform-config.html#profilej2se) -->
        <target depends="-profile-check" if="profiler.configured" name="profile-nb">
            <path id="cp">
                <!-- TODO configure the runtime classpath for your project here: -->
            </path>
            <!-- TODO configure the main class for your project here: -->
            <java classname="some.main.Class" fork="true">
                <classpath refid="cp"/>
                <jvmarg line="${agent.jvmargs}"/>
            </java>
        </target>
    </project>
To specify the runtime classpath, insert pathelement elements within the path element and point them to the directories that contain the items in your classpath. For example, you can use the location attribute of pathelement to specify the location of the classpath items relative to your project directory. The project directory is usually the directory that contains the project's build.xml file. Below is an example of using the pathelement attributes.
<path id="cp">
    <pathelement location="libs">
    <pathelement location="build">
</path>
9.13.1.2 Writing a Target to Profile a Selected File
The process is basically the same for writing targets to debug and run a single file. The profile-selected-files target looks similar to the following:
<target name="-profile-check">
    <startprofiler freeform="true"/>
</target>
<!-- TODO: edit the following target according to your needs -->
<!-- (more info: https://netbeans.org/kb/articles/freeform-config.html#profile_sing) -->
<target depends="-profile-check" if="profiler.configured" name="profile-selected-file-in-src">
    <fail unless="profile.class">Must set property 'profile.class'</fail>
    <path id="cp">
        <pathelement location="build"/>
    </path>>
    <java classname="${profile.class}" fork="true">
        <classpath refid="cp"/>
        <jvmarg line="${agent.jvmargs}"/>
    </java>
</target>
-
This is basically the same as the
profiletarget. Instead of passing the program main class to java you pass theprofile.classproperty, which is set by the IDE to the currently selected file.
Then you map the profile-selected-files target to the profile.single action.
<action name="profile.single">
      <target>profile-selected-files</target>
      <context>
         <property>profile.class</property>
         <folder>${src.dir}</folder>
         <pattern>\.java$</pattern>
         <format>java-name</format>
         <arity>
            <one-file-only/>
         </arity>
      </context>
</action>
-
<property>now stores the context in theprofile.classproperty. -
Because
javacan only take a single file, you set<arity>to<one-file-only>. -
Setting
<format>tojava-nameand making it relative tosrc.dircreates a fully-qualified class name for the currently selected file.Note:
The IDE does not define the${src.dir}property for you. You need to define the property or import the.propertiesfile that Ant is using inproject.xml. See Section 6.2.4.9.1, "Using Properties in the project.xml File" for more information.
9.14 Taking and Accessing Snapshots of Profiling Data
A snapshot captures profiling data at a specific point in time and allows you to access them via the Snapshot window. See Section 9.14.4, "Accessing Snapshots".
A snapshot differs from live profiling results in the following ways:
-
Snapshots can be examined when no profiling session is running.
-
Snapshots can be easily compared.
There are two options for taking snapshots:
-
While the profiling session is in progress. See Section 9.14.1, "Taking Snapshots During a Profiling Session"
-
At the end of the profiling session. See Section 9.14.2, "Taking Snapshots at the End of a Profiling Session"
9.14.1 Taking Snapshots During a Profiling Session
You may take a snapshot of the profiling data at any time during the profiling session by clicking the Snapshot icon shown in the figure below.
To control how the snapshots functionality behaves during a session, go to Tools > Options > Java > Snapshots > Profiler and click the When taking snapshots drop-down menu to see the following options:
Open Snapshot—it opens the snapshot right after clicking the Snapshot icon
Save Snapshot—it saves a new snapshot every time you click the Snapshot Icon
Save and open snapshot—it saves and opens a snapshot right after clicking the Snapshot icon.
You may take multiple snapshots during a profiling session and you will also be prompted to save a "final" snapshot at the end of the session.
You can only take a snapshot while a profiling session is in progress. You can take a snapshot manually or set a profiling point to take a snapshot automatically at a precise point in your application. When you use a profiling point to take a snapshot, you locate the point in your source code where you want to take a snapshot. For example, you may want to take a snapshot when a thread enters a specific method.
Perform the following steps to take a snapshot manually:
-
Start a profiling session.
For information, see Section 9.9, "Starting a Profiling Session."
-
Do one of the following:
-
Click the Take Snapshot of Collected Results button in the Profiler window.
-
Select Profile > Take Snapshot of Collected Results from the main menu.
-
When you take a snapshot, the snapshot opens in the main editor window. You can then save the snapshot to your project.
To take a snapshot using a profiling point:
-
Open the source file containing the code where you want to place the profiling point.
-
Right-click in the line of code and choose Profile > Insert Profiling Point.
-
Select one of the snapshot options in the New Profiling Point wizard and click Next.
-
Modify any of the profiling point properties in the Customize Properties page of the wizard. Click Finish.
If you use a profiling point to take a snapshot, you can choose from the following snapshot options:
-
Load Generator. Choose this if you want the IDE to take a snapshot to start and stop a load generator script at the given source code location.
-
Reset Results. Choose this if you want the IDE to take a snapshot to reset currently collected profiling results.
-
Stopwatch. Choose this if you want the IDE to take a snapshot to measure time between start and stop locations to obtain the execution time of a method fragment.
-
Take Snapshot. Choose this if you want the IDE to take a snapshot when an application thread enters or leaves the specified line of code.
-
Timed Take Snapshot. Choose this if you want the IDE to take a snapshot at a specific time and date. You can also configure the IDE to take snapshots at a specified interval.
-
Triggered Take Snapshot. Choose this if you want the IDE to take a snapshot when the specified condition is met. You specify the condition by choosing one of the available triggers.
For each snapshot option you can choose to save the snapshot to your project or you can specify a location.
-
Click Save Snapshot to Project in the snapshot toolbar.
You can also use the Options window to configure the IDE behavior when taking a snapshot.
You can save a snapshot to your project or you can save the snapshot to a location on your local file system. When you save a snapshot to your project, the snapshot is listed under Snapshots in the Snapshots window.
To distinguish a snapshot from other profiling snapshots you have taken of the project, you can rename it. Select a snapshot in the Snapshots section of the Snapshots window and click Rename selected snapshot to open the Rename Snapshot dialog box and enter a new name.
9.14.2 Taking Snapshots at the End of a Profiling Session
When closing a profiled application, or if it finishes on its own, while the profiling session is in progress, the profiler asks you whether to take a snapshot of the results collected so far by displaying the Application Finished dialog.
Click Yes to save the snapshot.
9.14.3 Starting and Stopping the Application Finished Dialog
When the Application Finished dialog appears at the end of the profiling session, if you select the Do not show this message again checkbox the dialog would not display again. If at a later time you want to reactivate the display of this dialog, go to Tools Options > Java > Snapshots > Profiler > General > Miscellaneous and click the Reset button.
9.14.4 Accessing Snapshots
You may access you profiling session snapshots by going to Window > Profiling > Snapshots. The Snapshots window appears.
At the bottom of the Snapshots window there are icons that allow you to export, open, rename, and delete selected snapshots.
9.15 Taking a Heap Dump
A heap dump captures profiling data at a specific point in time. You can take a heap dump when a profiling session is in progress. When you take a heap dump, you are prompted to save the heap to your project or local file system. After you save a heap dump you can load the heap dump at any time and browse the objects on the heap, locate references to individual objects and compare heap dumps to view the differences between the snapshots. It is not necessary to run a profiling session to load and browse the heap dump.
Note:
To take a heap dump, the application must be running on a version of JDK 1.5.0_12 or later.9.15.1 How to Take a Heap Dump
You can take a heap dump manually or set a profiling point to take a heap dump automatically at a certain point in your application. In the Options window, you can also set the IDE to automatically take a heap dump on OutOfMemory error.
-
Start a profiling session.
-
Choose Profile > Take Heap Dump in the main menu.
When you take the heap dump, you are prompted to specify where you want to save the heap dump. You can save the heap dump snapshot to your project or to any location on your local file system.
To take a heap dump using a profiling point:
-
Open the source file containing the code where you want to place the profiling point.
-
Right-click in the line of code where you want to place the profiling point and choose Profile > Insert Profiling Point.
-
In the New Profiling Point wizard, select one of the following snapshot options and click Next.
-
Take Snapshot
-
Timed Take Snapshot
-
Triggered Take Snapshot
-
-
In the Customize Properties page of the wizard, select Heap Dump as the type of snapshot and modify any additional settings. Click Finish.
When you use a profiling point to take a heap dump, you specify the point in your source code where you want to place the profiling point. For example, you may want to take a heap dump when a thread enters a specific method.
To take a heap dump on OutOfMemory error:
-
Choose Tools > Options from the main menu, click the Java category and then click the Profiler tab.
-
Choose the Snapshots category.
-
In the On OutOfMemoryError list, select an option from the drop-down list to specify what the IDE does when an OutOfMemoryError is encountered.
The default behavior is to save the heap dump to the profiled project.
9.15.2 How to Analyze a Heap Dump Using Object Query Language (OQL)
OQL is a SQL-like query language to query a Java heap that enables you to filter/select information wanted from the Java heap. While pre-defined queries such as "show all instances of class X" are already supported by the tool, OQL adds more flexibility. OQL is based on JavaScript expression language.
When you load a Java heap in the Heap window, you can click the OQL Console tab of the window to open the OQL editor. The OQL Console contains an OQL editor, a saved OQL queries window and a window that displays the query results. You can use any of the sample OQL queries or create a query to filter and select heap data to locate the information that you want from the Java heap. After you choose or write a query, you can run the query against the Java heap and view the results.
An OQL query is of the following form:
select <JavaScript expression to select>
[ from [instanceof] <class name> <identifier>
[ where <JavaScript boolean expression to filter> ] ]
where class name is fully qualified Java class name (example: java.net.URL) or array class name. char[] (or [C) is char array name, java.io.File (or [Ljava.io.File;) is name of java.io.File[] and so on. Note that fully qualified class name does not always uniquely identify a Java class at runtime. There may be more than one Java class with the same name but loaded by different loaders. So, class name is permitted to be id string of the class object. If instanceof keyword is used, subtype objects are selected. If this keyword is not specified, only the instances of exact class specified are selected. Both from and where clauses are optional.
In select and (optional) where clauses, the expression used in JavaScript expression. Java heap objects are wrapped as convenient script objects so that fields may be accessed in natural syntax. For example, Java fields can be accessed with obj.field_name syntax and array elements can be accessed with array[index] syntax. Each Java object selected is bound to a JavaScript variable of the identifier name specified in from clause.
9.15.2.1 OQL Examples
Select all Strings of length 100 or more:
select s from java.lang.String s where s.count >= 100
Select all int arrays of length 256 or more:
select a from int[] a where a.length >= 256
Show content of Strings that match a regular expression:
select {instance: s, content: s.toString()} from java.lang.String s
    where /java/(s.toString())
Show path value of all File objects:
select file.path.toString() from java.io.File file
Show names of all ClassLoader classes:
select classof(cl).name
    from instanceof java.lang.ClassLoader cl
Show instances of the Class identified by given id string:
select o from instanceof 0xd404b198 o
0xd404b198 is id of a Class (in a session). This is found by looking at the id shown in that class's page.
9.15.2.2 OQL built-in objects and functions
The heap built-in object supports the following methods:
-
heap.forEachClass- calls a callback function for each Java Classheap.forEachClass(callback);
-
heap.forEachObject- calls a callback function for each Java objectheap.forEachObject(callback, clazz, includeSubtypes);
clazzis the class whose instances are selected. If not specified, defaults tojava.lang.Object. includeSubtypesis a boolean flag that specifies whether to include subtype instances or not. Default value of this flag is true. -
heap.findClass- finds Java Class of given nameheap.findClass(className);
where
classNameis name of the class to find. The resulting Class object has following properties:-
name - name of the class.
-
superclass - Class object for super class (or null if
java.lang.Object). -
statics - name, value pairs for static fields of the Class.
-
fields - array of field objects. field object has name, signature properties.
-
loader - ClassLoader object that loaded this class.
Class objects have the following methods:
-
isSubclassOf- tests whether given class is direct or indirect subclass of this class or not. -
isSuperclassOf- tests whether given Class is direct or indirect superclass of this class or not. -
subclasses- returns array of direct and indirect subclasses. -
superclasses- returns array of direct and indirect superclasses.
-
-
heap.findObject- finds object from given object idheap.findObject(stringIdOfObject);
-
heap.classes- returns an enumeration of all Java classes -
heap.objects- returns an enumeration of Java objectsheap.objects(clazz, [includeSubtypes], [filter])
clazzis the class whose instances are selected. If not specified, defaults tojava.lang.Object. includeSubtypesis a boolean flag that specifies whether to include subtype instances or not. Default value of this flag is true. This method accepts an optional filter expression to filter the result set of objects. -
heap.finalizables- returns an enumeration of Java objects that are pending to be finalized. -
heap.livepaths- return an enumeration of paths by which a given object is alive. This method accepts optional second parameter that is a boolean flag. This flag tells whether to include paths with weak reference(s) or not. By default, paths with weak reference(s) are not included.select heap.livepaths(s) from java.lang.String s
Each element of this array itself is another array. The later array is contains an objects that are in the 'reference chain' of the path.
-
heap.roots- returns an Enumeration of Roots of the heap.Each Root object has the following properties:
-
id - String id of the object that is referred by this root
-
type - descriptive type of Root (JNI Global, JNI Local, Java Static, etc.)
-
description - String description of the Root
-
referrer - Thread Object or Class object that is responsible for this root or null
-
-
Access static field 'props' of class
java.lang.Systemselect heap.findClass("java.lang.System").statics.props select heap.findClass("java.lang.System").props -
Get number of fields of
java.lang.Stringclassselect heap.findClass("java.lang.String").fields.length -
Find the object whose object id is given
select heap.findObject("0xf3800b58") -
Select all classes that have name pattern java.net.*
select filter(heap.classes(), "/java.net./(it.name)")
Functions on individual objects
-
allocTracefunctionReturns allocation site trace of a given Java object if available.
allocTracereturns array of frame objects. Each frame object has the following properties:-
className - name of the Java class whose method is running in the frame.
-
methodName - name of the Java method running in the frame.
-
methodSignature - signature of the Java method running in the frame.
-
sourceFileName - name of source file of the Java class running in the frame.
-
lineNumber - source line number within the method.
-
-
classoffunctionReturns class object of a given Java object. The resulting object supports the following properties:
-
name - name of the class
-
superclass - class object for super class (or null if
java.lang.Object) -
statics - name, value pairs for static fields of the class
-
fields - array of field objects. Field objects have name, signature properties
-
loader - ClassLoader object that loaded this class.
Class objects have the following methods:
-
isSubclassOf- tests whether given class is direct or indirect subclass of this class or not -
isSuperclassOf- tests whether a given class is direct or indirect superclass of this class or not -
subclasses - returns array of direct and indirect subclasses
-
superclasses - returns array of direct and indirect superclasses
Examples
-
Show class name of each Reference type object
select classof(o).name from instanceof java.lang.ref.Reference o
-
Show all subclasses of
java.io.InputStreamselect heap.findClass("java.io.InputStream").subclasses() -
Show all superclasses of
java.io.BufferedInputStreamshow all superclasses of java.io.BufferedInputStream
-
-
forEachReferrerfunctionCalls a callback function for each referrer of a given Java object.
-
identicalfunctionReturns whether two given Java objects are identical or not, for example:
select identical(heap.findClass("Foo").statics.bar, heap.findClass("AnotherClass").statics.bar) -
objectidfunctionReturns String id of a given Java object. This id can be passed to
heap.findObjectand may also be used to compare objects for identity. For example:select objectid(o) from java.lang.Object o
-
reachablesfunctionReturns an array of Java objects that are transitively referred from the given Java object. Optionally accepts a second parameter that is comma separated field names to be excluded from reachability computation. Fields are written in
class_name.field_namepattern.Examples
-
Print all reachable objects from each Properties instance.
select reachables(p) from java.util.Properties p
-
Print all reachables from each
java.net.URLbut omit the objects reachable via the fields specified.select reachables(u, 'java.net.URL.handler') from java.net.URL u
-
-
referrersfunctionReturns an enumeration of Java objects that hold reference to a given Java object. This method accepts optional second parameter that is a boolean flag. This flag tells whether to include weak reference(s) or not. By default, weak reference(s) are not included.
Examples
-
Print number of referrers for each
java.lang.Objectinstanceselect count(referrers(o)) from java.lang.Object o
-
Print referrers for each
java.io.Fileobjectselect referrers(f) from java.io.File f
-
Print URL objects only if referred by 2 or more
select u from java.net.URL u where count(referrers(u)) > 2
-
-
refereesfunctionReturns an array of Java objects to which the given Java object directly refers to. This method accepts optional second parameter that is a boolean flag. This flag tells whether to include weak reference(s) or not. By default, weak reference(s) are not included. For example, to print all static reference fields of
java.io.Fileclass:select referees(heap.findClass("java.io.File")) -
refersfunctionReturns whether first Java object refers to second Java object or not.
-
rootfunctionIf the given object is a member of root set of objects, this function returns a descriptive Root object describing why it is so. If given object is not a root, then this function returns null.
-
sizeoffunctionReturns size of the given Java object in bytes, for example:
select sizeof(o) from int[] o
-
retainedsizefunctionReturns size of the retained set of the given Java object in bytes. Note: Using this function for the first time on a heap dump may take significant amount of time.
The following is an example usage of the
retainedsizefunction:select rsizeof(o) from instanceof java.lang.HashMap o
-
toHtmlfunctionReturns HTML string for the given Java object. Note that this is called automatically for objects selected by select expression. But, it may be useful to print more complex output. For example, to print a hyperlink in bold font:
select "<b>" + toHtml(o) + "</b>" from java.lang.Object o
9.15.2.3 Selecting Multiple Values
Multiple values can be selected using JavaScript object literals or arrays.
For example, show the name and thread for each thread object
select { name: t.name? t.name.toString() : "null", thread: t }
from instanceof java.lang.Thread t
array/iterator/enumeration manipulation functions
These functions accept an array/iterator/enumeration and an expression string [or a callback function] as input. These functions iterate the array/iterator/enumeration and apply the expression (or function) on each element. Note: JavaScript objects are associative arrays. So, these functions may also be used with arbitrary JavaScript objects.
-
concatfunctionReturns whether the given array/enumeration contains an element the given boolean expression specified in code. The code evaluated can refer to the following built-in variables.
-
it - currently visited element
-
index - index of the current element
-
array - array/enumeration that is being iterated
For example, to select all Properties objects that are referred by some static field some class:
select p from java.util.Properties p
where contains(referrers(p), "classof(it).name == 'java.lang.Class'")
-
-
countfunctionReturns the count of elements of the input array/enumeration that satisfy the given boolean expression. The boolean expression code can refer to the following built-in variables.
-
it - currently visited element
-
index - index of the current element
-
array - array/enumeration that is being iterated
For example, print the number of classes that have a specific name pattern:
select count(heap.classes(), "/java.io./(it.name)")
-
-
filterfunctionReturns an array/enumeration that contains elements of the input array/enumeration that satisfy the given boolean expression. The boolean expression code can refer to the following built-in variables.
-
it - currently visited element
-
index - index of the current element
-
array - array/enumeration that is being iterated
-
result -> result array/enumeration
Examples
-
Show all classes that have
java.io.*name patternselect filter(heap.classes(), "/java.io./(it.name)")
-
Show all referrers of URL object where the referrer is not from java.net package
select filter(referrers(u), "! /java.net./(classof(it).name)")
from java.net.URL u
-
-
lengthfunctionReturns number of elements of an array/enumeration.
-
mapfunctionTransforms the given array/enumeration by evaluating given code on each element. The code evaluated can refer to the following built-in variables.
-
it - currently visited element
-
index - index of the current element
-
array - array/enumeration that is being iterated
-
result -> result array/enumeration
Mapfunction returns an array/enumeration of values created by repeatedly calling code on each element of input array/enumeration.For example, show all static fields of
java.io.Filewith name and value:select map(heap.findClass("java.io.File").statics, "index + '=' + toHtml(it)") -
-
maxfunctionReturns the maximum element of the given array/enumeration. Optionally accepts code expression to compare elements of the array. By default numerical comparison is used. The comparison expression can use the following built-in variables:
-
lhs - left side element for comparison
-
rhs - right side element for comparison
Examples
-
Find the maximum length of any string instance
select max(map(heap.objects('java.lang.String', false), 'it.count')) -
Find string instance that has the maximum length
select max(heap.objects('java.lang.String'), 'lhs.count > rhs.count')
-
-
minfunctionReturns the minimum element of the given array/enumeration. Optionally accepts code expression to compare elements of the array. By default numerical comparison is used. The comparison expression can use the following built-in variables:
-
lhs - left side element for comparison
-
rhs - right side element for comparison
Examples
-
Find the minimum size of any vector instance
select min(map(heap.objects('java.util.Vector', false), 'it.elementData.length')) -
Find vector instance that has the maximum length
select min(heap.objects('java.util.Vector'), 'lhs.elementData.length < rhs.elementData.length')
-
-
sortfunctionSorts a given array/enumeration. Optionally accepts code expression to compare elements of the array. By default numerical comparison is used. The comparison expression can use the following built-in variables:
-
lhs - left side element for comparison
-
rhs - right side element for comparison
Examples
-
Print all char[] objects in the order of size.
select sort(heap.objects('char[]'), 'sizeof(lhs) - sizeof(rhs)') -
Print all char[] objects in the order of size but print size as well.
select map(sort(heap.objects('char[]'), 'sizeof(lhs) - sizeof(rhs)'),
 '{ size: sizeof(it), obj: it }')
-
-
topfunctionReturns top N elements of the given array/enumeration. Optionally accepts code expression to compare elements of the array and the number of top elements. By default the first 10 elements in the order of appearance is returned. The comparison expression can use the following built-in variables:
-
lhs - left side element for comparison
-
rhs - right side element for comparison
Examples
-
Print 5 longest strings
select top(heap.objects('java.lang.String'), 'rhs.count - lhs.count', 5) -
Print 5 longest strings but print size as well.
select map(top(heap.objects('java.lang.String'),
 'rhs.count - lhs.count', 5), '{ length: it.count, obj: it }')
-
-
sumfunctionReturns the sum of all the elements of the given input array or enumeration. Optionally, accepts an expression as second param. This is used to map the input elements before summing those.
For example, return the sum of sizes of the reachable objects from each Properties object:
select sum(map(reachables(p), 'sizeof(it)'))
from java.util.Properties p

// or omit the map as in ...
select sum(reachables(p), 'sizeof(it)')
from java.util.Properties p
-
toArrayfunctionReturns an array that contains elements of the input array/enumeration.
-
uniquefunctionReturns an array/enumeration containing unique elements of the given input array/enumeration.
The following example selects a unique char[] instances referenced from strings. Note that more than one string instance can share the same char[] for the content.
// number of unique char[] instances referenced from any String
select count(unique(map(heap.objects('java.lang.String'), 'it.value')))

// total number of Strings
select count(heap.objects('java.lang.String'))
9.15.2.4 Other Examples
The following example prints a histogram of each class loader and number of classes loaded by it.
java.lang.ClassLoader has a private field called classes of type java.util.Vector and Vector has a private field named elementCount that is number of elements in the vector. The query selects multiple values (loader, count) using JavaScript object literal and map function. It sorts the result by count (i.e., number of classes loaded) using sort function with comparison expression.
select map(sort(map(heap.objects('java.lang.ClassLoader'),
'{ loader: it, count: it.classes.elementCount }'), 'lhs.count < rhs.count'),
'toHtml(it) + "<br>"')
The following example shows the parent-child chain for each class loader instance.
select map(heap.objects('java.lang.ClassLoader'),
      function (it) {
         var res = '';
         while (it != null) {
            res += toHtml(it) + "->";
            it = it.parent;
         }
         res += "null";
         return res + "<br>";
      })
Note that the parent field of java.lang.ClassLoader class is used and the example walks until the parent is null using the callback function to map call.
The following example prints the value of all System properties. Note that this query (and many other queries) may not be stable - because private fields of the Java platform classes may be modified or removed without any notification (implementation detail). But using such queries on user classes may be safe, given that you have control over the classes.
select map(filter(heap.findClass('java.lang.System').props.table, 'it != null && it.key != null && it.value != null'),
            function (it) {
                var res = it.key.toString() + ' = ' + it.value.toString();
                return res;
            });
-
java.lang.Systemhas static field by name 'props' of typejava.util.Properties. -
java.util.Propertieshas field by 'table' of typejava.util.Hashtable$Entry(this field is inherited fromjava.util.Hashtable). This is the hashtable buckets array. -
java.util.Hashtable$Entryhas key, value and next fields. Each entry points the next entry (or null) in the same hashtable bucket. -
java.lang.Stringclass has a value field of type char[].
9.16 Setting a Profiling Point
A profiling point is a marker in your source code that can invoke specific profiling actions. You set a profiling point in your code by using the context menu in the Source Editor or by using the toolbar in the Profiling Points window.
You can set the following types of profiling points:
-
Reset Results
-
Stopwatch
-
Take Snapshot
-
Load Generator
-
Timed Take Snapshot
-
Triggered Take Snapshot
You can use a profiling point to reset profiling results, take a snapshot or record the timestamp or execution time of a code fragment.
You can also use a profiling to stop and start a load generator script (requires the load generator plugin).
9.16.1 How to Set Profiling Points
Once you set a profiling point it becomes part of the project until you delete it. You can view, modify and delete the Profiling Points in your projects in the Profiling Points window. The Profiling Points window displays all profiling points in open projects. You can select a profiling point and then use the toolbar to edit, remove, enable and disable the profiling point.
To open the New Profiling Points window:
-
Choose Profile > Insert Profiling Points in the main menu
-
Locate the class where you want to add the profiling point and open the class in the Source Editor.
-
In the Source Editor, right-click in the line where you want to add the profiling point and choose Profiling > Insert Profiling Point to open the New Profiling Point wizard.
-
Select a profiling point type and the project and click Next.
-
Customize the properties of the profiling point, if necessary and click Finish.
When you click Finish, an icon representing the profiling point type appears in the sidebar of the Source Editor next to the line where you inserted the profiling point.
To enable and disable a profiling point:
-
Locate the class containing the profiling point and open the class in the Source Editor.
-
In the Source Editor, right-click in the left margin of the line containing the profiling point and choose Profiling Point > Disabled or Enabled.
To enable, disable, or customize the settings of a profiling point:
-
Choose Window > Profiling > Profiling Points.
To view details about a profiling point:
You can view information about a profiling point in the Profiling Points Report window. The information displayed is dependent on the profiling point type. Right-click a profiling point in the Profiling Points window and choose Show Report in the context menu to open this window.
9.16.2 How to Reset Profiling Results
You can use a profiling point to reset the collected profiling results each time that a thread in the application hits the profiling point. You can then use this profiling point to gather results deltas when combined with the Take Snapshot profiling point.
-
Click Add Profiling Point or Edit Profiling Point in the Profiling Points window.
-
Select the Reset Results profiling point type and select the desired project.
-
Click Next.
-
Specify a name that identifies that profiling point.
-
Specify the line number containing the profiling point and whether the profiling point is hit when a thread hits the beginning or end of that line (the file name is automatically filled in).
-
Click Finish.
9.16.3 How to Set a Stopwatch Profiling Point
You can obtain a timestamp each time that a profiling point is hit instead of calling the System.currentTimeMillis() method. Setting a Stopwatch profiling point lets you measure the time between the start and stop locations to obtain the execution time of a method fragment.
To set a Stopwatch profiling point:
-
Choose Window > Profiling > Profiling Points.
-
Click Add Profiling Point in the Profiling Points window.
-
Select the Stopwatch profiling point type and select the desired project.
-
Click Next.
-
Specify a name that identifies that profiling point.
-
Select whether you want to obtain a timestamp or a timestamp and the execution duration.
-
Specify the file in which to set the profiling point.
-
Specify the line number containing the profiling point at which point time measurement begins (the file name is automatically filled in).
-
If you selected Timestamp and duration, specify the line at which to stop the measurement (the file name is automatically filled in).
-
Click Finish.
9.17 Profiling Telemetry
The telemetry mode provides the following metrics:
-
CPU and GC—displays the CPU and GC percentage of use at a given time
-
Memory—displays in MB the heap size and used heap at a given time
-
Surviving Generations —displays the number of surviving generations at a given time. It also displays indicates the GC intervals
-
Threads and Classes—displays number of loaded classes and threads at a given time
To start a profiling telemetry session, see Section 9.9, "Starting a Profiling Session".
Figure 9-1 shows a snapshot of a telemetry session.
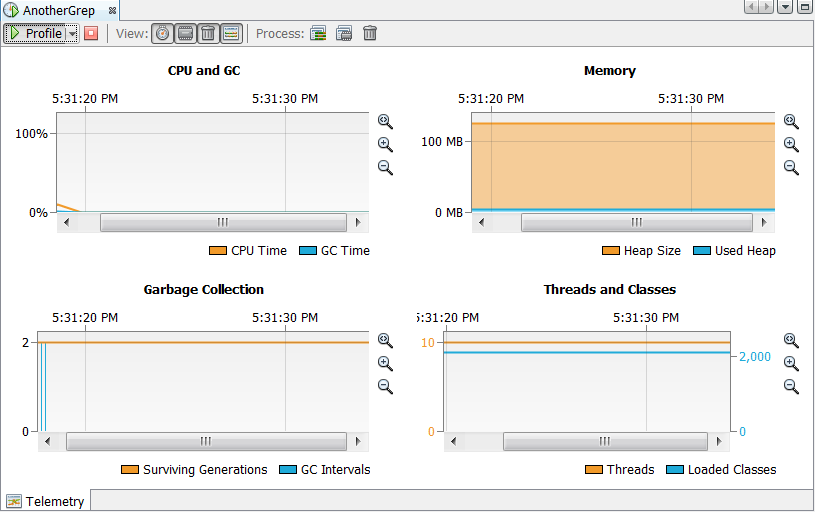
When running in the Telemetry mode the profiler monitors the target application with a very low overhead. A Thread Dump or Heap Dump can be taken from the profiled application. The garbage collection in the target VM can be requested using a toolbar button.
Each graph displays the full data for a profiling session and can be zoomed and panned separately by the control buttons and mouse wheel. A graph can be maximized to display more details by hiding the other graphs using the toolbar buttons.
For the description of the toolbar buttons see Section 9.9.3, "Understanding the Toolbar Icons".
For more information on profiling methods in NetBeans IDE, see http://wiki.netbeans.org/ProfilerTelemetry.
9.18 Profiling Methods
The methods profiling mode tracks methods call trees, execution times and invocations count if configured, enabling to measure and optimize application performance. Use this profiling mode if experiencing slow responses or optimizing algorithms for speed of execution.
Figure 9-2 shows a snapshot of a methods session.
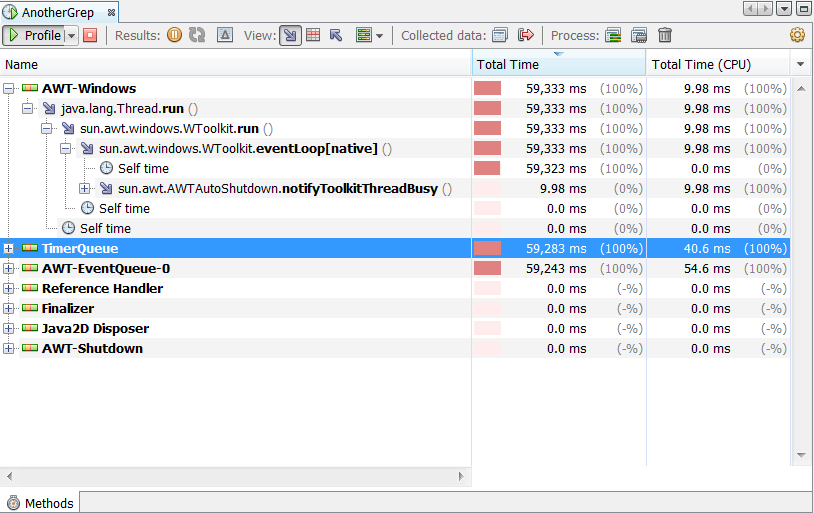
For the description of the toolbar buttons see Section 9.9.3, "Understanding the Toolbar Icons".
To start a profiling methods session, see Section 9.9, "Starting a Profiling Session".
9.18.1 Basic Methods Profiling Mode
The methods mode is designed to provide profiling data from all classes and methods without any initial setup. The methods mode provides metrics for methods and classes. The methods report allows you to view the data by Forward Calls, Hot Spots, and Reverse Calls by clicking on the appropriate icons.
Table 9-6 lists three different views on the methods data collected by the profiler.
| Methods View Name | Description |
|---|---|
|
Forward calls |
Shows the methods execution tree, from a thread down to single method calls. The Self time node represents execution time of the method, without any outgoing calls. |
|
Hot spots |
Shows a flat list of methods without the incoming/outgoing context. If sorted by the Self Time, it can immediately uncover an obvious performance bottleneck. |
|
Reverse calls |
Shows a flat list of methods for each thread and a tree of all execution points of these methods, transitively. It helps to discover the right call tree affected by a slowdown. |
You may also choose to Show Delta Values and Select Threads.
-
Show Delta Values. Switches from absolute values to incremental values. The values displayed prior to switching the view are remembered but the new view displays changes starting at the moment the new selection was made. Clicking this icon again resets the results back to absolute values.
-
Select Threads. Shows threads available in live results or a saved snapshot and allows you to select specific threads for displaying results. This feature is useful when tracking EDT slowness in desktop applications or analyzing worker threads in server applications. This feature merges results from the selected threads to a single tree.
Additionally, you may select the columns to be displayed; the options are Total Time, Total Time (CPU), Selected, and Hits/Invocations (depending on the session configuration).
9.18.1.1 Selecting Threads
By default results for all threads are displayed. By clicking the Select threads button it's possible to select just some threads and the methods executed by other threads won't be displayed in the results.
Initially the Show all threads option is selected, which means that results of all threads including any new threads started in future are displayed. Deselecting this option clears all selected threads, enabling to quickly select one desired thread. Clicking a thread in the Select thread table also deselects the option, but keeps the other threads selected, which makes it easier to remove just one thread from the results.
When the Show all threads option is deselected, the Merge selected threads becomes enabled. This option allows to merge methods executed from different threads into single call tree, simplifying analysis of profiling data from multiple worker threads.
9.18.1.2 Searching And Filtering Results
To find a method in results, either:
-
use the Find stripe which opens by invoking the Find action in results context menu or in the Edit menu
-
use the Ctrl - F keyboard shortcut
To filter collected results, either:
-
use the Filter stripe which opens by invoking the Filter action in the results context menu
-
use the Ctrl - G keyboard shortcut
For more information on profiling methods in NetBeans IDE, see http://wiki.netbeans.org/ProfilerMethods.
9.18.2 Advanced Methods Profiling Mode
To change the profiling modes and settings in the Settings pane, press the Settings switch in the Profiler window toolbar.
Table 9-7 lists the profiling modes the profiler offers with different profiling techniques and settings.
Table 9-7 Methods Profiling Modes
| Name | Description |
|---|---|
|
All classes |
Uses sampling and collects profiling data from methods of all classes. This mode is selected by default and doesn't require any additional configuration. |
|
Project classes |
Uses sampling and collects data from methods of projects classes. This mode doesn't require any additional configuration. |
|
Selected classes |
Uses bytecode instrumentation and collects data from methods of the defined classes. To use this mode, at least one class has to be selected for profiling. |
|
Selected methods |
Uses bytecode instrumentation and collects data from the defined methods. To use this mode, at least one method has to be selected for profiling. |
For more information on profiling methods in NetBeans IDE, see http://wiki.netbeans.org/ProfilerMethods.
9.18.3 Selecting Classes And Methods For Profiling
Selected classes or methods instruct the profiler from where to start collecting the profiling data. Once a JVM executes a selected method or the method of a selected class, the profiler starts collecting data of this method and all methods called by this method, transitively.
A class or method for instrumented profiling can be selected via:
-
Select Class or Select Method dialog. Allows to select one or several classes or methods from a project or .class/.jar file. Can be opened directly from the Methods Settings pane.
-
Code editor context menu. Provides Profile | Profile Class and Profile | Profile Method actions.
-
Navigator context menu. Provides Profile | Profile Class and Profile | Profile Method actions.
-
Profiling results. Live or saved Methods results provide Profile Class and Profile Method actions in the context menu. The Selected column is available to select methods for profiling. The column can be displayed using the right corner button in the view header by clicking the drop-down arrow (or right clicking the header on Mac OS X).
For more information on profiling methods in NetBeans IDE, see http://wiki.netbeans.org/ProfilerMethods.
9.18.4 Configuring Additional Options
Additional options define where to stop collecting the profiling data in order to lower the overhead and keep the profiling data clear and focused.
By default the profiler offers a limited subset of customizable options for an instrumented profiling session.
To enable the expert mode:
-
Choose Tools > Options > Java > Profiler > General from the main menu.
-
Select the Enable manual setup for Methods and Objects (expert users) checkbox.
For more information on the expert mode of profiling methods in NetBeans IDE, see http://wiki.netbeans.org/ProfilerExpertFeatures.
9.19 Profiling Objects
The objects mode provides a list of classes allocated to a project including live instances and bytes allocation.
Figure 9-3 shows a snapshot of an objects session.
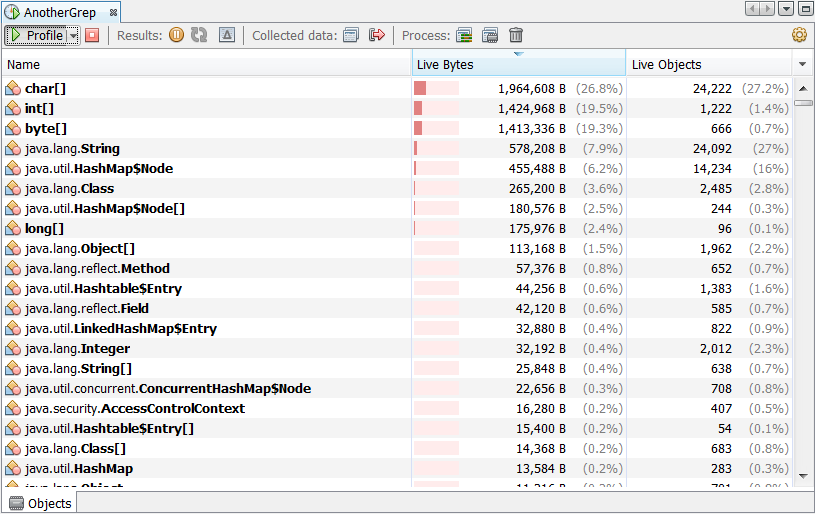
To select the classes to be profiled, click the Settings icon in the top-right corner and choose the required option in the drop-down menu:
-
All Classes. Shows all classes and object that are live on the Virtual Machine heap.
-
Project Classes. Allows to view only the classes defined in the project.
To start a profiling objects session, see Section 9.9, "Starting a Profiling Session".
For the description of the toolbar buttons see Section 9.9.3, "Understanding the Toolbar Icons".
For more information on profiling objects in NetBeans IDE, see http://wiki.netbeans.org/ProfilerObjects.
9.19.1 Basic Profiling
The Objects mode provides profiling data from all classes without any initial setup. Click the Profile or Attach button in the toolbar to start a profiling session.
9.19.1.1 Results View
The default results view shows a histogram of the classes currently live in the heap memory with instance numbers and sizes. The view provides data columns listed in Figure 9-3.
Table 9-8 Default Results View
| Column | Description |
|---|---|
|
Name |
Shows name of the class with live instances on heap. |
|
Live Bytes |
Shows the size of all instances of the class currently live on heap. |
|
Live Objects |
Shows the number of all instances of the class currently live on heap. |
Note:
The columns can be displayed or hidden using the right corner button in the view header by clicking the drop-down arrow (or right clicking the header on Mac OS X).9.19.1.2 Searching And Filtering Results
A class can be found in results using the Find stripe which opens by invoking the Find action in results context menu or IDE Edit menu or using the Ctrl-F keyboard shortcut. Values of the Name column are searched for the entered substring, optionally matching case if selected. Once a search has been performed, it can be repeated using the F3 or Shift+F3 shortcuts. Next appearance of the currently selected value of Name column can be found using the Ctrl+F3 shortcut.
Collected results can be filtered using the Filter stripe which opens by invoking the Filter action in results context menu or using the Ctrl-G keyboard shortcut. Values of the Name column are filtered by the entered substring depending on the selected filter mode (Contains, Does Not Contain, Regular Expression), optionally matching case if selected. When collecting the allocation stack traces, the top level class nodes are always displayed, only the allocating methods are filtered.
9.19.2 Advanced Profiling
To cover various use cases of objects profiling the profiler offers three profiling modes with different profiling techniques and settings. The modes and settings can be changed in the Settings pane which is displayed by pressing the Settings switch in Profiler window toolbar.
9.19.2.1 Objects Profiling Modes
Table 9-9 lists objects profiling modes.
Table 9-9 Objects Profiling Modes
| Name | Description |
|---|---|
|
All classes |
Uses sampling and shows histogram of live objects of all classes allocated on the heap, including instance numbers and sizes. |
|
Project classes |
Uses sampling and shows histogram of live objects of project classes allocated on the heap, including instance numbers and sizes. |
|
Selected classes |
Uses bytecode instrumentation and shows allocated or live instances of the defined classes including allocations stack traces if configured. To use this mode, at least one class has to be selected for profiling. |
9.19.2.2 Selecting Classes For Profiling
Selected classes instruct the profiler to track instances of these classes only, keeping the profiling overhead low. You can select a class or method for instrumented profiling by either:
-
Using the Select Class dialog. The dialog allows to select one or several classes from a project or .class/.jar file. It can be open directly from the Objects Settings pane.
-
From the code editor. Java code editor provides Profile > Profile Class action in its context menu.
-
From Navigator. Java Navigator provides Profile > Profile Class action in its context menu.
-
From profiling results. Live or saved Objects results provide Profile Class actions in its context menu. Also a special column Selected is available to select classes for profiling. The column can be displayed using the right corner button in the view header by clicking the drop-down arrow (or right-clicking the header on Mac OS X).
9.19.2.3 Configuring Additional Options
Based on the additional settings, the profiler can track either all allocated objects or just the objects currently live on the heap. It can also record allocation stack traces to visualize from where in the source code are the objects being created. The following options are available:
-
Track only live objects controls whether the profiler tracks all allocated objects from the beginning of the profiling session or last results reset (deselected) or whether the profiler tracks just the objects currently live in the heap memory (selected). When tracking only live objects, the profiler also provides a special metric Surviving Generations which helps to easily discover certain types of memory leaks.
-
Limit allocations depth controls whether the profiler collects allocation stack traces and sets the depth limit for the stacks. If deselected, the profiler collects full allocation stack traces. If selected, the value controls the maximum depth of allocation stacks. Zero value means no allocation stack traces are being collected.
The Objects profiling mode, selected Classes and additional options can be changed at any time during a running profiling session. The changes are applied by clicking the Apply button on the right side of the settings area.
9.19.2.4 Objects Views
In case the Track only live objects option is not selected, the following data columns are available:
-
Name column shows name of the class with allocated instances.
-
Allocated Bytes column shows the size of all allocated objects from the beginning of the profiling session or last results reset.
-
Allocated Objects column shows the number of all allocated objects from the beginning of the profiling session or last results reset.
In case the Track only live objects option is selected, the following data columns are available:
-
Name column shows name of the class with live instances.
-
Live Bytes column shows the size of all instances of the class currently live on heap.
-
Live Objects column shows the number of all instances of the class currently live on heap.
-
Allocated Objects column shows the number of all allocated objects from the beginning of the profiling session or last results reset.
-
Avg. Age average object age of all instances of the class currently live on heap measured by the number of survived garbage collections.
-
Surviving Generations column shows the number of different generations measured by the number of survived garbage collections.
Note:
To provide more control of which methods are to be profiled there is a special mode with fully manual setup of profiled classes and instrumentation filter.9.19.2.5 Expert Mode of Objects Profiling
Bytecode instrumentation is a powerful tool to analyze Java applications performance and memory management. However, the profiling overhead and amount of collected data is heavily dependent on the profiler configuration. Misconfigured settings may cause extreme slowdown of the profiled process or OutOfMemoryErrors being thrown by the NetBeans JVM due to too many data.
By default the profiler offers just a limited subset of customizable options for an instrumented profiling session to prevent the above mentioned problems. While this makes the instrumenting profiler a safe choice for most of the users, it doesn't provide the full power of the profiler engine to expert users. That's why there's a special mode Defined classes which allows detailed definition of the classes to be instrumented.
The expert mode needs to be enabled using Tools > Options > Java > Profiler > General > Enable manual setup for Methods and Objects. The currently opened profiler window needs to be closed and reopened after changing this option to enable the expert mode. The mode can be set by opening the Settings pane by the rightmost Settings button in the profiler window toolbar and selecting Defined classes.
For more information about defined classes mode of the objects profiling in NetBeans IDE, see http://wiki.netbeans.org/ProfilerExpertFeatures.
9.20 Profiling Threads
The threads mode allows you to view detailed information about application thread activity.
Figure 9-4 shows a snapshot of a threads session.
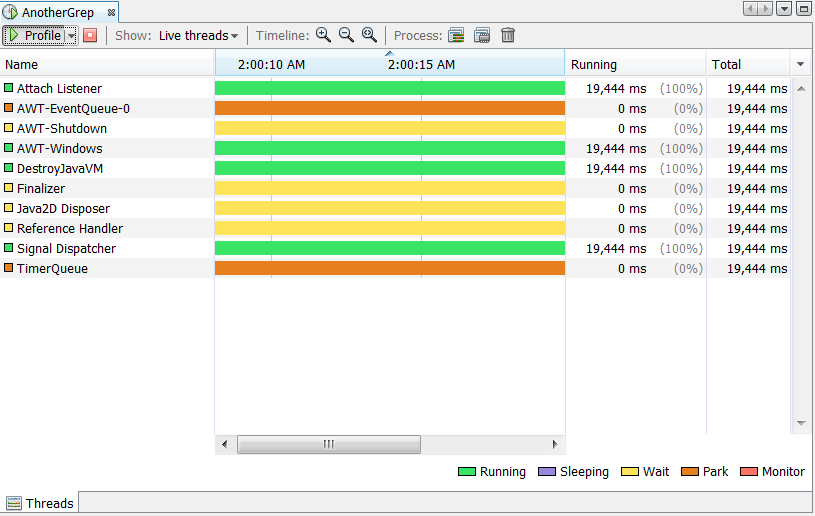
To start a profiling threads session, see Section 9.9, "Starting a Profiling Session".
For the description of the toolbar buttons see Section 9.9.3, "Understanding the Toolbar Icons".
Additionally, you may customize the threads you monitor by accessing the Live Threads drop-down list and choosing from the available options: All Threads, Live Threads (Default), Finished Threads, and Selected Threads.
For more information on profiling Threads in NetBeans IDE, see http://wiki.netbeans.org/ProfilerThreads.
9.21 Profiling Locks
The locks mode allows you to view details about locked threads and the threads that are monitoring and holding locks.
Figure 9-5 shows a snapshot of a locks session.
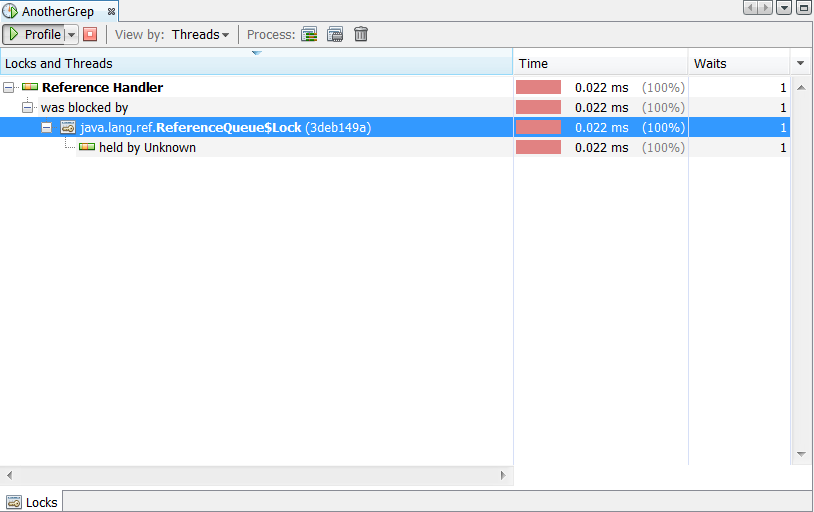
The Locks view displays threads and locks of the profiled process and their relation (thread T has been blocked by lock L owned by another thread X) and information about time spent by waiting and number of waits to acquire a lock.
To start a profiling lock session, see Section 9.9, "Starting a Profiling Session".
For the description of the toolbar buttons see Section 9.9.3, "Understanding the Toolbar Icons".
In the session window you can choose Threads or Monitors in the Threads drop-down list. Choose Threads to view locked threads. Expand the nodes to view the owners of the locks. Choose Monitors to view the threads that are locking other threads.
For more information on profiling locks in NetBeans IDE, see http://wiki.netbeans.org/ProfilerLocks.
9.22 SQL Queries Profiling
SQL queries profiling enables profiling calls from Java processes to databases using a JDBC connection. It allows you to analyze which queries have been invoked, how many times they have been initiated, and how long they took to run. SQL queries profiling helps you to see which SQL query causes the most contention within an application.
Table 9-9 shows a snapshot of a SQL Query session.
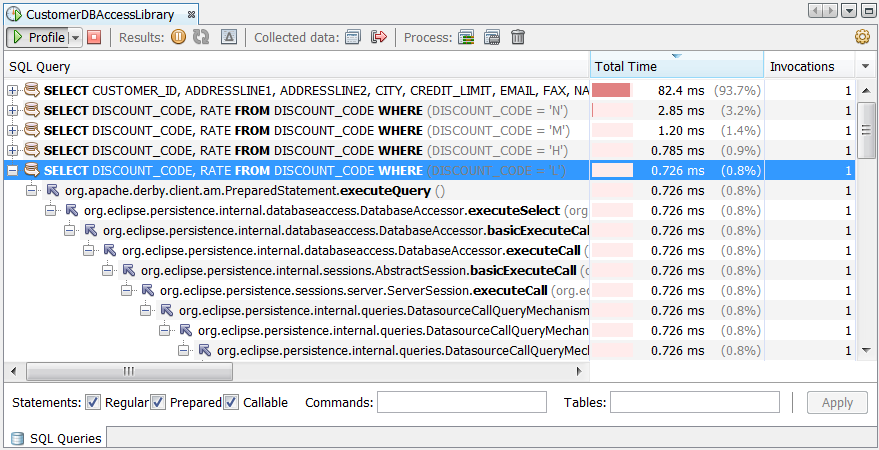
The SQL Query view displays a live list of executed SQL queries with their duration and execution counts, including the invocation paths. You can sort the content of each column by clicking a column heading and reorder columns by dragging and droping column headings.
To start a profiling lock session, see Section 9.9, "Starting a Profiling Session".
For the description of the toolbar buttons see Section 9.9.3, "Understanding the Toolbar Icons".
In the SQL Query session window you can perform the following actions:
-
View SQL Query. Displays the text of a query in the SQL Query Viewer window.
-
Copy Row. Copies the content of the row to the clipboard.
-
Copy SQL Query. Copies the content of the query to the clipboard.
-
Copy Total Time. Copies the total time of the query execution to the clipboard.
-
Copy Invocations. Copies the number of the selected query invocations to the clipboard.
-
Copy Statement Type. Copies the type of a SQL query to the clipboard.
-
Copy Command Type. Copies the type of a SQL command to the clipboard.
-
Copy Tables. Copies the name of a database table to the clipboard.
-
Find. Searches for the specified query content.
To switch between different profiling modes:
-
Click the Settings button in the toolbar.
-
Select the required option in the Profile drop-down list.
-
If the Defined queries option is selected, specify the text that the query must contain.
-
Click Apply.
To filter the collected queries in live results or snapshots:
-
Specify the filtering options - Statements, Commands, Tables - below the live results area.
-
Click Apply.
To visually filter out profiling results by coloring:
-
Choose Tools > Options from the main menu.
-
In the Options dialog box, select Java > Profiler.
-
In the Filters category, select the Use defined filters for coloring results option and click the Add new filter button.
-
In the Add Filter dialog window, specify the name and value of the new filter.
-
(Optional) Select the Color checkbox to define custom color for your filter results.
-
Click OK.
-
Click the pointing down triangle icon to the right of the table.
-
Select the name of the column to be displayed in the displayed menu.
9.23 Additional Functions when Running a Profiling Session
While the profiler session is in progress, additional actions related to the actual profiler mode are available in the toolbar of the profiler window. The following actions are always available:
Thread dump — creates a textual dump of all active threads and monitors of the profiled application. It shows what methods have been executed at the point of capturing the dump, thread by thread. This information is useful to view what the application is currently doing. The thread dump also contains information about locks, threads holding the locks, and threads waiting to acquire a lock. This data is essential when debugging deadlocks. To capture a Thread Dump, click the Thread Dump icon during the profiling session. To learn more about taking snapshots, see Appendix P.
Heap dump — saves an image of the current heap content of the profiled process in .hprof format and optionally opens it in heap browser. For more information, see Capturing Heap Dump Data.
GC — requests the JVM of the profiled process to invoke garbage collection. The JVM behavior for garbage collection is not defined in the JVM specification. It should do the garbage collection at some point, but there is no guarantee it will do it immediately or at all.
Additionally, when profiling Methods or Objects, the following actions are available:
Snapshot — creates a snapshot of all currently collected profiling data related to methods or objects. The snapshot opens in a separate window and can be saved to the project or to an external file. For more information, see Taking and Accessing Snapshots of Profiling Data.
Reset collected results — clears all currently collected profiling data related to methods or objects.
The other actions displayed in the toolbar of the profiler window are specific to the actual profiling mode. If multiple profiling modes are active in a profiling session, the toolbar displays actions available for the currently displayed modes.