Version 9.0.2
Part Number A90879-02
Home | Solution Area | Contents |
Index |
| Oracle9iAS Discoverer Plus User's Guide Version 9.0.2 Part Number A90879-02 |
|
This chapter explains how to use Discoverer's pivoting capabilities to arrange data on worksheets, and contains the following topics:
Pivoting worksheet data is how you rearrange data for more effective analysis. For example, when you move items from one axis to another to see new data relationships, you are pivoting the data. In the figure below, the Region item is moved from the body of a worksheet to the Page Items area. Moving the Region item to the Page Items area enables you to analyze one region at a time.
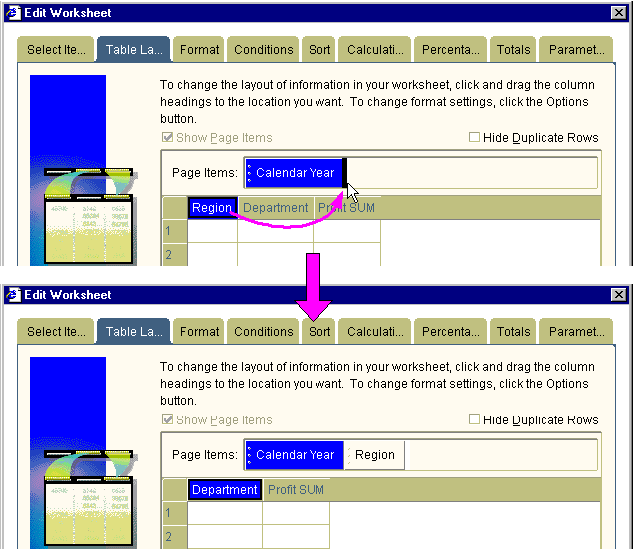
Pivoting is a powerful tool enabling you to explore data relationships that might initially be hidden.
Discoverer enables you to pivot items on a table worksheet by:
In the figure below, the Region item has been moved from the Page Items area to the body of the worksheet.
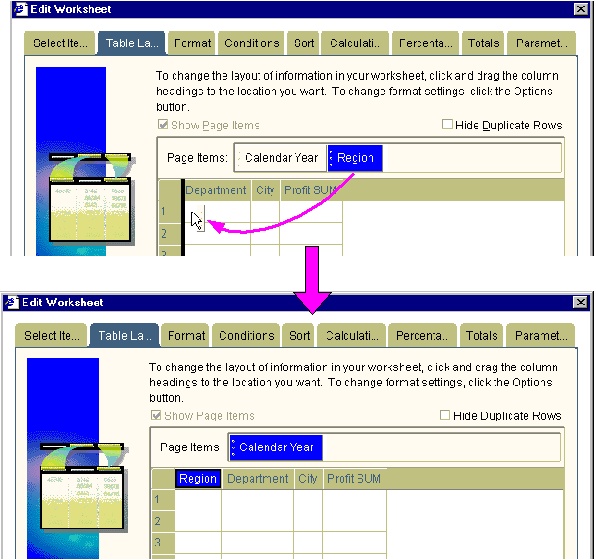
Discoverer enables you to pivot items on a crosstab worksheet in a similar way to pivoting on a table worksheet. In addition, you can pivot items to and from the left axis.
Because the data relationships on a crosstab depend on the intersection of the rows and columns, pivoting data from one axis to another creates a new set of data relationships.
In addition, pivoting worksheet data can add levels of data to an axis. For example, if the data on the left axis is organized into three levels (e.g. Region, City, and Store Name), pivoting the Year item to the side axis adds a fourth level of data to that axis.
Discoverer enables you to pivot items on a crosstab worksheet by:
The figure below shows how you might use the Crosstab layout dialog to arrange worksheet data. To begin with, you place:
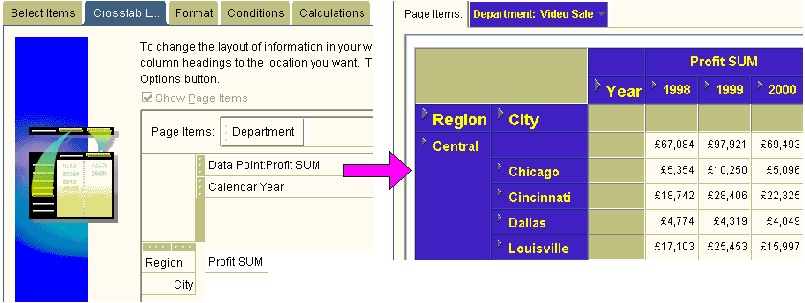
When you run the worksheet, the results are arranged as you specified (see the worksheet in the figure above).
You pivot data on a table worksheet to move items to and from the Page Items area, or to rearrange items. For example, you might want to move a Department item to the Page Items area so that you can analyze individual departments.
To pivot data on a table worksheet:
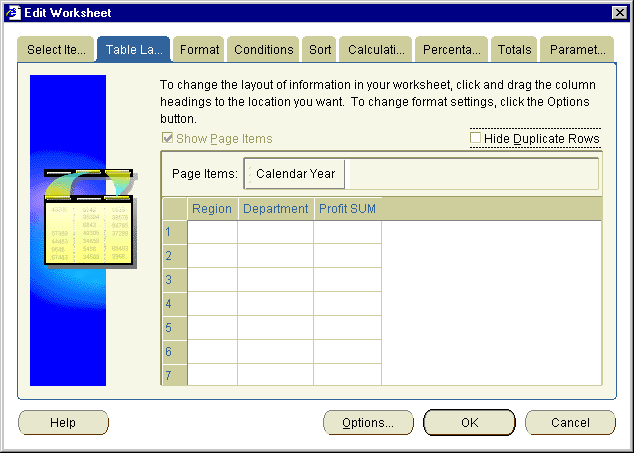
Text description of the illustration piv_tab.gif
The "Edit Worksheet dialog: Table Layout tab" shows the items on the worksheet and their current positions
You can select an item in the body of the worksheet or the Page Items area.
Hint: When you drag and drop items, a black line shows the item's new position on the worksheet.
Discoverer refreshes the worksheet according to the layout options you selected.
You typically pivot data on a crosstab worksheet to move items between the top and left axis. You can also move items to and from the Page Items area, and re-arrange items on each axis. For example, you might move an item from the left axis to the top axis to make data easier to analyze.
To pivot data on a crosstab worksheet:
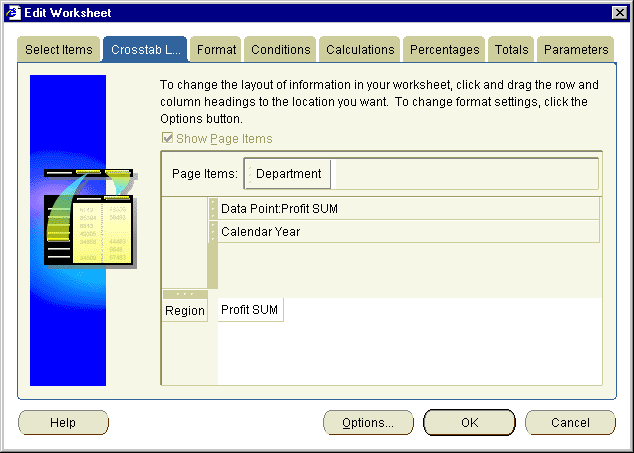
Text description of the illustration piv_ct.gif
The "Edit Worksheet dialog: Crosstab layout tab" shows the items on the worksheet and their current positions.
You can select an item in the body of the worksheet, in the left axis, in the top axis, or in the Page Items area.
Hint: When you drag and drop items, a black line shows the item's new position on the worksheet.
Discoverer refreshes the worksheet according to the layout options you selected.
Discoverer makes it easy to pivot data on worksheets. However, it is also easy to produce unexpected results.
For example, if you move everything from your left axis on a crosstab worksheet, you can produce a blank worksheet.
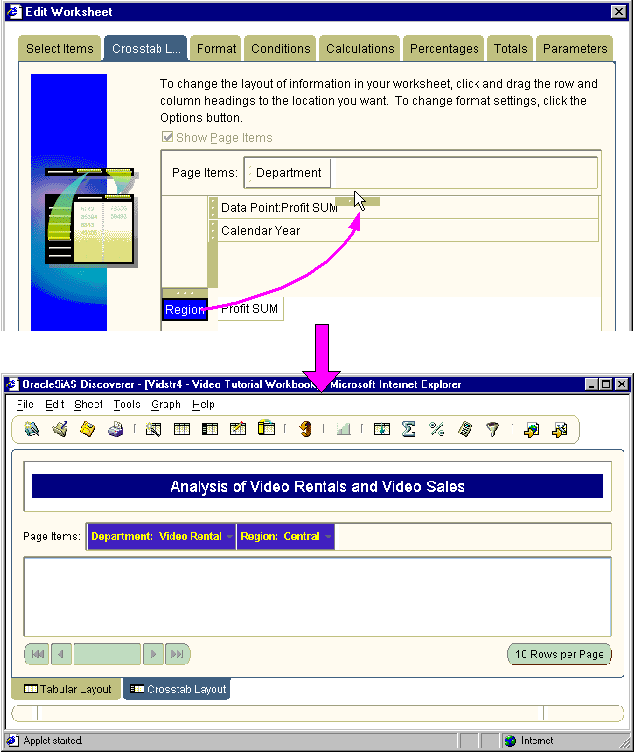
In the figure about, when the Region item is moved to the Page Items area, the resulting worksheet is empty. This is because you must have items on both the left axis and top axis to analyze data on a crosstab worksheet.
|
|
 Copyright © 2002 Oracle Corporation. All Rights Reserved. |
|