Release 2 (9.0.2)
Part Number A95102-02
Home |
Solution Area |
Contents |
Index |
| Oracle9i Application Server Performance Guide Release 2 (9.0.2) Part Number A95102-02 |
|
This chapter discusses how to monitor Oracle HTTP Server performance. Obtaining performance data can assist you in tuning Oracle9iAS or in tuning and debugging applications with performance problems.
This chapter contains the following topics:
The Oracle HTTP Server is a central and important part of most Oracle9iAS sites. Oracle HTTP Server handles nearly every request for dynamic data and many static data requests as well. By monitoring Oracle HTTP Server performance, you can identify and fix Oracle9iAS performance issues.
This section covers the following topics:
To monitor Oracle HTTP Server performance, the first step is to assess the workload (load).
When assessing the Oracle HTTP Server load, note the following:
Oracle Enterprise Manager provides Oracle HTTP Server performance data in the following categories:
|
See Also:
|
The Oracle Enterprise Manager status metrics provide information on CPU usage, memory usage, Oracle HTTP Server errors, and the number of active connections.
Figure 3-1 shows the Enterprise Manager HTTP Server status metrics page.
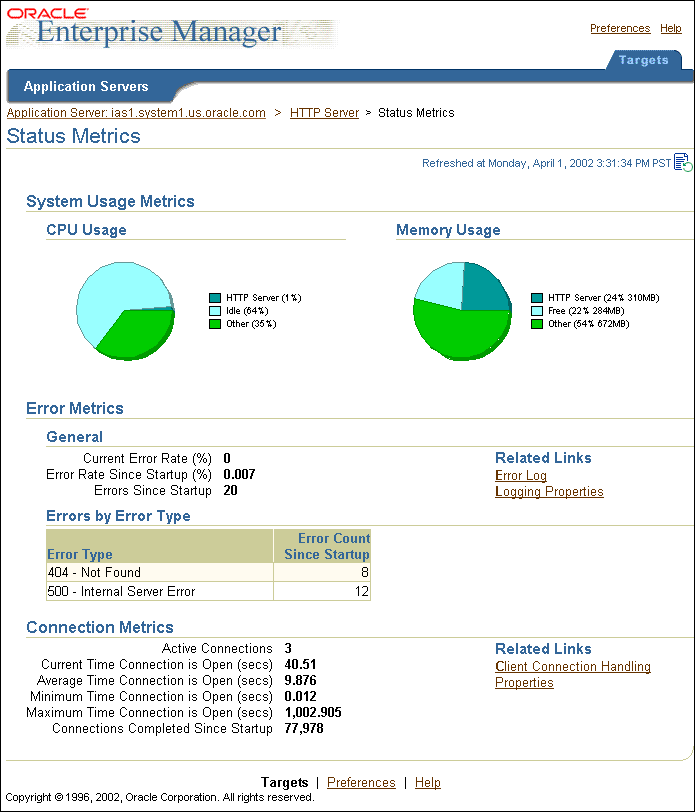
Figure 3-2 shows the Oracle Enterprise Manager Response and Load Metrics page. This page shows values for Oracle HTTP Server Active Requests and Request Throughput, and reports the average, minimum, and maximum processing time for requests. The values on the Response and Load Metrics page can help you assess the system load.
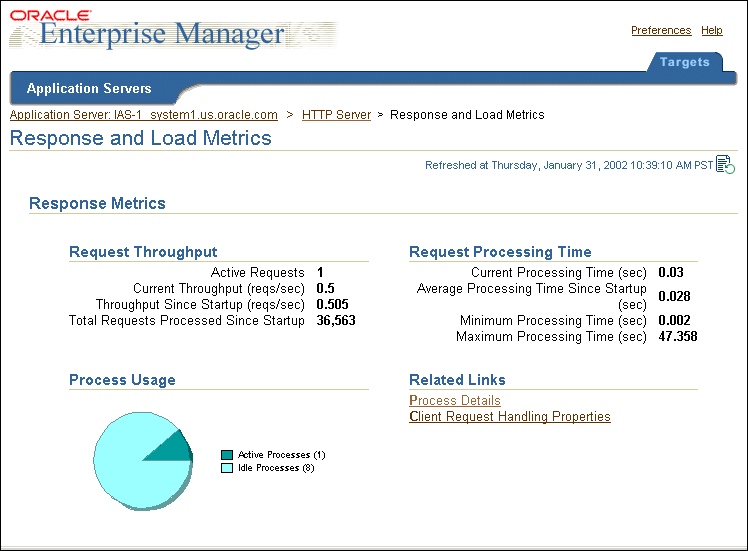
Text description of the illustration em_response_and_load.gif
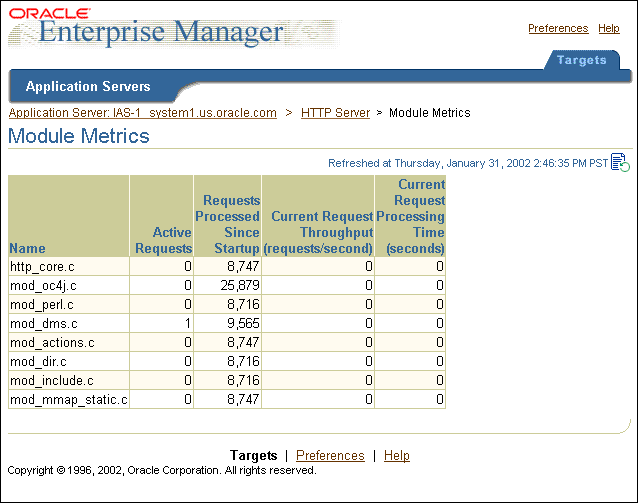
Figure 3-3 shows the Oracle Enterprise Manager Module Metrics page. The Module Metrics page shows the active and total requests processed by Oracle HTTP Server modules. The page only lists modules active since startup, meaning that the module has received 1 or more requests.
You should thoroughly investigate Oracle HTTP Server errors occurring on your site. Oracle HTTP Server errors may indicate acceptable activity, but they may also indicate security problems, configuration errors, or application bugs. Errors almost always affect Oracle9iAS performance. Error handling can slow down the normal processing for requests, or can appear to improve performance when the error handling abbreviates the processing required to handle a valid request.
Using Oracle Enterprise Manager you can view the Error Metrics on the HTTP status page, as shown in Figure 3-1. Error Metrics include the current error rate, which is the number of errors occurring in the last five minutes as a percentage of the total requests, the error rate since startup, and the count of the total number of errors since startup. The Status Metrics page includes the Errors by Error Type table shown in Figure 3-1 which lists more details for HTTP errors, including the error types and error counts. This table breaks down each error into a category based on its HTTP error response type.
The data values shown for Errors by Error Type in Figure 3-1 indicate that most of the errors were due to requests for unknown URIs (404 - Not Found errors). On many Oracle HTTP Server sites, Not Found errors are relatively common. However, you should investigate reports showing a large numbers of Not Found errors, such as a number that is greater than 1% of the total requests.
To investigate errors in more detail, such as any reported internal errors, examine the error log by selecting the Error Log link under the Related Links heading. Using the error log, you should be able to determine more information about the URIs that are causing specific errors.
If you notice a performance problem on the Oracle HTTP Server, then where possible you should drill down and categorize the problem. By refining the performance analysis you can learn more about the issue and direct your efforts to a component to help identify and resolve the problem.
Oracle Enterprise Manager can help you to categorize performance problems. You can identify where requests are being processed, or where a large percentage of request processing time is concentrated. Using Oracle Enterprise Manager allows you to categorize performance problems as follows:
Figure 3-3 shows the Module Metrics for Oracle HTTP Server modules (the report includes information for modules that have received 1 or more requests since startup). Using the Module Metrics, you should be able to identify the name of the module that processed a large number of requests, or identify a module where the processing time for an individual request is very large. By looking at the values for metrics listed in the Module Metrics table, you should be able to categorize Oracle9iAS performance by module.
When viewing the Module Metrics, note the following:
http_core.c module handles every request for static pages. If Oracle9iAS Web Cache is enabled, then use of http_core.c should be reduced. When you are using Oracle9iAS Web Cache, you should monitor requests processed by the http_core.c module to make sure that Oracle9iAS Web Cache effectively reduces static page activity for the Oracle HTTP Server.
mod_oc4j.c module. You should then drill down to review the information available for the OC4J of interest. Oracle Enterprise Manager provides extensive performance measurements for OC4J instances and J2EE applications.
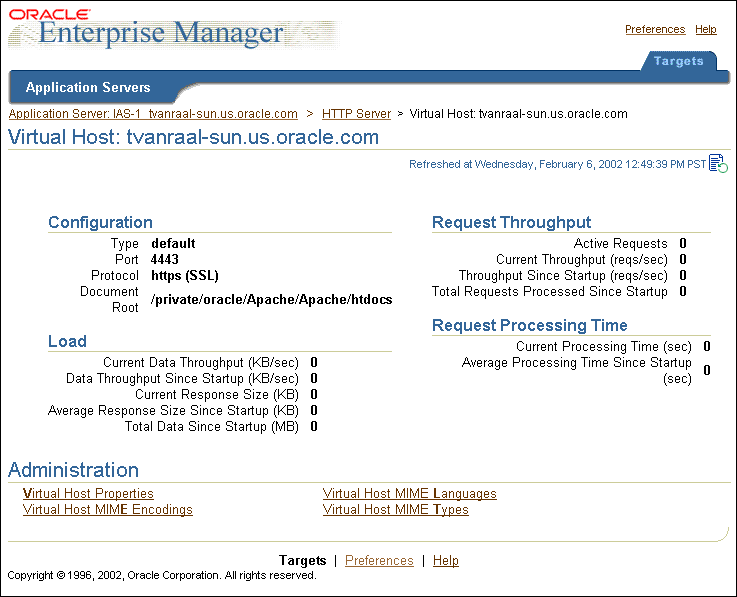
Figure 3-4 shows a display of the Virtual Host page. By viewing the Virtual Host page you should be able to obtain information about request processing by virtual host. The Request Throughput, Load, and Request Processing Time values provide information that enables you to identify a virtual host on your system that is processing a large number of requests, or that is using significant processing resources and may be stressing the system. This information should help you to categorize Oracle9iAS performance issues by virtual host.
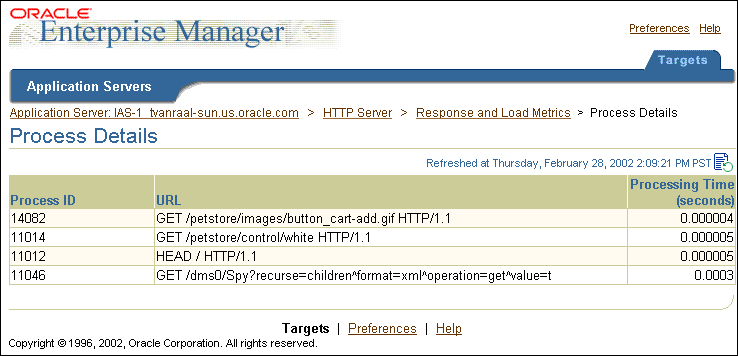
Running Oracle HTTP Server, usually you do not need to worry about which child server handles an individual request because any available child server can handle any incoming request (each request is handled by a free child server). However, if your Oracle9iAS system experiences delays or deadlocks, you may need to analyze the Oracle HTTP Server child server processes. The Process Details page available from Related Links section on the Response and Load Metrics page shows the Process ID for each active Oracle HTTP Server child process. Viewing this information allows you to monitor child servers to identify runtime problems, configuration errors, or application bugs that cause either request processing deadlocks or very long delays. In these situations analyzing the Process Details page can help determine where the deadlock or delay is occurring.
Figure 3-5 shows a Process Details page with Oracle HTTP Server child server information.
When viewing the Oracle HTTP Server Process Details page, note the following:
TimeOut directive.
|
See Also:
Oracle HTTP Server Administration Guide for information on the |
The Oracle HTTP Server is a central and important part of most Oracle9iAS sites. Oracle HTTP Server handles nearly every request for dynamic data and many static data requests as well. By monitoring Oracle HTTP Server performance, you can identify and fix Oracle9iAS performance issues.
This section covers the following topics:
To monitor Oracle HTTP Server performance, the first step is to assess workload.
When assessing the Oracle HTTP Server workload (load), note the following:
Oracle HTTP Server provides performance metrics which you can view using AggreSpy or dmstool. You can use these built-in performance tools to help you assess Oracle HTTP Server load by viewing the ohs_server metrics. Using AggreSpy, you can view the ohs_server metrics by choosing the ohs_server metric table in the left pane of the AggreSpy window.
Example 3-1 shows AggreSpy output for the ohs_server metric table using the Raw format.
 <DMSDUMP version='2.0' timestamp='1017345371143 (Thu Mar 28 11:56:11 PST 2002)'
id='3000' name='pdsun-perf9.us.oracle.com:7778'>
<statistics>
/pdsun-perf9.us.oracle.com [type=Host]
  /pdsun-perf9.us.oracle.com/Apache:2229:6200 [type=Process]
   /pdsun-perf9.us.oracle.com/Apache:2229:6200/Apache [type=ohs_server]
    internalRedirect.count:7418 ops
    numMods.value:45
    handle.maxTime:22205524 usecs
    handle.minTime:2 usecs
    handle.avg:14274 usecs
    handle.active:2 threads
    handle.time:997159521 usecs
    handle.completed:69858
    request.maxTime:22206941 usecs
    request.minTime:602 usecs
    request.avg:31537 usecs
    request.active:1 threads
    request.time:1033442848 usecs
    request.completed:32769
    connection.maxTime:1002008298 usecs
    connection.minTime:7254 usecs
    connection.avg:258721053 usecs
    connection.active:3 threads
    connection.time:152386700540 usecs
    connection.completed:589
    childFinish.count:0 ops
    childStart.count:11 ops
    lastConfigChange.value:1017260765
    busyChildren.value:1
    readyChildren.value:10
    numChildren.value:11
    responseSize.value:903136783
    error.count:1 ops
    post.count:0 ops
    get.count:32769 ops
</statistics>
</DMSDUMP>
The metric table shown in Example 3-1 groups metrics into categories, including handle, request, and connection. The individual metric names in each category have the form name.metric, for example, connection.time. The metrics in these three categories describe the following:
handle
The phase in which a request is handled by an HTTP server module. Note that a single request may be handled by more than one HTTP server module. The handle metrics shown at the top level, in the ohs_server metric table, are summarized for all of the HTTP server modules.
request
The phase during which an HTTP server daemon reads a request and sends a response for it (first byte in, last byte out). There may be more than one request serviced during a single connection phase. This would be the case if the HTTP parameter KeepAlive were set and utilized by clients.
connection
The connection phase, starting from the time an HTTP connection is established to the time it is closed.
To determine current Oracle HTTP Server load, examine the following ohs_server metrics:
These performance metrics indicate how many Oracle HTTP Server child servers are in use, and how many of them are actively processing requests. The data in Example 3-1 shows that 11 child servers are alive (numChildren.value), one of which is currently busy handling requests (busyChildren.value).
Oracle HTTP Server needs to keep enough child servers running to handle the usual load while allowing for normal load fluctuations. Oracle HTTP Server child servers handle exactly one request at a time, thus Oracle HTTP Server needs to run many child servers at once. If Oracle HTTP Server notices that the current load may exceed its default configuration, then it starts new child servers automatically. If the load is subsequently reduced, then Oracle HTTP Server terminates some of its child servers to save system resources.
If the configuration settings require that the Oracle HTTP Server start and stop child servers frequently, this can reduce system performance and may indicate that the system configuration needs to be adjusted. To determine whether Oracle HTTP Server child servers have been started and how many have finished, examine the following ohs_server metrics:
These performance metrics show the count of how many Oracle HTTP Server child servers have started and finished and can also provide an indication of the Oracle HTTP Server load. For the Oracle HTTP Server shown in Example 3-1, more than 11 child servers have been started and 0 finished.
The childStart.count and childFinish.count metric values could indicate that the instantaneous load for the Oracle HTTP Server exceeded the current load and also exceeded the range assumed by the default Oracle HTTP Server configuration parameters. When the count of child servers started and the count of child servers finished are both large, this could indicate that the Oracle HTTP Server could benefit by tuning the values of configuration parameters, including:
In the ohs_server metrics, the handle.avg, request.avg, and connection.avg metrics, and the handle.time, request.time, and connection.time values increase for each phase. The handle time will be the shortest and the connection time the longest. Figure 3-6 shows the relationship among these three phases for managing a user request.
If KeepAlive is on and clients use it, the duration of a connection may be much longer than the time required to perform a request and return a response, as illustrated in Figure 3-6. This is because the connection may remain open while a single client submits multiple requests.

|
See Also:
|
You should thoroughly investigate Oracle HTTP Server errors occurring on your site. Oracle HTTP Server errors may indicate acceptable activity, but they may also indicate security problems, configuration errors, or application bugs. Errors almost always affect Oracle9iAS performance. Error handling can slow down the normal processing for requests, or can appear to improve performance when the error handling abbreviates the processing required to handle a valid request.
Using dmstool or AggreSpy, you can investigate Oracle HTTP Server errors by viewing the ohs_server metrics. Example 3-1 includes the ohs_server metrics that provide an overview of error activity. The error.count metric is incremented whenever any request to Oracle HTTP Server results in an HTTP error response.
Use the ohs_responses metric table to investigate the details for error types and error counts. This table breaks down the total error.count value into HTTP response types. It also shows aggregate counts for successful HTTP requests and HTTP redirects.
Example 3-2 shows the AggreSpy report for the ohs_responses metric table in Raw format.
<DMSDUMP version='2.0' timestamp='1017345294216 (Thu Mar 28 11:54:54 PST 2002)'
id='3000' name='pdsun-perf9.us.oracle.com:7778'>
<statistics>
 /pdsun-perf9.us.oracle.com [type=Host]
  /pdsun-perf9.us.oracle.com/Apache:2229:6200 [type=Process]
   /pdsun-perf9.us.oracle.com/Apache:2229:6200/Apache [type=ohs_server]
    /pdsun-perf9.us.oracle.com/Apache:2229:6200/Apache/Responses [type=ohs_
responses]
  SvrErr_Not_Extended_510.count:        0 ops
  .
  .
  .
  CltErr_Method_Not_Allowed_405.count:  0 ops
  CltErr_Not_Found_404.count:   29 ops
  Redirect_NotModified_304.count:       23 ops
  Success_Created_201.count:    0 ops
  Success_OK_200.count: 10103 ops
  Info_Processing_102.count:    0 ops
 </statistics>
</DMSDUMP>
Example 3-2 shows that most of the errors were due to requests for unknown URIs (404 - Not Found errors). On many Oracle HTTP Server sites, Not Found errors are relatively common. However, you should investigate reports showing many Not Found errors, such as a number greater than 1% of the total requests.
You can examine the error_log and access_log files to determine the URIs that are causing errors, such as any reported internal errors (SvrErr_InternalError_500.count).
|
See Also:
Oracle HTTP Server Administration Guide for information on the Oracle HTTP Server |
If you notice a performance problem on the Oracle HTTP Server, then where possible you should drill down and categorize the problem. By limiting your search for a performance problem to a subset of Oracle HTTP Server, you can learn more about the issue and direct your efforts to identifying and solving the problem. Using the built-in performance tools you can categorize performance problems into one of several areas. You can identify where requests are being processed, or where a large percentage of request processing time is concentrated.
This section describes how you can categorize performance problems into different areas, including:
Use the ohs_module metrics to refine your analysis of performance problems to one or more modules. Showing the module metrics allows you to use the metric data to limit the search for performance problems to a particular module.
Example 3-3 shows AggreSpy raw format output for the ohs_module metric table.
<DMSDUMP version='2.0' timestamp='1017345223482 (Thu Mar 28 11:53:43 PST 2002)'
id='3000' name='pdsun-perf9.us.oracle.com:7778'>
<statistics>
/pdsun-perf9.us.oracle.com [type=Host]
  /pdsun-perf9.us.oracle.com/Apache:2229:6200 [type=Process]
   /pdsun-perf9.us.oracle.com/Apache:2229:6200/Apache [type=ohs_server]
    /pdsun-perf9.us.oracle.com/Apache:2229:6200/Apache/Modules [type=n/a]
     /pdsun-perf9.us.oracle.com/Apache:2229:6200/Apache/Modules/mod_mmap_
static.c [type=ohs_module]
      handle.maxTime:182 usecs
      handle.minTime:3 usecs
      handle.avg:5 usecs
      handle.active:0 threads
      handle.time:38942 usecs
      handle.completed:7562
      decline.count:7562 ops
        ...
       /Apache/Modules/mod_cgi.c [type=ohs_module]
        ...
        handle.avg:  199730 usecs
        ...
       /Apache/Modules/mod_perl.c [type=ohs_module]
        handle.maxTime:      768041 usecs
        ...
       /Apache/Modules/mod_fastcgi.c [type=ohs_module]
        ...
        handle.avg:  5866 usecs
        ...
       /Apache/Modules/mod_oc4j.c [type=ohs_module]
        handle.maxTime:      33676386 usecs
        handle.minTime:      165 usecs
        handle.avg:  5488 usecs
        handle.active:       0 threads
        handle.time: 317776833 usecs
        handle.completed:    57902
        decline.count:       0 ops
        ...
       /Apache/Modules/http_core.c [type=ohs_module]
        ...
        handle.completed:    93535
        ...
When viewing the Module Metrics, note the following:
http_core.c module handles every request for static pages. If Oracle9iAS Web Cache is enabled, then use of http_core.c should be reduced. If Oracle9iAS Web Cache is enabled the you should monitor the http_core.c metrics to make sure that Oracle9iAS Web Cache effectively prevents static page activity from reaching your Oracle HTTP Server.
mod_oc4j.c metrics shown in Example 3-3, if you recompute the request handling average using the following formula, you find that the recalculated average provides a more representative indication of typical response processing time:
new average = (time - min - max) / (completed - 2)
            = (317776833 - 165 - 33676386)/ (57902 - 2)
            = 4907 milliseconds
ohs_module metric table may show you that many requests were forwarded to OC4J through the mod_oc4j.c module. Oracle9iAS also provides extensive performance measurements for OC4J J2EE applications.
Use the ohs_virtualHost metrics to refine your analysis of performance problems by Oracle HTTP Server virtual host. Showing the virtual host metrics allows you to use the metric data to limit the search for performance problems to a subset of the Oracle HTTP Server.
Example 3-4 shows the AggreSpy raw format output for the ohs_virtualHost metric table.
<DMSDUMP version='2.0' timestamp='1017345119223 (Thu Mar 28 11:51:59 PST 2002)'
id='3000' name='pdsun-perf9.us.oracle.com:7778'>
<statistics>
 /pdsun-perf9.us.oracle.com [type=Host]
  /pdsun-perf9.us.oracle.com/Apache:2229:6200 [type=Process]
   /pdsun-perf9.us.oracle.com/Apache:2229:6200/Apache [type=ohs_server]
    /pdsun-perf9.us.oracle.com/Apache:2229:6200/Apache/Virtual_Hosts [type=n/a]
     /pdsun-perf9.us.oracle.com/Apache:2229:6200/Apache/Virtual_
Hosts/pdsun-perf9.us.oracle.com [type=ohs_virtualHost]
      responseSize.value:       0
      request.maxTime:  0 usecs
      request.minTime:  0 usecs
      request.avg:      0 usecs
      request.active:   0 threads
      request.time:     0 usecs
      request.completed:        0
</statistics>
</DMSDUMP>
Running Oracle HTTP Server, usually you do not need to worry about which child server handles an individual request because any available child server can handle any incoming request (each request is handled by a free child server). However, if your Oracle9iAS system experiences delays or deadlocks, you may need to analyze the Oracle HTTP Server child server metrics. These metrics allow you to monitor child servers to identify runtime problems, configuration errors, or application bugs that cause either request processing deadlocks or very long delays. In these situations analyzing the Oracle HTTP Server child server metrics can help determine where the deadlock or delay is occurring.
Use the ohs_child metric table to refine your analysis of performance problems to one or more Oracle HTTP Server child servers.
Example 3-5 shows the AggreSpy raw format output for the ohs_child metric table.
The ohs_child metric table shows the top ten Oracle HTTP Server child servers sorted by time spent on current requests. For the metrics shown in Example 3-5, the top entry has been executing for 117 million microseconds, which is nearly two minutes. The ohs_child metrics include the URL associated with the request and the process identifier for each Oracle HTTP Server child server listed.
/Apache [type=ohs_server]
      /Apache/Children [type=n/a]
       /Apache/Children/Child00 [type=ohs_child]
        time.value:  117045690 usecs
        pid.value:   2466
        status.value:        writing
        url.value:   GET /cgi-bin/deadlock HTTP/1.1
        slot.value:  2
       /Apache/Children/Child01 [type=ohs_child]
        time.value:  5 usecs
        pid.value:   2469
        status.value:        writing
        url.value:   GET /dms0/Spy?name=/Apache/Children HTTP/1.1
        slot.value:  5
       /Apache/Children/Child02 [type=ohs_child]
        time.value:  4 usecs
        pid.value:   2465
        status.value:        keepalive
        url.value:   HEAD / HTTP/1.1
        slot.value:  1
       /Apache/Children/Child03 [type=ohs_child]
        time.value:  2 usecs
        pid.value:   7591
        status.value:        writing
        url.value:   GET /fcgi-bin/echo HTTP/1.0
        slot.value:  8
When viewing the Oracle HTTP Server child server metrics, note the following:
ohs_child metric value pid.value to identify and terminate a deadlocked Oracle HTTP Server child server.
TimeOut directive.
|
See Also:
Oracle HTTP Server Administration Guide for information on the |
|
|
 Copyright © 2002 Oracle Corporation. All Rights Reserved. |
|