Skip Headers

Oracle9i Application Server Performance Guide
Release 2 (9.0.2) for UNIX

Part Number A95102-01
Go To Documentation Library
Home
Go To Table Of Contents
Contents
Go To Index
Index

Go to previous page Go to next page

A
Oracle9iAS Performance Metrics

This appendix lists metrics that can help you analyze Oracle9iAS performance. The metrics fall into several distinct areas, such as Oracle HTTP Server, Oracle9iAS Containers for J2EE (OC4J), and Portal. Each table in this chapter lists the metrics that are included in a corresponding DMS metric table.

This appendix contains:

Oracle HTTP Server Metrics

The tables, Table A-1,Table A-2, Table A-3 describe the Oracle HTTP Server metrics.

The metric table name is ohs_server.

Table A-1  HTTP Server Metrics (ohs_server)
Metric Description Unit

handle.maxTime

Maximum time spent in module handler

usecs

handle.minTime

Minimum time spent in module handler

usecs

handle.avg

Average time spent in module handler

usecs

handle.active

Chile servers currently in the handle processing phase

threads

handle.time

Total time spent in module handler

usecs

handle.completed

Number of times the handle processing phase has completed

ops

request.maxTime

Maximum time required to service an HTTP request

usecs

request.minTime

Minimum time required to service an HTTP request

usecs

request.avg

Average time required to service an HTTP request

usecs

request.active

Child servers currently in the request processing phase

threads

request.time

Total time required to service HTTP requests

usecs

request.completed

Number of HTTP request completed

ops

connection.maxTime

Maximum time spent servicing any HTTP connection

usecs

connection.minTime

Minimum time spent servicing any HTTP connection

usecs

connection.avg

Average time spent servicing HTTP connections

usecs

connection.active

Number of connections currently open

threads

connection.time

Total time spent servicing HTTP connections

usecs

Aggregate Module Metrics

Table A-2  Apache/Modules Metrics
Metric Description Unit

numMods.value

Number of loaded modules

HTTP Server Module Metrics

There is one set of metrics for each module loaded into the server.

The metric table name is ohs_module.

Table A-3  Apache/Modules/mod_*.c Metrics (ohs_module)
Metric Description Unit

decline.count

Number of requests declined

ops

handle.maxTime

Maximum time required for this module

usecs

handle.minTime

Minimum time required for this module

usecs

handle.avg

Average time required for this module

usecs

handle.active

Number of requests currently being handled by this module

requests

handle.time

Total time required for this module

usecs

handle.completed

Number of requests handled by this module

ops

JVM Metrics

There is one set of metrics for each Java process (OC4J or Jserv) currently running in the site. The metric table name is JVM.

Table A-4  JVM Metrics (JVM)
Metric Description Unit

activeThreadGroups.value

The number of active thread groups in the JVM

integer

activeThreadGroups.minValue

The minimum number of active thread groups in the JVM

integer

activeThreadGroups.maxValue

The maximum number of active thread groups in the JVM

integer

activeThreads.value

The number of active threads in the JVM

threads

activeThreads.minValue

The minimum number of active threads in the JVM

threads

activeThreads.maxValue

The maximum number of active threads in the JVM

threads

upTime.value

Up time for the JVM

msecs

freeMemory.value

The amount of heap space free in the JVM

KB

freeMemory.minValue

The minimum amount of heap space free in the JVM

KB

freeMemory.maxValue

The maximum amount of heap space free in the JVM

KB

totalMemory.value

The total amount of heap space in the JVM

KB

totalMemory.minValue

The minimum amount of total heap space in the JVM

KB

totalMemory.maxValue

The maximum amount of total heap space in the JVM

KB

JDBC Metrics

The following tables list the JDBC metrics collected in Oracle9iAS.

JDBC Driver Metrics

There is one set of JDBC Driver metrics per JVM. The metric table name is JDBC_Driver.

Table A-5  /JDBC/Driver - JDBC_Driver Metrics
Metric Description Unit

ConnectionCloseCount.count

Total number of connections that have been closed.

ops

ConnectionCreate.active

Current number of threads creating connections.

ops

ConnectionCreate.avg

Average time spent creating connections.

msecs

ConnectionCreate.completed

Number of times this PhaseEvent has started and ended.

ops

ConnectionCreate.maxTime

Maximum time spent creating connections.

msecs

ConnectionCreate.minTime

Minimum time spent creating connections.

msecs

ConnectionCreate.time

Time spent creating connections.

msecs

ConnectionOpenCount.count

Total number of connections that have been opened.

ops

JDBC Data Source Metrics

The metric table name is JDBC_DataSource.

There is one set of data source metrics per data source.

Table A-6  /JDBC/data-source-name - JDBC_Data Source Metrics
Metric Description Unit

CacheFreeSize.value

Number of free slots in the connection cache.

CacheGetConnection.avg

Average time spent getting a connection from the cache.

msecs

CacheGetConnection.completed

Number of times this PhaseEvent has started and ended.

ops

CacheGetConnection.maxTime

Maximum time spent getting a connection from the cache.

msecs

CacheGetConnection.minTime

Minimum time spent getting a connection from the cache.

msecs

CacheGetConnection.time

Time spent getting a connection from the cache or not.

msecs

CacheHit.count

Number of times a request for a connection has been satisfied from the cache.

CacheMiss.count

Number of times a request for a connection failed to be satisfied from the cache.

CacheSize.value

Total size of the connection cache.

JDBC Driver Specific Connection Metrics

The metric table name is JDBC_Connection. There is one set of JDBC Connection metrics per connection.

Table A-7  /JDBC/Driver/CONNECTION - JDBC Driver Connection Metrics
Metric Description Unit

CreateNewStatement.avg

Average time spent creating a new statement.

msecs

CreateNewStatement.completed

Number of times a request for a statement failed to be satisfied from the cache.

ops

CreateNewStatement.maxTime

Maximum time spent creating a new statement.

msecs

CreateNewStatement.minTime

Minimum time spent creating a new statement.

msecs

CreateNewStatement.time

Time spent creating a new statement.

msecs

CreateStatement.avg

Average time spent getting a statement from the statement cache.

msecs

CreateStatement.completed

Number of times a request for a statement was satisfied from the cache.

ops

CreateStatement.maxTime

Maximum time spent getting a statement from the statement cache.

msecs

CreateStatement.minTime

Minimum time spent getting a statement from the statement cache.

msecs

CreateStatement.time

Time spent getting a statement from the statement cache.

msecs

LogicalConnection.value

If this is a physical connection, then this refers to its logical connection, if any.

JDBC Data Source Specific Connection Metrics

The metric table name is JDBC_Connection. There is one set of JDBC data source specific connection metrics per data source per connection.

Table A-8  /JDBC/data-source-name/CONNECTION - JDBC Datasource Connection Metrics
Metric Description Unit

CreateNewStatement.avg

Average time spent creating a new statement.

msecs

CreateNewStatement.completed

Number of times a request for a statement failed to be satisfied from the cache.

ops

CreateNewStatement.maxTime

Maximum time spent creating a new statement.

msecs

CreateNewStatement.minTime

Minimum time spent creating a new statement.

msecs

CreateNewStatement.time

Time spent creating a new statement.

msecs

CreateStatement.avg

Average time spent getting a statement from the statement cache.

msecs

CreateStatement.completed

Number of times a request for a statement was satisfied from the cache.

ops

CreateStatement.maxTime

Maximum time spent getting a statement from the statement cache.

msecs

CreateStatement.minTime

Minimum time spent getting a statement from the statement cache.

msecs

CreateStatement.time

Time spent getting a statement from the statement cache.

msecs

LogicalConnection.value

If this is a physical connection, then this refers to its logical connection, if any.

JDBC Driver Statement Metrics

The metric table name is JDBC_Statement.

There is a set of statement metrics per connection per statement.


Note:

The JDBC statement metrics are only available when JDBC statement caching is enabled.


Table A-9  /JDBC/Driver/CONNECTION/STATEMENT JDBC Statement Metrics
Metric Description Unit

Execute.time

The time this statement has spent executing the SQL including the first fetch.

msecs

Fetch.time

The time this statement has spent in other fetches.

msecs

SQLText.value

The SQL being executed.

JDBC Data Source Statement Metrics

The metric table name is JDBC_Statement.

There is a set of statement metrics per data source per connection per statement.


Note:

The JDBC statement metrics are only available when JDBC statement caching is enabled.


Table A-10  /JDBC/data-source-name/CONNECTION/STATEMENT JDBC Statement Metrics
Metric Description Unit

Execute.time

The time this statement has spent executing the SQL including the first fetch.

msecs

Fetch.time

The time this statement has spent in other fetches.

msecs

SQLText.value

The SQL being executed.

J2EE Application Metrics - OC4J Metrics

Figure A-1 illustrates the metrics in a J2EE application.
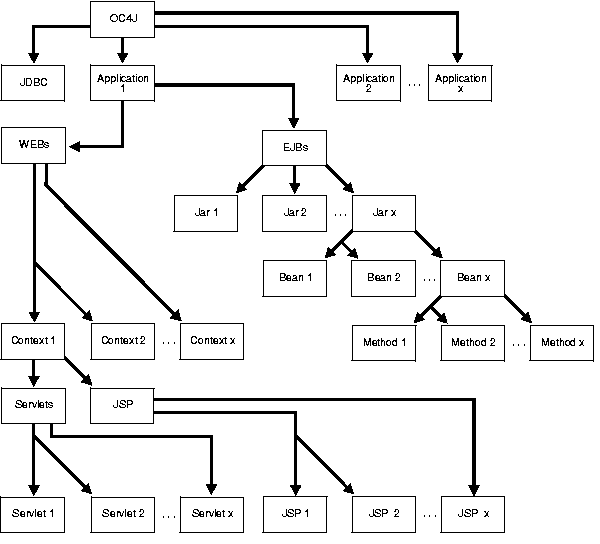
Figure A-1 Structure of Performance Metrics for a J2EE Application

Text description of asper006.gif follows

Text description of the illustration asper006.gif

Web Module Metrics

There is one set of metrics for each Web module within each J2EE application.

The metric table name is oc4j_web_module.

Table A-11  OC4J/application/WEBs Metrics
Metric Description Unit

processRequest.time

Total time spent servicing this application's web requests

msecs

processRequest.
completed

Number of web requests processed by this application

ops

processRequest.minTime

Minimum time spent servicing a web request

msecs

processRequest.maxTime

Maximum time spent servicing a web request

msecs

processRequest.avg

Average time spent servicing web requests

msecs

processRequest.active

Current number of threads servicing web requests

resolveContext.time

Total time spent to create/find the servlet context. Each web module (WAR) maps to a servlet context

msecs

resolveContext.
completed

Count of completed context resolves

ops

resolveContext.minTime

Minimum time spent to create/find the servlet context

msecs

resolveContext.maxTime

Maximum time spent to create/find the servlet context

msecs

resolveContext.avg

Average time spent to create/find the servlet context

msecs

resolveContext.active

Current number of threads trying to create/find the servlet context

parseRequest.time

Total time spent to read/parse requests from the socket

msecs

parseRequest.completed

Number of web requests that have been parsed

ops

parseRequest.minTime

Minimum time spent to read/parse requests

msecs

parseRequest.maxTime

Maximum time spent to read/parse requests

msecs

parseRequest.avg

Average time spent to read/parse requests

msecs

parseRequest.active

Current number of threads trying to read/parse AJP or HTTP requests

Web Context Metrics

There is one set of metrics for each Web context module within each J2EE application.

The metric table name is oc4j_context.

Table A-12  OC4J/application/WEBs/context Metrics
Metric Description Unit

resolveServlet.time

Total time spent to create/locate servlet instances (within the servlet context)

msecs

resolveServlet.completed

Total Number of lookups for a servlet by OC4J

ops

resolveServlet.minTime

Minimum time spent to create/locate the servlet instance (within the servlet context)

msecs

resolveServlet.maxTime

Maximum time spent to create/locate the servlet instance (within the servlet context)

msecs

resolveServlet.avg

Average time spent to create/locate the servlet instance (within the servlet context)

msecs

sessionActivation.active

Number of active sessions

ops

sessionActivation.time

Total time in which sessions have been active

msecs

sessionActivation.completed

Number of session activations

ops

sessionActivation.minTime

Minimum time a session was active

ops

sessionActivation.maxTime

Maximum time a session was active

msecs

sessionActivation.avg

Average session lifetime

msecs

service.time

Total time spent servicing requests

msecs

service.completed

Total number of requests serviced

ops

service.minTime

Minimum time spent servicing requests

msecs

service.maxTime

Maximum time spent servicing requests

ops

service.avg

Average time spent in servicing the servlet

msecs

service.active

Current number of requests active

msecs

Servlet Metrics

There is one set of metrics for each servlet in each Web module within each J2EE application.

The metric table name is oc4j_servlet.

Table A-13  OC4J/application/WEBs/context /SERVLETS/servlet Metrics
Metric Description Unit

service.time

Total time spent on the servlet's service() call

msecs

service.completed

Total number of calls to service()

service.minTime

Minimum time spent on a servlet's service() call

msecs

service.maxTime

Maximum time spent on a servlet's service() call

ops

service.avg

Average time spent in servicing the servlet

msecs

service.active

Current number of threads servicing this servlet

msecs

JSP Metrics

JSP Runtime Metrics

There is one set of metrics for each Web context for each J2EE application.

The metric table name is oc4j_jspExec.

Table A-14  OC4J/application/WEBs/context /JSP Metrics
Metric Description Unit

processRequest.time

Time spent processing requests for JSPs

Only used for Context/Application name

msecs

processRequest.completed

Number of requests for JSPs processed by this application

ops

processRequest.minTime

Minimum time spent processing requests for JSPs

msecs

processRequest.maxTime

Maximum time spent processing requests for JSPs

msecs

processRequest.avg

Average time spent processing requests for JSPs

msecs

processRequest.active

Current number of active requests for JSPs

JSP Metrics

There is one set of metrics for each JSP in each Web module. the data for availableInstance.* appears only for non-threadsafe JSPs.

The metric table name is oc4j_jsp.

Table A-15  OC4J/application/WEBs/context /JSPjsp_name Metrics
Metric Description Unit

service.time

Time to serve a JSP (that is, actual execution time of the JSP)

msecs

service.completed

Number of requests for JSPs processed by this JSP

ops

service.minTime

Minimum time spent servicing the JSP

msecs

service.maxTime

Maximum time spent servicing the JSP

msecs

service.avg

Average time spent servicing the JSP

msecs

service.active

Current number of active requests for the JSP

availableInstances.value

Number of available (that is, created) instances.

Only used when threadsafe=false

instances

activeInstances.value

Number of active instances. Only used when threadsafe=false

instances

EJB Metrics

EJB Bean Metrics

Oracle9iAS provides a set of these metrics for each type of bean in each EJB jar file in each J2EE application.

The metric table name is oc4j_ejb_entity_bean.

Table A-16  OC4J/application/EJBs/ejb-jar-module/ejb-name Metrics
Metric Description Unit

transaction-type.value

Transaction type.

Possible values: container or bean

session-type.value

Session type.

Possible values: stateful or stateless

bean-type.value

Bean type

Possible values: session or entity bean

exclusive-write-access.value

Exclusive write access value

Possible values: true or false

isolation.value

Isolation value.

Possible values: serializable, uncommitted, committed, repeatable_read, none

persistence-type.value

Persistence type:

Possible values: bean or entity bean

EJB Method Metrics

There is one set of metrics for each method within each type of EJB bean.

The metric table name is oc4j_ejb_method.

The client.* metrics show values for the actual implementation of the method. The wrapper.* metrics show values for the wrapper that was automatically generated for the method.

See Also:

Chapter 6, "Advanced EJB Subjects" in Oracle9iAS Containers for J2EE Enterprise JavaBeans Developer's Guide and Reference for information on automatically generated wrappers.

Table A-17  OC4J/application/EJBs/ejb-jar-module/ejb-name/method-name Metrics
Metric Description Unit

client.time

Time spent inside the actual implementation of this method

msecs

client.completed

Number of requests for beans processed by this application

ops

client.minTime

Minimum time spent inside the actual implementation of this method

msecs

client.maxTime

Maximum time spent inside the actual implementation of this method

msecs

client.avg

Average time spent inside the actual implementation of this method

msecs

client.active

Current number of threads accessing the actual implementation of this method

wrapper.time

Time spent inside the automatically generated wrapper method. Note: Not all the wrapper methods invoke the actual bean implementation at runtime (for example, create method in a stateless bean). This means that the time spent in the wrapper code could be less than the time spent in the bean implementation

msecs

wrapper.completed

Number of requests for beans processed by this application

ops

wrapper.minTime

Minimum time spent inside the automatically generated wrapper method

msecs

wrapper.maxTime

Maximum time spent inside the automatically generated wrapper method

msecs

wrapper.avg

Average time spent inside the automatically generated wrapper method

msecs

wrapper.active

Current number of threads accessing the automatically generated wrapper method

trans-attribute.value

Transaction attribute. Possible values: NotSupported, Supports, RequiresNew, Mandatory, and Never

ejbPostCreate.time

Time spent in the ejbPostCreate method (entity beans)

msecs

ejbPostCreate.completed

Number of times this ejbPostCreate has been called

ops

ejbPostCreate.minTime

Minimum time spent in ejbPostCreate

msecs

ejbPostCreate.maxTime

Maximum time spent in ejbPostCreate

msecs

ejbPostCreate.avg

Average time spent in ejbPostCreate

msecs

ejbPostCreate.active

Current number of threads executing ejbPostCreate

Portal Metrics

This section describes the Oracle9iAS Portal metrics.

Figure A-2, "mod_plsql Metric Tree" shows the structure of the mod_plsql metrics. The tables in this section describe the relevant metrics.
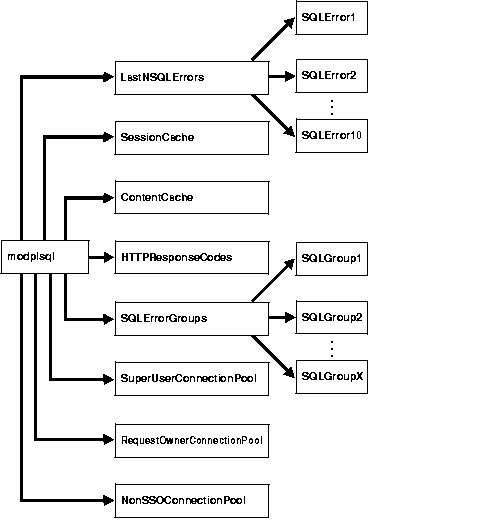
Figure A-2 mod_plsql Metric Tree

Text description of asper009.gif follows

Text description of the illustration asper009.gif

The /modplsql/HTTPResponseCodes Metrics lists the response codes returned by mod_plsql.

The metric table name is modplsql_HTTPResponseCodes. This metric table includes one metric containing the count, number of times the response was generated, for each HTTP response type.

 [type=modplsql_HTTPResponseCodes]

For example, the http404.count metric holds a count of the "HTTP 404: Not found" response codes.

Table A-18 lists the set of metrics for the mod_plsql session cache.

The metric table name is modplsql_Cache.

Table A-18  mod_plsql/SessionCache Metrics
Metric Description Unit

cacheStatus.value

Status of the cache. This can be either enabled or disabled.

status

newMisses.count

Number of session cache misses (new)

ops

staleMisses.count

Number of session cache misses (stale)

ops

hits.count

Number of session cache hits

ops

requests.count

Number of requests to the session cache

ops

Table A-19 lists the set of metrics for the mod_plsql content cache.

The metric table name is modplsql_ContentCache.

Table A-19  mod_plsql/ContentCache Metrics
Metric Description Unit

cacheStatus.value

Status of the cache, either enabled or disabled.

newMisses.count

Number of content cache misses (new)

ops

staleMisses.count

Number of content cache misses (stale)

ops

hits.count

Number of content cache hits

ops

requests.count

Number of requests to the content cache

ops

The SQLErrorGroups metrics show the predefined groupings of SQL errors. For each group, the metrics in Table A-20 are recorded.

The metric table name is modplsql_SQLErrorGroup:

/modplsql/SQLErrorGroups/group [type=modplsql_SQLErrorGroup]

The group is based on the groupings in the Oracle SQL error documentation. For example, the metric name Ora24280Ora29249 represents the grouping Ora-24280 to Ora-29249. Each SQL error that occurs as a result of executing a request is put into the appropriate group based on its error code. If you are getting a high number of the same errors, you should investigate what is causing the problem, using the Oracle SQL error message documentation for further details on the error message.

Table A-20  mod_plsql/SQLErrorGroups Metrics
Metric Description Unit

lastErrorDate.value

Date of the last request to cause the SQL error

date

lastErrorRequest.value

Last request to cause the SQL error

url

lastErrorText.value

SQL error text of the last error

error

error.count

Number of errors that have occurred within the group

ops

The LastNSQLErrors statistics show the last 10 SQL errors that have occurred while executing requests. These are updated in a round robin fashion. For each error, the metrics in Table A-21 are recorded.

The metric table name is modplsql_LastNSQLError:

/modplsql/LastNSQLErrors/<SQL Error Slot> [type=modplsql_LastNSQLError]

If you are getting a large number of the same errors, you should investigate what is causing the problem. Refer to the Oracle SQL error messages documentation for further details of the error represented by the errorText.value metric.

Table A-21  mod_plsql/LastNSQLErrors Metrics
Metric Description Unit

errorDate.value

Date the request caused the SQL error

date

errorRequest.value

Request causing the SQL error

url

errorText.value

SQL error text

error

Table A-22 lists the set of metrics for the Non-SSO connection pool.

The metric table name is modplsql_DatabaseConnectionPool:

/modplsql/NonSSOConnectionPool [type=modplsql_DatabaseConnectionPool]

Table A-22  mod_plsql/NonSSOConnectionPool Metrics
Metric Description Unit

connFetch.maxTime

Maximum time to fetch a connection from the pool

usecs

connFetch.minTime

Minimum time to fetch a connection from the pool

usecs

connFetch.avg

Average time to fetch a connection from the pool

usecs

connFetch.active

Child servers currently in the pool fetch phase

threads

connFetch.time

Total time spent fetching connections from the pool

usecs

connFetch.completed

Number of times a connection has been requested from the pool

ops

newMisses.count

Number of connection pool misses (new)

ops

staleMisses.count

Number of connection pool misses (stale)

ops

hits.count

Number of connection pool hits

ops

Table A-23 lists the set of metrics for the request owner connection pool.

The metric table name is modplsql_DatabaseConnectionPool:

/modplsql/RequestOwnerConnectionPool [type=modplsql_DatabaseConnectionPool]

Table A-23  mod_plsql/RequestOwnerConnectionPool Metrics
Metric Description Unit

connFetch.maxTime

Maximum time to fetch a connection from the pool

usecs

connFetch.minTime

Minimum time to fetch a connection from the pool

usecs

connFetch.avg

Average time to fetch a connection from the pool

usecs

connFetch.active

Child servers currently in the pool fetch phase

threads

connFetch.time

Total time spent fetching connections from the pool

usecs

connFetch.completed

Number of times a connection has been requested from the pool

ops

newMisses.count

Number of connection pool misses (new)

ops

staleMisses.count

Number of connection pool misses (stale)

ops

hits.count

Number of connection pool hits

ops

Table A-24 lists the set of metrics for the super user connection pool.

The metric table name is modplsql_DatabaseConnectionPool:

/modplsql/SuperUserConnectionPool [type=modplsql_DatabaseConnectionPool]

Table A-24  mod_plsql/SuperUserConnectionPool Metrics
Metric Description Unit

connFetch.maxTime

Maximum time to fetch a connection from the pool

usecs

connFetch.minTime

Minimum time to fetch a connection from the pool

usecs

connFetch.avg

Average time to fetch a connection from the pool

usecs

connFetch.active

Threads currently in the pool fetch phase

threads

connFetch.time

Total time spent fetching connections from the pool

usecs

connFetch.completed

Number of times a connection has been requested from the pool

ops

newMisses.count

Number of connection pool misses (new)

ops

staleMisses.count

Number of connection pool misses (stale)

ops

hits.count

Number of connection pool hits

ops

Parallel Page Engine Metrics

Figure A-3, "Parallel Page Engine Metric Tree" shows the structure of the Parallel Page Engine metrics. The tables in this section describe the relevant metrics.
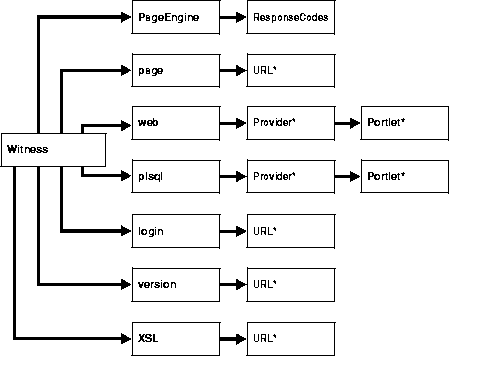
Figure A-3 Parallel Page Engine Metric Tree

Text description of asper008.gif follows

Text description of the illustration asper008.gif

The set of metrics can be broken down into static and dynamic types. Static metrics are those that are always available and dynamic being those metrics that only appear if a specific event occurs, such as when a specific portlet is requested. All of the PageEngine and ResponseCodes metrics are static, the remaining metrics are dynamic.

Table A-25 lists the set of metrics for the Parallel Page Engine. The metric table type is modplsql_PageEngine. This set represents the general performance of the Parallel Page Engine. If you intend to use the cache you should ensure that the cacheEnabled.value metric is set 1. To turn the cache on, refer to the mod_plsql cache and Parallel Page Engine configuration documentation.

Table A-25  Witness/PageEngine Metrics
Metric Description Unit

pageRequests.value

Total number of requests for Portal pages.

count

cacheEnabled.value

The PPE makes use of the mid tier cache as controlled by mod_plsql, and is accessed via a JNI layer. This flag indicates whether this JNI cache as accessed from the PPE is enabled or not. This flag will be zero if the cache is either configured to be off or there was a problem loading the JNI layer DLL.

status

cachePageHits.value

Number of requests for cacheable fully assembled pages that have resulted in a cache hit.

count

cachePageRequests.value

Number of requests for cacheable fully assembled pages.

count

pageMetadataWaitTimeAvg.
value

Average time spent in the PPE internal request queue waiting for page metadata, for all requests. To obtain the average you should divide the value metric by the count metric. The value being the accumulative time for all requests and the count being the number of requests made.

msecs

pageMetadataWaitTimeAvg.
count

Number of requests made for page metadata. This metric should be used in conjunction with pageMetadataWaitTimeAvg.value to calculate the average time spent in the PPE internal request queue.

ops

pageMetadataWaitTime.
value

Time the last page metadata request spent in the PPE internal request queue.

msecs

pageMetadataWaitTime.
count

Number of requests for page metadata.

ops

pageMetadataWaitTime.
minValue

Minimum time spent in the PPE internal request queue waiting for page metadata to be requested.

msecs

pageMetadataWaitTime.
maxValue

Maximum time spent in the PPE internal request queue waiting for page metadata to be requested.

msecs

pageElapsedTimeAvg.value

Average time to generate pages, including fetching the page metadata. To obtain the average you should divide the value metric by the count metric. The value being the accumulative time for all requests and the count being the number of requests made.

msecs

pageElapsedTimeAvg.count

Number of pages that had to be generated (i.e. not cached). This metric should be used in conjunction with pageElapsedTimeAvg.value to calculate the average time to generate pages, including fetching the page metadata.

ops

pageElapsedTime.value

Time to generate the last page requested, including fetching the page metadata.

msecs

pageElapsedTime.count

Number of pages that had to be generated (i.e. not cached).

ops

pageElapsedTime.minValue

Minimum time to generate a page, including fetching the page metadata.

msecs

pageElapsedTime.maxValue

Maximum time to generate a page, including fetching the page metadata.

msecs

pageMetadataFetchTimeAvg.
value

Average time to fetch page metadata, for all requests. To obtain the average you should divide the value metric by the count metric. The value being the accumulative time for all requests and the count being the number of requests made.

msecs

pageMetadataFetchTimeAvg.
count

Number of requests for page metadata. This metric should be used in conjunction with pageMetadataFetchTimeAvg.value to calculate the average time to fetch page metadata.

ops

pageMetadataFetchTime.
value

Time to fetch page metadata, for the last request.

msecs

pageMetadataFetchTime.
count

Number of requests for page metadata.

ops

pageMetadataFetchTime.
minValue

Minimum time to fetch page metadata.

msecs

pageMetadataFetchTime.
maxValue

Maximum time to fetch page metadata.

msecs

queueTimeout.value

Number of requests for Portal data that have timed out in the PPE internal request queue.

msecs

queueStayAvg.value

Average time all internal PPE requests spent in the PPE internal request queue. To obtain the average you should divide the value metric by the count metric. The value being the accumulative time for all requests and the count being the number of requests made.

msecs

queueStayAvg.count

Number of requests added to the internal PPE request queue. This metric should be used in conjunction with queueStayAvg.value to calculate the average time requests spent in the internal PPE request queue.

ops

queueStay.value

Time the last internal PPE request spent in the PPE internal request queue.

msecs

queueStay.count

Number of requests added to the internal PPE request queue.

ops

queueStay.minValue

Minimum time a request spent in the internal PPE request queue.

msecs

queueStay.maxValue

Maximum time a request spent in the internal PPE request queue.

msecs

queueLengthAvg.value

Average length of the PPE internal request queue. To obtain the average you should divide the value metric by the count metric.

msecs

queueLengthAvg.count

Number of requests added to the PPE internal request queue. This metric should be used in conjunction with queueLengthAvg.value to calculate the average length of the PPE internal request queue.

ops

queueLength.value

Current length of the PPE internal request queue.

msecs

queueLength.count

Number of requests added to the PPE internal request queue.

ops

queueLength.minValue

Minimum number of requests in the PPE internal request queue.

msecs

queueLength.maxValue

Maximum number of requests in the PPE internal request queue.

msecs

The set of metrics for the response codes returned by internal requests, such as portlets, page, or metadata, made by the Parallel Page Engine are in the metric table is modplsql_PageEngine_ResponseCodes.

This table contains a count for each HTTP response type.

For example, http100.count, contains a count of the HTTP:100 Continue response codes.

In addition, the metric httpUnresolvedRedirect.value contains a count of requests that were not resolved after returning a redirect HTTP response code and httpTimeout.value contains a count of requests that timed out in the PPE internal request queue.

Table A-26 lists the set of metrics for the internal Parallel Page Engine page metadata requests. The metric table name is dynamic in that it includes the URL used to request the page metadata. If you are encountering a large number of failed requests, check the HTTPD error_log for details of why the requests are failing. The mod_plsql metrics may also provide further details.

Table A-26  Witness/page/url Metrics
Metric Description Unit

lastResponseDate.value

Last time the response was made

Date

lastResponseCode.value

Last response code returned for this request

HTTP response code

cacheHits.value

Number of cache hits for this request

ops

httpXXX.value

Count of specific HTTP response codes for this request.

ops

executeTime.maxTime

Maximum time to make the request

usecs

executeTime.minTime

Minimum time to make the request

usecs

executeTime.avg

Average time to make the request

usecs

executeTime.active

Threads currently being processed

threads

executeTime.time

Total time spent making requests

usecs

connFetch.completed

Number of requests made

ops

Table A-27 lists the set of metrics for the internal Parallel Page Engine login metadata requests. The metric table name is dynamic in that it includes the URL used to request the login metadata. If you are encountering a large number of failed requests, check the HTTPD error_log for details of why the requests are failing. The mod_plsql metrics may also provide further details.

Table A-27  Witness/login/url Metrics
Metric Description Unit

lastResponseDate.value

Last time the request was made

Date

lastResponseCode.value

Last response code returned for this request

HTTP response code

cacheHits.value

Number of cache hits for this request

ops

httpXXX.value

Count of specific HTTP response codes for this request.

ops

executeTime.maxTime

Maximum time to make the request

usecs

executeTime.minTime

Minimum time to make the request

usecs

executeTime.avg

Average time to make the request

usecs

executeTime.active

Threads currently in the make request phase

threads

executeTime.time

Total time spent making requests

usecs

connFetch.completed

Number of requests made

ops

Table A-28 lists the set of metrics for the internal Parallel Page Engine Portal version requests. The metric table name is dynamic in that it includes the URL used to request the version of the Portal repository. If you are encountering a large number of failed requests, check the HTTPD error_log for details of why the requests are failing. The mod_plsql metrics may also provide further details.

Table A-28  Witness/version/url Metrics
Metric Description Unit

lastResponseDate.value

Last time the request was made

Date

lastResponseCode.value

Last response code returned for this request

HTTP response code

cacheHits.value

Number of cache hits for this request

ops

httpXXX.value

Count of specific HTTP response codes for this request.

ops

executeTime.maxTime

Maximum time to make the request

usecs

executeTime.minTime

Minimum time to make the request

usecs

executeTime.avg

Average time to make the request

usecs

executeTime.active

Threads currently in the make request phase

threads

executeTime.time

Total time spent making requests

usecs

connFetch.completed

Number of requests made

ops

Table A-29 lists the set of metrics for the internal Parallel Page Engine Portal XSL requests. The metric table name is dynamic in that it includes the URL used to request the XSL document. If you are encountering a large number of failed requests, check the HTTPD error_log for details of why the requests are failing. The mod_plsql metrics may also provide further details.

Table A-29  Witness/XSL/url Metrics
Metric Description Unit

lastResponseDate.value

Last time the request was made

Date

lastResponseCode.value

Last response code returned for this request

HTTP response code

cacheHits.value

Number of cache hits for this request

ops

httpXXX.value

Count of specific HTTP response codes for this request.

ops

executeTime.maxTime

Maximum time to make the request

usecs

executeTime.minTime

Minimum time to make the request

usecs

executeTime.avg

Average time to make the request

usecs

executeTime.active

Threads currently in the make request phase

threads

executeTime.time

Total time spent making requests

usecs

connFetch.completed

Number of requests made

ops

Table A-30 lists the set of metrics for the internal Parallel Page Engine PL/SQL provider requests, holding a metric summary of all the requested portlets owned by a specific provider. The metric table name is dynamic in that it includes the provider name. dad-provider indicates the name of the DAD that the named provider is registered and accessed through. If you are encountering a large number of failed requests, check the HTTPD error_log for details of why the requests are failing. The mod_plsql metrics may also provide further details.

Table A-30  Witness/plsql/dad-provider Metrics
Metric Description Unit

cacheHits.value

Number of cache hits for this request

ops

offline.value

Flag to indicate whether the provider is offline. A value of 1 indicates that the provider is offline and a value of 0 indicates that the provider is online.

state

httpXXX.value

Count of specific HTTP response codes for this request.

ops

executeTime.maxTime

Maximum time to make the request

usecs

executeTime.minTime

Minimum time to make the request

usecs

executeTime.avg

Average time to make the request

usecs

executeTime.active

Threads currently in the make request phase

threads

executeTime.time

Total time spent making requests

usecs

connFetch.completed

Number of requests made

ops

Table A-31 lists the set of metrics for the internal Parallel Page Engine Portal PL/SQL portlet requests. The metric table name is dynamic in that it includes both the provider and portlet names. Table A-30 contains metrics summarizing all of the portlets requested that are owned by a specific PL/SQL provider.

If you are encountering a large number of failed requests, check the HTTPD error_log for details of why the requests are failing. The mod_plsql metrics may also provide further details.

Table A-31  Witness/plsql/dad-provider/portlet Metrics
Metric Description Unit

lastResponseDate.value

Last time the request was made

Date

lastResponseCode.value

Last response code returned for this request

HTTP response code

cacheHits.value

Number of cache hits for this request

ops

httpXXX.value

Count of specific HTTP response codes for this request.

ops

executeTime.maxTime

Maximum time to make the request

usecs

executeTime.minTime

Minimum time to make the request

usecs

executeTime.avg

Average time to make the request

usecs

executeTime.active

Threads currently in the make request phase

threads

executeTime.time

Total time spent making requests

usecs

connFetch.completed

Number of requests made

ops

Table A-32 lists the set of metrics for the internal Parallel Page Engine Web provider requests, holding a metric summary of all the requested portlets owned by a specific provider. The metric table name is dynamic in that it includes the provider name. If you are encountering a large number of failed requests, check the HTTPD error_log for details of why the requests are failing. The mod_plsql metrics may also provide further details.

Table A-32  Witness/Web/dad-provider Metrics
Metric Description Unit

cacheHits.value

Number of cache hits for this request

ops

offline.value

Flag to indicate whether the provider is offline. A value of 1 indicates that the provider is offline and a value of 0 indicates that the provider is online.

state

httpXXX.value

Count of specific HTTP response codes for this request.

ops

executeTime.maxTime

Maximum time to make the request

usecs

executeTime.minTime

Minimum time to make the request

usecs

executeTime.avg

Average time to make the request

usecs

executeTime.active

Threads currently in the make request phase

threads

executeTime.time

Total time spent making requests

usecs

connFetch.completed

Number of requests made

ops

Table A-33 lists the set of metrics for the internal Parallel Page Engine Portal Web portlet requests. The metric name is dynamic in that it includes both the provider and portlet names. Table A-32 contains metrics summarizing all of the portlets requested that are owned by a specific Web provider.

If you are encountering a large number of failed requests, check the HTTPD error_log for details of why the requests are failing. The mod_plsql metrics may also provide further details. If you are seeing a large number of HTTP redirects (302), consider coding the portlet to avoid the redirect as this helps performance. If you have coded you portlet to be cacheable and the number of cache hits is low, check the mod_plsql cache settings to ensure they are set to the appropriate levels for your system.

Table A-33  Witness/Web/dad-provider/portlet Metrics
Metric Description Unit

lastResponseDate.value

Last time the request was made

Date

lastResponseCode.value

Last response code returned for this request

HTTP response code

cacheHits.value

Number of cache hits for this request

ops

httpXXX.value

Count of specific HTTP response codes for this request.

ops

executeTime.maxTime

Maximum time to make the request

usecs

executeTime.minTime

Minimum time to make the request

usecs

executeTime.avg

Average time to make the request

usecs

executeTime.active

Threads currently in the make request phase

threads

executeTime.time

Total time spent making requests

usecs

connFetch.completed

Number of requests made

ops

JServ Metrics

Figure A-4 shows the structure of the JServ metrics. The following tables describe the relevant metrics.
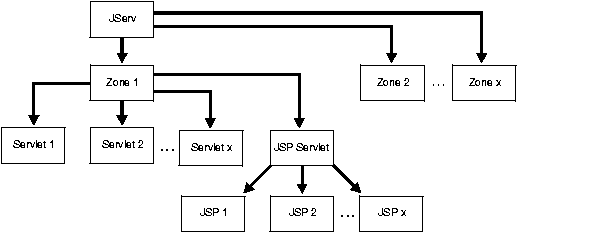
Figure A-4 JServ Metric Tree

Text description of asper004.gif follows

Text description of the illustration asper004.gif

Overall JServ Metrics

There is one set of metrics for each JServ server process.

The metric table name is jserv_server.

Table A-34  jserv Metric Tree
Metric Description Unit

port.value

The ID of the TCP port on which this JServ listens

readRequest.active

Threads currently in the readRequest processing phase

readRequest.avg

Average time to read and parse requests

msecs

readRequest.maxTime

Maximum time to read and parse requests

msecs

readRequest.minTime

Minimum time to read and parse requests

msecs

readRequest.completed

Number of times the readRequest processing phase has completed

ops

readRequest.time

Total time to read and parse the request

msecs

maxConnections.value

Number of requests that can be handled concurrently in the JServ process

threads

activeConnections.
maxValue

Maximum number of requests being processed simultaneously

threads

activeConnections.
value

Number of requests being processed simultaneously

threads

idlePeriod.maxTime

Maximum time process was not handling any requests

msecs

idlePeriod.minTime

Minimum time process was not handling any requests

msecs

idlePeriod.completed

Number of times no requests were being serviced

ops

idlePeriod.time

Total time process was not handling any requests

msecs

host.value

Hostname/IP address this JServ process binds to

maxBacklog.value

Maximum number of backlog requests that may be queued in the OS waiting for this JServ

integer

JServ Zone Metrics

There is one set of metrics for each JServ zone.

The metric table name is jserv_zone.

Table A-35  jserv/zone Metrics
Metric Description Unit

checkReload.active

Threads currently in the checkReload processing phase

integer

checkReload.avg

Average time to check if the zone must be reloaded

msecs

checkReload.maxTime

Maximum time to check if the zone must be reloaded

msecs

checkReload.minTime

Minimum time to check if the zone must be reloaded

msecs

checkReload.completed

Number of times the checkReload processing phase has completed

ops

checkReload.time

Total time to check if the zone must be reloaded

msecs

activeSessions.value

The number of sessions which exist in this zone

sessions

readSession.count

Number of times session data has been read with HttpSession.getValue in this zone

ops

writeSession.count

Number of times session data has been written with HttpSession.putValue in this zone

ops

loadFailed.count

Number of times we failed to load the requested application (does not work for OJSPs)

ops

JServ Servlet Metrics

There is one set of metrics per servlet. Note that the JSP servlet holds all of the aggregated load metrics for all servlets and JSPs within a zone.

The metric table name is jserv_servlet.

Table A-36  /jserv/zone/servlet Metrics
Metric Description Unit

processRequest.active

Threads currently in the processRequest processing phase

integer

processRequest.avg

Average time to completely process servlet (including JServ engine overhead)

msecs

processRequest.maxTime

Maximum time to completely process servlet (including JServ engine overhead)

msecs

processRequest.minTime

Minimum time to completely process servlet (including JServ engine overhead)

msecs

processRequest.completed

Number of times the processRequest processing phase has completed

ops

processRequest.time

Total time to completely process servlet (including JServ engine overhead)

msecs

serviceRequest.active

Threads currently in the serviceRequest processing phase

integer

serviceRequest.avg

Average time for service method implementing this application (excluding JServ engine overhead)

msecs

serviceRequest.maxTime

Maximum time for service method implementing this application (excluding JServ engine overhead)

msecs

serviceRequest.minTime

Minimum time for service method implementing this application (excluding JServ engine overhead)

msecs

serviceRequest.completed

Number of times the serviceRequest processing phase has completed

ops

serviceRequest.time

Total time for service method implementing this application (excluding JServ engine overhead)

msecs

loadServlet.avg

Average time to load servlet (from cache or file)

msecs

loadServlet.maxTime

Maximum time to load servlet (from cache or file)

msecs

loadServlet.minTime

Minimum time to load servlet (from cache or file)

msecs

loadServlet.completed

Number of times the loadServlet processing phase has completed

ops

loadServlet.time

Total time to load servlet (from cache or file)

msecs

loadServletClasses.active

Threads currently in the loadServletClasses processing phase

integer

loadServletClasses.avg

Average time to load servlet classes from file

msecs

loadServletClasses.maxTime

Maximum time to load servlet classes from file

msecs

loadServletClasses.minTime

Minimum time to load servlet classes from file

msecs

loadServletClasses.completed

Number of times the loadServletClasses processing phase has completed. For most classes, this value is usually 1

ops

loadServletClasses.time

Total time to load servlet classes from file

msecs

loadServlet.avg

Average time to load servlet (from cache or file)

msecs

createSession.active

Threads currently in the createSession processing phase

createSession.avg

Average time to create a session

msecs

createSession.maxTime

Maximum time to create a session

msecs

createSession.minTime

Minimum time to create a session

msecs

createSession.completed

Number of times the createSession processing phase has completed number of sessions that have been created for this application

ops

createSession.time

Total time to create a session

msecs

maxSTMInstances.value

Total number of instances available for this SingleThreadModel servlet

integer

activeSTMInstances.maxValue

Maximum number of instances concurrently servicing requests for this SingleThreadModel

integer

activeSTMInstances.value

Total number of instances available for this SingleThreadModel servlet

instances

JServ JSP Metrics

There is one set of metrics per JSP. Note that the JSP servlet holds all of the aggregated load metrics for all servlets and JSPs within a zone.

The metric table name is jserv_jsp.

Table A-37  /jserv/zone/servlet Metrics
Metric Description Unit

processRequest.active

Threads currently in the processRequest processing phase

integer

processRequest.avg

Average time to completely process servlet (including JServ engine overhead)

msecs

processRequest.maxTime

Maximum time to completely process servlet (including JServ engine overhead)

msecs

processRequest.minTime

Minimum time to completely process servlet (including JServ engine overhead)

msecs

processRequest.completed

Number of times the processRequest processing phase has completed

ops

processRequest.time

Total time to completely process servlet (including JServ engine overhead)

msecs

serviceRequest.active

Threads currently in the serviceRequest processing phase

integer

serviceRequest.avg

Average time for service method implementing this application (excluding JServ engine overhead)

msecs

serviceRequest.maxTime

Maximum time for service method implementing this application (excluding JServ engine overhead)

msecs

serviceRequest.minTime

Minimum time for service method implementing this application (excluding JServ engine overhead)

msecs

serviceRequest.completed

Number of times the serviceRequest processing phase has completed

ops

serviceRequest.time

Total time for service method implementing this application (excluding JServ engine overhead)

msecs

loadServlet.avg

Average time to load servlet (from cache or file)

msecs

loadServlet.maxTime

Maximum time to load servlet (from cache or file)

msecs

loadServlet.minTime

Minimum time to load servlet (from cache or file)

msecs

loadServlet.completed

Number of times the loadServlet processing phase has completed

ops

loadServlet.time

Total time to load servlet (from cache or file)

msecs

loadServletClasses.active

Threads currently in the loadServletClasses processing phase

loadServletClasses.avg

Average time to load servlet classes from file

msecs

loadServletClasses.maxTime

Maximum time to load servlet classes from file

msecs

loadServletClasses.minTime

Minimum time to load servlet classes from file

msecs

loadServletClasses.
completed

Number of times the loadServletClasses processing phase has completed. For most classes, this value is usually 1

ops

loadServletClasses.time

Total time to load servlet classes from file

msecs

loadServlet.avg

Average time to load servlet (from cache or file)

msecs

createSession.active

Threads currently in the createSession processing phase

createSession.avg

Average time to create a session

msecs

createSession.maxTime

Maximum time to create a session

msecs

createSession.minTime

Minimum time to create a session

msecs

createSession.completed

Number of times the createSession processing phase has completed number of sessions that have been created for this application

ops

createSession.time

Total time to create a session

msecs

maxSTMInstances.value

Total number of instances available for this SingleThreadModel servlet

activeSTMInstances.
maxValue

Maximum number of instances concurrently servicing requests for this SingleThreadModel

activeSTMInstances.value

Total number of instances available for this SingleThreadModel servlet

instances


Go to previous page Go to next page
Oracle
Copyright © 2002 Oracle Corporation.

All Rights Reserved.
Go To Documentation Library
Home
Go To Table Of Contents
Contents
Go To Index
Index