Skip Headers

Oracle9iAS Wireless Administrator's Guide
Release 9.0.3

Part Number B10042_01
Go to Documentation Home
Home
Go to Book List
Book List
Go to Table of Contents
Contents
Go to Index
Index
Go to Master Index
Master Index
Go to Feedback page
Feedback

Go to previous page
Previous
Go to next page
Next

14
Activity and System Logging

14.1 Activity and System Logging Overview

The Oracle9iAS Wireless Performance Manager provides system administrators with information on the running status of Wireless Web Server, alert engine, message gateway server, data feed engine, and the async server. The Performance Manager also provides statistical information, enabling system administrators to study past performance and historical data to perform future trend analysis.

Wireless integrates with the OEM (Oracle Enterprise Manager) framework to provide a web-based monitoring tool which displays metrics for diagnosis based on the data logged.

14.1.1 Overview of Activity Logger Internals

The Activity Logger provides the common logging framework used by the runtime components. Database logging is handled asynchronously because the runtime logging on the database carries a huge overhead. The runtime data is generated as files, which are less expensive. The data thus generated is picked up by the Performance Logger framework and written onto the database. In this way, database logging is handled asynchronously without impacting the runtime performance of the respective servers.

For the Wireless web server, the logging process is handled in the callback of the different events, which are generated (that is, the session begin and end). These events are enabled by default for logging purposes. If the administrator chooses not to generate the logging, then there is a provision to turn off the Wireless web server logging. When this happens, the callbacks do not generate log files. For other modules, such as the Alert Engine, Async Server, and Transport Server, logging into the files occurs when the corresponding request is fulfilled. The Data Feeder logs the runtime data directly to the database in batches.
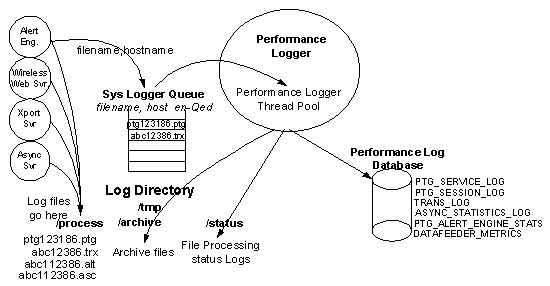
Figure 14-1 Performance Logger Interactions


Text description of log_flwc.gif follows.
Text description of the illustration log_flwc.gif

The generated log files follow a common directory structure, which can be configured using the system management functions at the node (process) level. The top level Logging Directory is specified here, the Logger Framework, which all modules use, creates sub-directories: process, status and archive. At runtime, the log files generated by the different modules have distinct file suffixes. These files are stored in the process directory and the file names and the machine name are enqueued into a `SYS_LOGGER_QUEUE'. The file can be made available for processing based on a configurable file size. Additionally, Wireless supports log file aging by which the log file is automatically made available for processing after a fixed time. This ensures that the skew introduced by the asynchronous nature of the logging process is reduced. The log file age (also known as close frequency) can be configured using the system management functions for the site-level configuration of the Performance Logger.

The modules (which generate these log files with distinct suffixes), provide a Database Log File Handler Class, which processes these files. The handler classes are created by extending a common abstract class, which provides the connection and directory and file information. The handler to suffix mapping is pre-seeded in Wireless during installation.

Starting Performance Logger starts up multiple threads, each containing an instance of the different handlers. Each logger thread dequeues the filenames belonging to the local machine, inspects the file suffix and delegates it to the corresponding handler class for further processing.

The administrator can control the number of Performance Logger threads using the system management functions for the process-level configuration.

For details regarding the Performance Monitor configuration see Section 12.1.5 in Chapter 12, "Server Configuration".

14.1.2 Activity Log Table Description


Note:

Since these tables tend to grow during the life of the servers, the administrator may choose to purge the data off these tables periodically. 


PTG_SERVICE_LOG

Table 14-1 Service Activity Log
Column Name  Description 

Service_id 

The Object Identifier for the invoked service. 

Service_name 

The name of the invoked service. 

ptg_instance_id 

The unique identifier identifying the instance. 

final_service_id 

The Object Identifier of the final service (that is, master service folder). 

final_service_name 

The name of the final service. 

session_id 

The Session Identifier of the Session in whose context the service is invoked. 

bookmark 

The service bookmark. 

service_type 

The type of service. 

invocation_hour 

The hour when the service was invoked. 

invocation_time 

The date when the service was invoked. 

response_time 

The response time for the service. 

request_status 

The status of the request. Non-zero values indicate the error number. 

error_description 

The error message (if there was an error while invoking the service). 

user_id 

The Object Identifier for the user. 

user_name 

The name of the user. 

remote_address 

Gateway IP address and host name. 

host_id 

Host IP address and name. 

logical_device 

The Logical Device from where the Service was invoked. 

external_user_id 

The external user id of the which forwarded this request. 

external_user_name 

The external user name of the which forwarded this request. 

adapter_type 

The type of the adapter which is servicing this request (not logged currently). 

adapter_time 

Time taken by the adapter to service this request.  

transformation_time 

Time taken by the transformer to service this request.  

timestamp 

Logged event timestamp (generated by trigger). 


Table 14-2 DATAFEEDER_METRICS
Column Name  Description 

HOST_NAME 

The host name of this data feeder.  

INSTANCE_NAME 

The instance name of this data feeder.  

FEED_NAME 

The name of this data feeder.  

UPDATE_DATE 

The date and time of this batch run.  

ACTUAL_BATCHTIME 

The actual time spent on this batch.  

DOWNLOADED_ROWS 

The publishing rate (data rows stored).  

ERROR_DESCRIPTION 

Errors encountered for this batch for future use. 


PTG_ALERT_ENGINE_STATS

Table 14-3 Alert Server Activity Log
Column Name  Description 

host_name 

The host name of the machine this alert server instance is running on. 

instance_name 

The alert instance name. 

malert_name 

The name of the master alert service which generates this alert message. 

malert_oid 

The Object Identifier of the master alert service which generates this alert message. 

subscriber_name 

The name of the subscriber to receive this alert message. 

device_address 

The device address this alert message is delivered to. 

device_oid 

The device address object identifier. 

device_type 

The type of the device. 

message_id 

The message id generated by the message gateway for this alert message. 

message_length 

The length of this alert message. 

message_status 

The dispatch status of this alert message. 

dispatch_time 

The time stamp of this alert message being dispatched to the message gateway. 

error_description 

The error message - if there was an error while dispatching this alert message. 


ASYNC_STATISTICS_LOG

Table 14-4 Async Service Activity Log
Column Name  Description 

host 

Name of the host where the Async server is running.  

instance_id 

The unique id to identify an instance of the Async server.  

source_addr 

The source address of the received message.  

dest_addr 

The destination address of the received message.  

delivery_type 

The network delivery type of the message. The possible values are:

  • WAP-Push
  • SMS
  • Voice
  • Email
  • Fax
  • Two-Way Pager
  • One-way Pager
 

encoding 

The character encoding for the message.  

queue_size 

The number of messages waiting in the queue when the message is received. 

msg_rcv_time 

The message received time.  

msg_rcv_hour 

The message received hour.  

start_execute_time 

The time to start invoking the service requested from the message.  

end_execute_time 

The time to finish the service invocation.  

error_description 

The error description on failure of the service invocation.  

service_id 

The ID of the service the user is requesting to access.  

async_name 

The Async short name of the service the user is requesting to access.  

message_size 

The size of the message.  

timestamp 

Time when the message is logged into the database 


TRANS_LOG

Table 14-5 Message Gateway Activity Log
Column Name  Description 

MESSAGE_ID  

The message id assigned by the transport, which is unique for every message.  

MESSAGE_TYPE 

The type of the message, which can be 'R' for received message, 'S' for message to send.  

DELIVERY_TYPE 

The delivery type, which can be:

  • Wap-Push
  • SMS
  • Voice
  • Email
  • Fax
  • Two-Way Pager
  • One-Way Pager
 

REQUEST_INSTANCE_HOST 

The transport instance host on which the message is accepted. For a sending message, this is the host of the client; for a received message, this is the host of the driver. 

REQUEST_INSTANCE_ID 

The Wireless instance id on which the message is accepted. For a sending message, this is the instance id of the client. For a received message, this is the host of the transport server that the driver is on. 

REQUEST_BEGIN_TIME 

The time the message is to be accepted. For sending message, it is the time the send method is called. For a received message, it is the time the onMessage method is called. All time is Java system time.  

REQUEST_END_TIME 

The time the message is accepted. For a sending message, it is the time the send method returned. For received message, it is the time the onMessage method returned.  

HANDLE_INSTANCE_HOST 

The host name on which the message is dequeued to a process. For a sending message, it is the host on which the driver ran. For received message, it is the host on which the driver ran.  

HANDLE_INSTANCE_ID  

The Wireless instance id on which the message is dequeued to process. 

HANDLE_BEGIN_TIME 

The time the dequeue method to be called. 

HANDLE_END_TIME 

The time the message is processed. For sending message, the message is sent. For received message, the message is processed by the listener.  

ENQUEUE_BEGIN_TIME 

The time the enqueue call started.  

ENQUEUE_END_TIME 

The time enqueue call returned.  

DEQUEUE_BEGIN_TIME 

The time the dequeue call started.  

DEQUEUE_END_TIME 

The time the dequeue call returned.  

PROCESS_STATUS_CODE 

The status code of the message processing, which can be: unknown failed succeeded ignored 

PROCESS_BEGIN_TIME 

The time the processing call was called. For sending message, the driver's send method was called. For received message, the listener's onMessage method was called.  

PROCESS_END_TIME 

The time the processing call returned. For sending message, the driver's send method returned. For received message, the listener's onMessage method returned. 


System Logging

The System Logger logs the runtime debug log information generated by the runtime processes. The Wireless server generates log information, which is stored in the log file. The different levels of logging and the log file size can be configured as follows:

To configure the System Log file using Wireless Management at either the site or process level:

  1. Enter a name for the log file name pattern. The default is sys_panama.log.

    This pattern enables you to identify the log file generated by the different server processes. Currently, the only supported pattern is <filename>{0}.log. For example, sys_panama{0}.log would generate a file with a name sys_panama<timestamp in long>.log. Using this pattern enables administrators to identify log files pertaining to the different server processes based on their start timestamp. The setting of the pattern is optional. The default log file name sys_panama.log

    At the Wireless server or host level, the log directory may be specified using Wireless Management. The default log directory is the default temp directory for that operating system (typically c:\temp for windows and /var/tmp on UNIX).

  2. In the Maximum Log File Size field, enter the maximum number of log file size (in bytes).
  3. Select a log level. The log can contain any of the following: Warning, Error, or Notify. The default is Warning, Error, and Notify.
  4. Click Apply.


    Note:

    The System Log file configuration can be unique to each instance of the server. It defaults to the site level configuration if nothing is specified at the instance level.