| Oracle9iAS Wireless Administrator's Guide Release 2 (9.0.4) Part Number B10685-01 |
|
|
View PDF |
| Oracle9iAS Wireless Administrator's Guide Release 2 (9.0.4) Part Number B10685-01 |
|
|
View PDF |
This chapter describes server- and site-level performance monitoring and includes the following sections:
From the Wireless page accessed through OEM, you can monitor real-time performance data to assess system health and collect data to display historical trends.
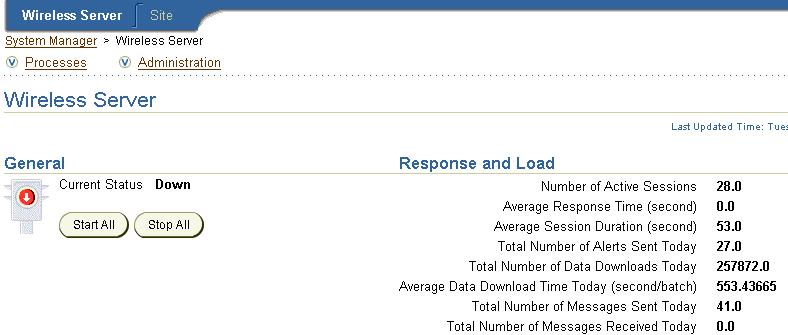
The Response and Load section of the Wireless Server tab displays the following Wireless statistics, which are an overview of the process performance metrics:

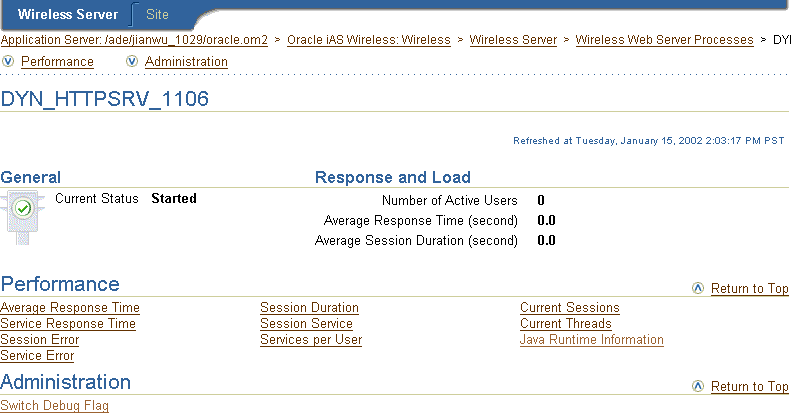
You can view the performance metrics of a Wireless Server process using the detail screen. The Response and Load section of the detail screen lists the overall performance for the selected process. The Performance section of the screen lists the individual metrics.

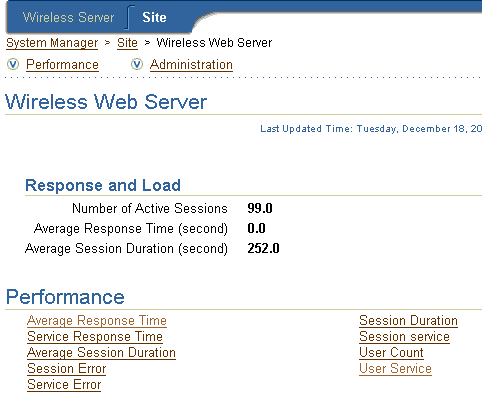
The Response and Load section of the screen displays the overall performance the selected Wireless Web Server process for the following categories:
The Performance section of a Wireless Web Server process detail screen includes the following:
A view of the process measured against the following:
See Section 13.1.1.1 for information on selecting a specific time period for this metric.
The process measured against the average service response time for sample period. You can use this to study the performance of the services in each process over the sample period.
See Section 13.1.1.1 for information on selecting a specific time period for this metric.
A view of the process to the number of service errors.
See Section 13.1.1.1 for information on selecting a specific time period for this metric.
A view that maps the session ID by session errors. It is also a view of the process to the service errors per second sampled over a finite period. You can use this metric to identify such problems as improper configuration or other external factors which cause services to fail in one process more frequently than others.
See Section 13.1.1.1 for information on selecting a specific time period for this metric.
A view that maps the session ID of the process by login duration.
See Section 13.1.1.1 for information on selecting a specific time period for this metric.
A view that maps the session ID of the process to the number of invoked services for that session.
See Section 13.1.1.1 for information on selecting a specific time period for this metric.
A view of the user of the process measured against the number of times the services were invoked on a per-user basis. You can use this to categorize active users.
See Section 13.1.1.1 for information on selecting a specific time period for this metric.
For these sample metrics, you can select the sample time period, from the last five minutes to the last seven days.
To set a sample period:
A view of the runtime sessions and users for a Wireless web server process. Wireless records each service invocation request and each successful user session. The Current Sessions screen includes the following:
Table 13-1 Elements of the Current Sessions Screen| Element | Description |
|---|---|
|
Session ID |
The identifier for the active session. |
|
Login User Name |
The user name. |
|
Login User ID |
The OID for the user. |
|
Last Access Time |
The last time the user accessed the session. |
When you have finished viewing the statistics, Click OK to return to the detail screen.
A view the of the active threads, separated by groups for a wireless web server process. The Current Threads screen displays the threads as follows:
Table 13-2 The Runtime ThreadsWhen you have finished viewing the statistics, click OK to return to the detail screen.
A view of Java runtime information such as Java version and classpath for a wireless web server process.
From the detail screen, you can view the number of messages received today in the Response and Load section.
The Performance section of the screen lists the following performance metrics:
The number of messages received on an hourly basis for today.
The average size of the message queue on an hourly basis for today.
The average time a message stayed in the message queue on an hourly bases for today.
The average service invocation time on an hourly basis for today.
The average time a message stayed on the asynchronous server on an hourly basis for today.
The number of times that each service was accessed today.
The number of errors on an hourly basis for today.
For each of the Messaging Server Performance metrics, Wireless displays performance by client process name and delivery type (for example, SMS). The performance metrics include:
The average time of a sending method. On the client side, a sending method is called to send a message. This time is the period from when the method is called to the time the method returns. When the method returns, the message is saved in a database persistently, but is not delivered.
This is the total time the sending method is called by the client process. The sending method can be called once to send a message to a set of destinations.
The total number of successful calls, where a message is delivered to a proper gateway and its receipt is acknowledged. The client process can call the sending method many times to send many messages. Some of these requests fail, as in the case where a destination cannot be reached. Other requests could be undergoing processing.
The total number of all calls that are known to have failed.
The performance of the listener in terms of the time taken by the onMessage call-back.
For these sample metrics, you can select the sample time period of activity, from the previous day or the last 30 days.
To set a sample period:
The Performance Section of the screen displays the following performance metrics:
The Average Sending Process screen displays the performance of a driver in terms of the time taken by the sending method of the driver. The screen measures driver performance by delivery type (for example, SMS), process time (the time taken by a driver to send a message to the proper gateway), dequeue time, and driver process time. When you measure the performance of the transport system, you can deduct the process time, because the transport system is waiting while the driver sends a message. If the driver is fast, then the system does not wait long.
Once a transport driver receives a message, the message is passed to the transport system by an onMessage method. The response time is the time taken by the onMessage method. Once the onMessage returns, the received message is saved in a database for dispatching.
The total number of times the transport drivers call the onMessage call-back method.
The total number of received messages which are dispatched to, and are accepted by, listeners. Among received messages, some may be in processing. Others may not have been dispatched to listeners, or listeners may have failed to process dispatched messages.
The total number of received messages which failed to dispatch to a listener.
For these sample metrics, you can select the sample time period of activity, from the previous day or the last 30 days.
To set a sample period:
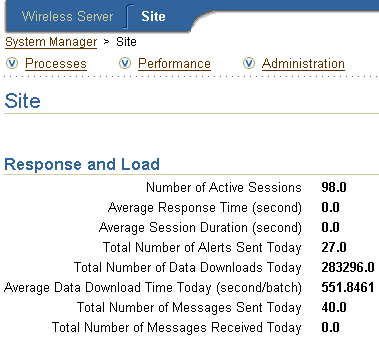
The Site tab, displays overall site performance metrics in the Response and Load section. The Response and Load section includes overall performance statistics for the site-wide processes of the wireless web server, which include:
Using the system metrics for the performance of the runtime, alert, and feed components, you can assess system health and performance. These individual metrics may not directly point to a fault in the system; however, building an abductive reasoning model from the data collected by these metrics enables you to form a diagnosis of the system's health.

You view the performance metrics for a site-wide process using the detail screen, which you invoke by drilling down from a process type in the Processes table of the Site tab.

The Response and Load section lists the following overall performance metrics:
The Performance section lists the following:
A view of overall service performance for the system, showing the process name to the average response time of the invoked services over a specified time period.
The service response time statistics are a class of statistics for the average response time for each service that was invoked across processes. The service response time statistics are grouped by service names and process IDs. If the response time exceeds a configurable threshold value, then the Oracle Performance Manager generates a warning or an error. You can use this metric to study the performance of the services in each process over the sample period.
A view of the process name to the average session duration. This metric, when sampled at different times of the day, can be used to estimate both the peak user hours and slow user hours.
Session error statistics are a class of statistics that represent the number of errors for each session. For session duration statistics, the data is grouped by process IDs.
Service error statistics are a class of statistics that represent the number of services which have runtime errors. The service error data is grouped by process IDs.
Session duration statistics are a class of statistics that present the duration of each session. The data is grouped by process IDs. The duration of each session is computed using the login time and the expiry time (or the current time if the session is still operational). Session duration statistics are presented as table.
Session service statistics is a class of statistics that represent the number of services invoked during each session. The data is grouped by process IDs.
A view of the process name to the number of active users. This metric can be used for new user redirection to manage the user loads in each process.
The service per user statistics are a class of statistics that presents the number of services invoked by a specific user across processes. The user service statistics data is grouped by user name and by process IDs.
For these sample metrics, you can select the sample time period, from the last five minutes to the last seven days.
To set a sample period:
The Response and Load section displays the following performance statistics for the alert server processes:
From the Performance section of the Asynchronous Server screen, you can view the following performance metrics:
The number of messages received today (grouped by process name).
The number of messages received on an hourly basis for today.
The average size of the message queue for today.
The average time a message stayed in the message queue on an hourly basis for today.
The service invocation time on an hourly basis for today.
The average time a message stayed on the server on an hourly basis for today.
The number of times each services was accessed today.
The number of messages issued by each user device.
The number of errors on an hourly basis for today.
The Response and Load section of the detail screen lists the following overall performance metrics:
The Performance section lists the server-side and client-side Performance Metrics for the Messaging Server
From a messaging server process screen, you can access the following views of the performance of the selected messaging server process on the server. For each of these metrics, the Client Send Performance screen displays performance by client process name and delivery type (for example, SMS). For the Average Sending Response Time, the screen displays the performance for each client process name and the delivery type by response time and enqueue time.
The Server-Side section of the Messaging Server screen includes the following metrics:
The Average Sending Process screen displays the performance of a driver in terms of the time taken by the sending method of the driver. The screen measures driver performance by delivery type (for example, SMS), process time (the time taken by a driver to send a message to the proper gateway), dequeue time, and driver process time. When you measure the performance of the transport system, you can deduct the process time, because the transport system is waiting while the driver sends a message. A fast driver reduces waiting time.
Once a transport driver receives a message, the message is passed to the transport system by an onMessage method. The response time is the time taken by the onMessage method. Once the onMessage returns, the received message is saved in a database for dispatching.
The total number of times the transport drivers call the onMessage call-back method.
The total number of received messages which are dispatched to, and are accepted by, listeners. Among received messages, some messages may be in processing. Others may not have been dispatched to listeners, or listeners may have failed to process dispatched messages.
The total number of received messages which failed to dispatch to a listener.
The average time of a sending method. On the client side, a sending method is called to send a message. This time is the period from when the method is called to the time the method returns. When the method returns, the message is saved in a database persistently, but is not delivered.
This is the total time the sending method is called by the client process. The sending method can be called once to send a message to a set of destinations.
The total number of successful calls, where a message is delivered to a proper gateway and its receipt is acknowledged. The client process can call the sending method many times to send many messages. Some of these requests can fail; for example, a destination cannot be reached. Other requests could be undergoing processing.
The total number of all calls that are known to have failed.
The performance of the listener in terms of the time taken by the onMessage call-back.
For these sample metrics, you can select the sample time period of activity, from the previous day or the last 30 days.
To set a sample period:
You can view the overall performance by servers on the site by clicking the Summary hyperlink in the Performance section of the Site screen. For each server on the site, the Site screen displays Wireless Web Server process performance by the number of active users and average session duration in seconds.
You can select the sample time period of activity, from seven days ago to the last five minutes.
To set a sample period: