|
Oracle® Business Intelligence Concepts Guide
10g Release 2 (10.1.2.1) B16378-01 |
|
 Previous |
 Next |
|
Oracle® Business Intelligence Concepts Guide
10g Release 2 (10.1.2.1) B16378-01 |
|
 Previous |
 Next |
This chapter describes what business intelligence is and what you can do with Oracle Business Intelligence. It contains the following sections:
Business intelligence (or BI) is the process of getting information about your business from available data. In the Information Age, corporations have at their disposal massive amounts of data, collected in transactional systems. These systems are essential for businesses to keep track of their affairs.
Having data is not the same as having information. Data becomes information when you can use it to answer business questions, so you can understand your business better. Business intelligence allows you to answer those questions, so that decision makers at all levels can respond quickly to changes in the business.
Business intelligence provides answers to basic questions such as:
What are my five top selling products?
How do my sales this year compare to sales last year?
What is the 3-month moving average of my sales?
Business intelligence can also answer more probing analytical questions such as:
Why are sales down in this region?
What can we predict for sales next quarter?
What factors can we alter to improve the sales forecast?
How will our margins improve if we run this promotion?
What factors differentiate our high value customers from other customers?
Which products do customers buy together?
Which customers are most likely to buy a particular product?
Which transactions may be fraudulent?
Business intelligence begins with the day-to-day information that you need to run your business. You need to know what was ordered yesterday and what was shipped. You need to know which accounts are more than 30 days outstanding. You need to know the volume of calls that come into a call center. This information comes from the data that you collect during business transactions, in an operational system such as Oracle E-Business Suite. Oracle Business Intelligence gives you access to this transactional data, so that you can report from it to find current information.
For many business intelligence questions, you need historical data or data from a number of different sources. The solution for this kind of business intelligence is often built upon a data warehouse and is part of the data warehouse environment.
A data warehouse is a relational database that is designed for query and analysis rather than for transaction processing. It contains historical data derived from transaction data, but it can include data from other sources. Data warehouses separate analysis workload from transaction workload and enable an organization to consolidate data from several sources.
Data warehouses often integrate data from a number of transactional systems, making it possible to compare and to analyze data from a broad base of source data. After data is loaded into a data warehouse, it is not changed except to correct errors. This integration of nonvolatile data allows the data warehouse to be a single source of truth for answering business questions.
Unlike transactional systems, data warehouses store historical data. This historical data is crucial to business intelligence, which requires analysis of past performance. Business intelligence uses this historical data for time-based analysis and trend analysis.
Data warehouses organize data around business subjects, such as customers, products, and time. These business subjects form the basis of the business questions that business intelligence answers.
In addition to a relational database, a data warehouse environment can include an extraction, transformation, and loading (ETL) solution, online analytical processing (OLAP) and data mining capabilities, client analysis tools, and other applications that manage the process of gathering data and delivering it to business users.
Oracle Database includes a rich set of data warehousing features and functions, so an Oracle data warehouse can be tuned for very fast analytic queries on very large data sets. Oracle Database also features a full set of statistical functions, such as ranking functions, time-series functions, linear regression, descriptive statistics, correlations, hypothesis testing. Oracle Business Intelligence components leverage many of these statistical functions.
Oracle OLAP and Oracle Data Mining are database options that are part of the data warehousing environment, providing advanced analytic features. Oracle Business Intelligence leverages these and other database features and options as it supports analysis of business data, to answer your business questions.
Oracle Business Intelligence includes a number of components that make it possible for you to answer business questions from your data.
Oracle Business Intelligence includes the following components for preparing your data for analysis:
Oracle Business Intelligence Warehouse Builder (OracleBI Warehouse Builder) for designing, implementing, and maintaining a data warehouse environment and the metadata for building reports
Oracle Business Intelligence Discoverer Administrator (OracleBI Discoverer Administrator) for creating and maintaining a business-oriented view of relational data for other OracleBI Discoverer components
Analytic Workspace Manager for structuring data for advanced analysis
Oracle Business Intelligence includes the following components for analyzing data and creating reports:
Oracle Business Intelligence Discoverer Plus (OracleBI Discoverer Plus) for creating standard and ad-hoc reports
Oracle Reports for creating high-fidelity enterprise reports
Oracle Business Intelligence Spreadsheet Add-In (OracleBI Spreadsheet Add-In) for working directly in Microsoft Excel, to query analytic data
Oracle Data Miner, which is the graphical user interface for Oracle Data Mining, for performing data mining, such as response modeling, market basket analysis, and customer profiling and clustering.
Oracle Spreadsheet Add-In for Predictive Analytics for performing one-click, automated data mining in Microsoft Excel
Oracle Business Intelligence includes the following components for sharing reports with others:
Oracle Business Intelligence Discoverer Portlet Provider (OracleBI Discoverer Portlet Provider), which supports publishing reports in OracleAS Portal
Oracle Reports, which supports the publication of enterprise reports to a printer, to the Web, and in OracleAS Portal
Oracle Business Intelligence Discoverer Viewer (OracleBI Discoverer Viewer), which supports viewing reports and analyzing data in a Web browser
Oracle Business Intelligence includes the following component for building your own business intelligence application:
Oracle Business Intelligence Beans (OracleBI Beans), which, integrated with JDeveloper, supports the development of JSP applications
Oracle OLAP supports the creation of advanced analytic functions, such as forecasting and allocations, which you can make available in an OracleBI Beans application.
In addition, Oracle OLAP and Oracle Data Mining have Java and SQL APIs, which you can call in a BI application.
Oracle Business Intelligence allows you to answer a range of business questions. This section describes how Oracle Business Intelligence helps you answer common business questions:
The most basic kind of business intelligence involves knowing the state of your business. You need to know whether you are meeting your strategic goals, which areas of your business are performing well and which are not, and whether conditions are improving. With Oracle Business Intelligence, it is easy to find answers to questions about the state of your business, such as:
Are we making our sales targets?
What are my five best selling products?
Am I over budget?
How do my sales this year compare to sales last year?
What is the 3-month moving average of my sales?
Which orders shipped yesterday?
Oracle Business Intelligence includes a number of tools to answer these kinds of questions, including:
Gauges
Conditional formatting, including stoplight formatting
Graphs
Sorting and ranking
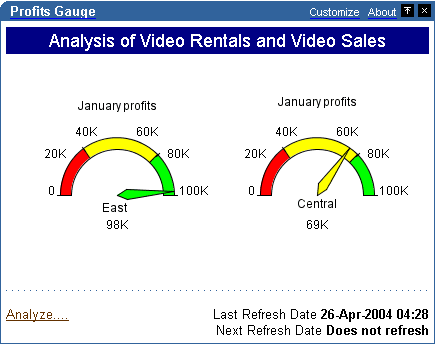
Gauges make it easy to see, at a glance, how well your business is meeting its strategic goals. You can plot current results against a specified metric, to see quickly where the actual data falls against the metrics. In Figure 1-1, two gauges show how well two regions meet their profit goals for January.
Figure 1-1 Gauges for January Profits in East and Central Regions
Gauges are available through OracleBI Discoverer Portlet Provider.
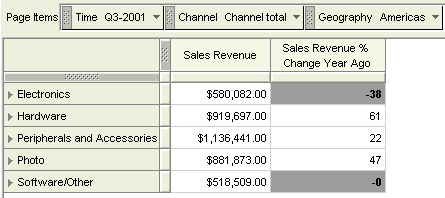
You can specially format data that meets a certain condition. For example, in Figure 1-2 negative sales revenue growth appears in bold type, with a shaded background.
Figure 1-2 Conditional Formatting of Negative Growth
Conditional formatting is available through Reports Builder, OracleBI Discoverer Plus, OracleBI Discoverer Viewer, and OracleBI Beans. When you use OracleBI Spreadsheet Add-In, you can also use Excel to apply conditional formatting.
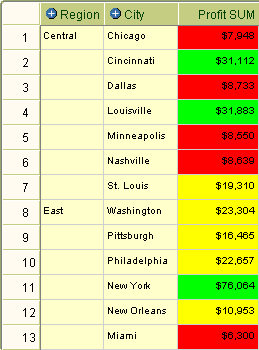
Stoplight formatting is specialized conditional formatting that uses traffic light colors to categorize data. In Figure 1-3, red cells identify cities in which profit is unacceptably low, green cells highlight categories in which profit is exceptionally high. All other values appear in yellow. You can quickly see which cities are doing well and which categories need attention.
Figure 1-3 Stoplight Formatting for Profit SUM
You can create stoplight formats with OracleBI Discoverer Plus, OracleBI Discoverer Viewer, and OracleBI Beans.
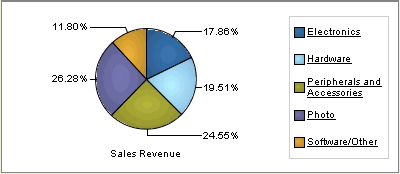
Graphs provide a quick overview of the state of your business. In Figure 1-4, a pie graph shows how sales revenue for different product categories contribute to total sales revenue.
Figure 1-4 Pie Graph Showing Product Category Contribution to Sales Revenue
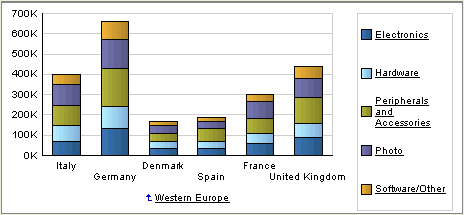
In Figure 1-5, a stacked bar graph shows revenues for different product categories in different European countries.
Figure 1-5 Stacked Bar Graph of Sales Revenue in European Countries
Graphs are available in all reporting and delivery components of Oracle Business Intelligence.
Sorting a report by its data values allows you to see your top and bottom performers quickly. With Oracle Business Intelligence, you can also create ranking reports. Figure 1-6 shows a ranking report in which cities are sorted by sales, within each region.
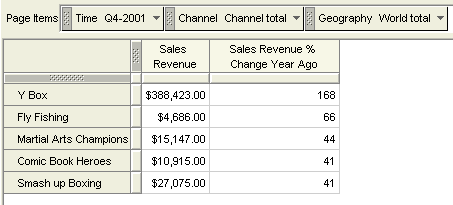
Oracle Business Intelligence also allows you to create a type of report that displays only those items at the top or bottom of the spectrum. Figure 1-7 shows the top five products based on growth in sales revenue.
Figure 1-7 Top Five Products Based on Growth in Sales Revenue
You can create ranking reports through Reports Builder, OracleBI Discoverer Plus, OracleBI Discoverer Viewer, OracleBI Spreadsheet Add-In, and OracleBI Beans.
Business Intelligence also helps you find the factors that contribute to the successes in your business, as well as the underlying causes of business problems. With Oracle Business Intelligence, you can answer questions such as the following:
Why are sales down in this region?
Where are sales down? And for which products?
Which products contribute most to our profits?
How did introducing that new line affect the sales of our existing offerings?
Which factors most influence whether someone is likely to buy our products?
Oracle Business Intelligence supports answering these types of questions by providing the ability to:
Display exception data
Drill interactively in data
Change data layout interactively
Mine data to determine attribute importance
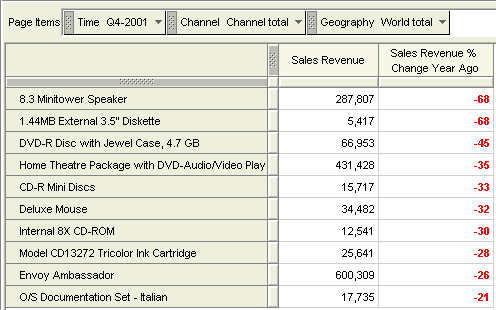
When you are investigating underlying causes, it is often helpful to display only exception data. For example, the report in Figure 1-8 shows only the products where sales revenue is down more than 20% from the previous year. The results are sorted by the percentage.
Figure 1-8 Products Where Sales Revenue Is Down More than 20 Percent
Reports Builder, OracleBI Discoverer Plus, and OracleBI Spreadsheet Add-In all provide wizards that allow you to create exception reports quickly and easily.
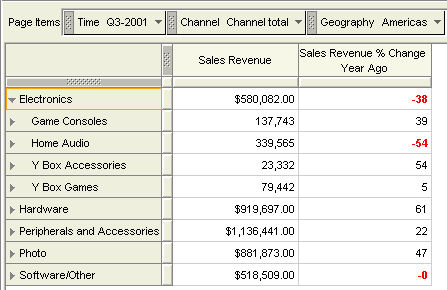
Interactive reports support the investigation of the reasons behind the numbers. You can drill to show more detail, and you can rearrange data to see it in another way. The report in Figure 1-9 highlights product categories that have negative sales revenue growth.
Figure 1-9 Crosstab Showing Negative Sales Revenue Growth in Electronics
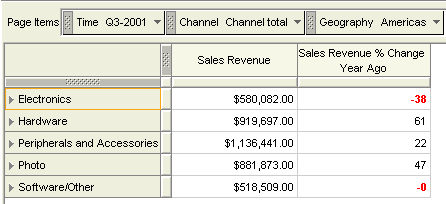
Figure 1-10 shows the same report, after drilling down to show more detail for the Electronics category. You can see that Game Consoles had positive growth, and that the negative growth for Home Audio brought down the sales revenue growth for the Electronics category as a whole.
Figure 1-10 Crosstab Drilled Down to Show Electronics Subcategories
You can also drill down in a graph. Figure 1-11 shows a graph of the Sales Revenue Percent Change Year Ago for different product categories. By clicking an underlined label, you can see a graph of the contributors for that product.
Figure 1-11 Graph of Sales Revenue % Change Year Ago
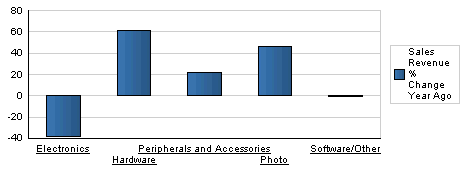
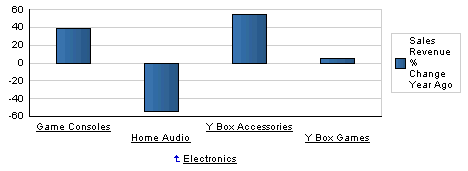
Figure 1-12 shows the same graph after clicking the Electronics label. You can see the effect of Home Audio on the Electronics category.
Figure 1-12 Graph After Drilling On Electronics
Drillable reports are available through Reports Builder, OracleBI Discoverer Plus and OracleBI Discoverer Viewer, and through OracleBI Beans.
You can also change the layout of the data to see it in a different way. Figure 1-13 shows the crosstab from Figure 1-9. In this view of the data, you can examine the Sales and Sales Revenue Percent Change together, by product category.
Figure 1-13 Sales and Sales Revenue Percent Change by Product Category

In Figure 1-14, the data has been rearranged, or pivoted, to see where and when revenue growth fell. You can see that the downward trend started earlier in the Americas and Oceania than in Asia or Europe, and that the trend remained downward through the fourth quarter in the Americas and Oceania, while in Europe and Asia, the trend has started to reverse.
Figure 1-14 Sales Revenue Percent Change by Time and Geography

Interactive reports are available through Reports Builder, OracleBI Discoverer Plus and OracleBI Discoverer Viewer, and through OracleBI Beans.
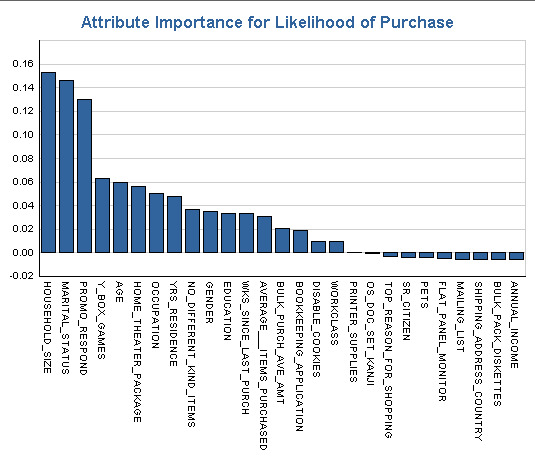
You can use Oracle Data Mining to find the factors, or attributes, that most strongly influence behaviors in customers or employees. For example, you can discover the attributes that matter most when you want to identify customers who are likely to make a purchase, so you can focus a marketing campaign efficiently. Figure 1-15 shows an assortment of customer attributes. The three most telling attributes are household size, marital status, and whether a customer has responded to previous promotions. Bars with negative values indicate attributes that you should not consider; they only confuse matters.
Figure 1-15 Data Mining: Attribute Importance
Oracle Data Mining is an option to Oracle Database. It includes Oracle Data Miner, a graphical interface that supports the creation of data mining models, for attribute importance and other data mining analyses.
It is not enough to know the state of your business and how the business got to be where it is. You need to be able to look ahead, to identify trends, and to plan for the future. Oracle Business Intelligence helps you answer forward-looking questions, such as:
What can we predict for sales next quarter?
What factors can we alter to improve the sales forecast?
What are our hot items going to be? How many should we make?
How many employees will we need for this new project?
How much should we budget for shipping?
To help you answer these types of questions, Oracle Business Intelligence provides support for:
Trend analysis
Modeling and planning
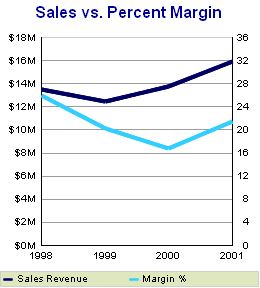
Trend analysis is at the heart of business intelligence. With Oracle Business Intelligence, trend analysis is easy. Graphs are ideal for showing trends. You can display data over time to see historical trends. For example, Figure 1-16 shows sales revenue and margin trends.
Figure 1-16 Graph of Trends in Sales and Margin
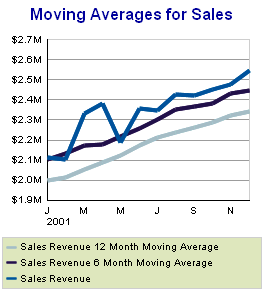
You can use time-based calculations, such as moving averages, to show trends, as is shown in Figure 1-17.
Figure 1-17 Sales Trends Using Moving Averages
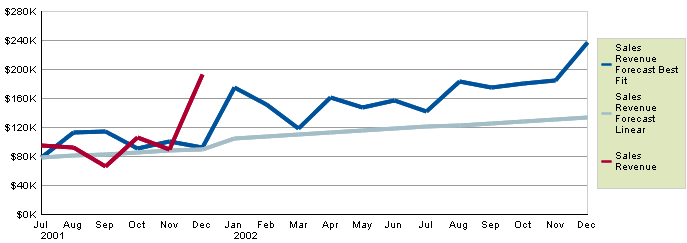
To extend trend analysis into the future, you can add models that predict future numbers based on past trends. Figure 1-18 shows two models that predicts sales revenue. The straighter line is a linear forecast, and the other line is a forecast that better fits the actual sales revenue so far.
Figure 1-18 Linear and Best Fit Forecasts
Forecasting is available in the OLAP option to Oracle Database. You can use OracleBI Beans to build a forecasting application.
Beyond forecasting and planning, you need sophisticated analytics to support crucial business decisions. With Oracle Business Intelligence, you can answer complicated business questions, such as:
How will our margins improve if we run this promotion?
What promotions should we run?
What products can we cross-sell to our existing customers?
Which customers should we target?
To help you answer these types of questions, Oracle Business Intelligence supports:
What-If analysis
Advanced analytics and data mining, for market basket analysis, customer response modeling, customer profiling and clustering, and predictive analytics
As you are considering new campaigns or business changes, it helps to be able to model different scenarios to examine the outcomes of different choices. Figure 1-19 shows a model for sales revenue, sales cost, and margin percentage for a scenario that includes no promotional campaigns. Sales revenue and sales cost are plotted against the left Y-axis, and margin percent is plotted against the right Y-axis.
Figure 1-19 What-If Model for No Promotional Campaign
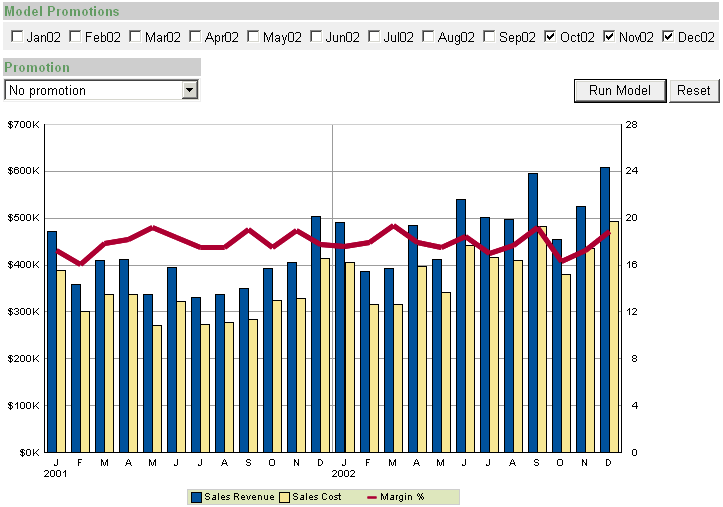
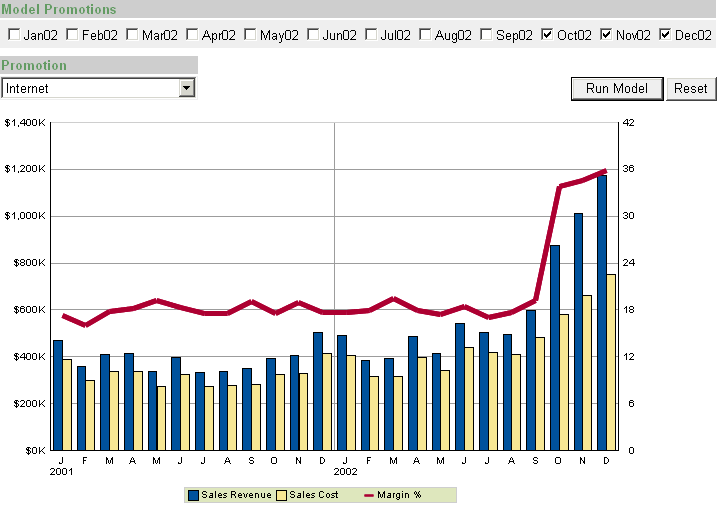
Figure 1-20 shows a model for using an Internet promotion over the last three months of the year. While both sales cost is higher for the months that the promotion runs, sales revenue nearly doubles for these months, and margin percent jumps significantly. Note that the scale of both Y-axes changes to accommodate higher values.
Figure 1-20 What-If Model for Internet Promotion
Modeling is available in the Oracle Database OLAP Option. You can use OracleBI Beans to build a what-if application.
Oracle Data Mining allows you to answer questions such as which customers are likely to buy a particular product. Figure 1-21 shows customers who are predicted to buy a product (PREDICTION = 1), along with the factors that most influence whether they will buy.
Figure 1-21 Customers Most Likely to Purchase a Product
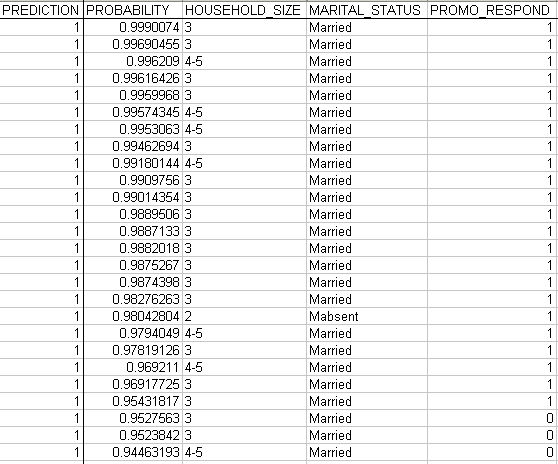
Armed with this information, you can then pull data for customers who are married, have three in their households, and who have responded to previous promotions, and you can focus your campaign on these customers.
Classification analysis and regression analysis are available in Oracle Data Mining.
Market basket analysis helps you see items to cross-sell in a store. Figure 1-22 shows the items that are most often purchased with a CD-ROM. About 15% of sales transactions include both a CD-ROM and a five pack of high-speed, read-write CDs.
Market basket analysis is available in Oracle Data Mining.
The report components that you use to display data can have a big impact on how well you understand the information. Oracle Business Intelligence supports a number of components for displaying data, including:
Tables
Crosstabs
Graphs
Text areas
You can arrange these components freely, so it is easy to produce reports such as:
Master-detail reports
Break reports
Linked reports
Shipping labels
Form letters
It is not enough to analyze data and to create reports. You must also deliver the results of your analysis. Oracle Business Intelligence provides a wide range of ways to present information. You can deliver information:
In a Web dashboard
In an interactive Web application
In print
As an e-mail attachment
In Excel
Dashboards are increasingly popular as a way to present business metrics. You can display a number of key metrics in a dashboard application. For example, Figure 1-23 shows a dashboard that contains gauges and stoplight formats. You can set parameters in the dashboard to see information about different regions and different years.
Figure 1-23 Business Intelligence Dashboard

OracleBI Discoverer Portlet Provider, in conjunction with OracleAS Portal, makes it easy to create dashboards that can be displayed in a Web browser. An OracleBI Discoverer workbook can contain the results of all kinds of analyses, from simple lists to forecasts and data mining results.
To deploy to other application servers, you can also use OracleBI Beans to develop dashboard applications.
You can also present reports in a Web application, where others can interact with them. They can change the content and the display of the data. They can format the data, rearrange it, drill in it, and save their changes. Figure 1-24 shows an interactive report in OracleBI Discoverer Viewer. This report was displayed from a link in the dashboard in Figure 1-23.
Figure 1-24 Stoplight Report in OracleBI Discoverer Viewer
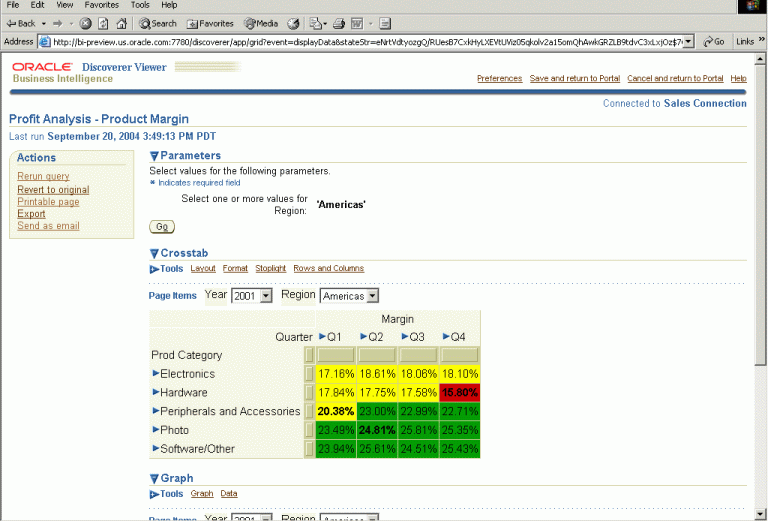
OracleBI Discoverer Viewer presents interactive reports that you create with OracleBI Discoverer Plus.
Many people are comfortable using Microsoft Excel, for reporting and analysis.
You can analyze data in OracleBI Discoverer and export the results in Excel format.
You can export data to Excel from OracleBI Discoverer Plus and from OracleBI Discoverer Viewer. From Oracle Reports, you can publish reports to comma-separated or tab-delimited formats, which can be imported into Excel.
In Oracle Data Miner, you can create and run data mining models and export the results to Excel.
With Oracle OLAP or Oracle Data Mining, you can work directly in Microsoft Excel.
OracleBI Spreadsheet Add-In allows you to connect to the database from Excel, which gives you the familiarity of Excel with the analytic capabilities of OLAP. The same interface that makes it easy to select data in OracleBI Discoverer Plus OLAP is available in OracleBI Spreadsheet Add-In. The data is stored in Oracle Database, and you connect to the database when you open the spreadsheet. This reinforces the database as the single source of truth for business data.
Oracle Spreadsheet Add-In for Predictive Analytics presents simplified data mining in Excel. You can use the Explain feature to help you understand your current data; for example, you can find factors that influence likelihood of purchase. You can use the Predict feature to find likely outcomes from existing data, such as predicting which transactions are likely to be fraudulent. With Oracle Spreadsheet Add-In for Predictive Analytics, you can mine data in Oracle Database, or the data can be in Excel itself.
From OracleBI Discoverer Plus Relational and from OracleBI Discoverer Viewer with a relational data source, you can also export to the Excel Web Query format, which allows you to run a relational query inside Excel. You cannot change this query in Excel, but it is a live run of the report, and not just snapshot data.
When you work with a spreadsheet Add-In, you can work directly in Excel to add sums and other calculations, graphs, formatting, and so on.
You can print reports from any of the Oracle Business Intelligence reporting components. OracleBI Discoverer has printing capabilities built in, allowing you to print reports from OracleBI Discoverer Viewer or from OracleBI Discoverer Plus. You can also export reports from OracleBI Discoverer in PDF format, for print quality without the printer.
For pixel-perfect printing of all kinds of data, Oracle Reports provides enterprise reporting capabilities. With Reports Builder, you have fine-grained control over the layout of reports, and you can create highly polished printed reports, in Postscript, in PCL, and in PDF formats.
As an enterprise reporting tool, Oracle Reports supports a range of printing needs, beyond those of analytic reports. With Oracle Reports, you can print mailing labels, form letters, invoices, checks, and other highly formatted documents.
Oracle Reports allows you to publish reports in a wide variety of formats, so you can use a number of applications to incorporate report data. In addition to publishing reports in print, over the Web, and in spreadsheets, Oracle Reports allows you to publish data in XML and RTF.
OracleBI Discoverer makes it easy to share reports across an organization, while preventing unauthorized access to reports. Oracle Business Intelligence Discoverer Administrator (OracleBI Discoverer Administrator) allows you to group available data into business areas and to allow access only to those who need it. In addition, reports that you create in OracleBI Discoverer Plus are stored in the database, which also allows you to control access to reports. Authorized users view the reports in OracleBI Discoverer Viewer or OracleBI Discoverer Plus.
Users of OracleBI Discoverer Viewer can send reports to other users through e-mail. When you use OracleBI Spreadsheet Add-In, you can easily attach the resulting spreadsheet to an e-mail message. Those users are authenticated when they try to connect to the data, so you do not have to worry about report recipients changing the data and passing it on.
Oracle Spreadsheet Add-In for Predictive Analytics allows you to share the results of a data mining application in a spreadsheet, separated from the database where the data has been analyzed, so users do not need database access to see the results of the analysis.
Oracle Reports supports highly sophisticated report distribution. For example, you can schedule report distribution, such that the report can be run overnight and sent by e-mail to a set of recipients. You can also schedule the printing of reports, and Oracle Reports supports bursting, where a report can be split into a number of printed reports, based on sets of data in the report. This allows you, for example, to split a Sales report by district and to print data for each different district as a separate report.