| Oracle® Warehouse Builder User's Guide 10g Release 2 (10.2.0.2) Part Number B28223-05 |
|
|
View PDF |
| Oracle® Warehouse Builder User's Guide 10g Release 2 (10.2.0.2) Part Number B28223-05 |
|
|
View PDF |
The Metadata Dependency Manager enables you to detect and resolve the impact of the changes made to the object definitions or the metadata in the Warehouse Builder repository.
This chapter contains the following topics:
The Metadata Dependency Manager generates lineage and impact diagrams for any data object. A lineage diagram traces the process flows for an object back to the data source and displays all objects along that path. An impact diagram identifies all the objects that are derived from selected object.
This type of information can help you in many circumstances. For example, you can use these diagrams to:
Comply with government regulations or other audits that require tracking of financial data.
Modify the system design because of changes in the source data.
Modify the system design because of new requirements for reporting and analysis.
Assess the impact of design changes in a pluggable map that is used throughout a project.
The Dependency Manager enables you to plan your project by previewing the impact of the changes or future changes. If you are planning to introduce changes to your source systems, you can use the Dependency Manager to gauge the impact of that change on your warehouse design. Or, if the change has already been introduced, then you can plan the time required to update your ETL design and rebuild your data warehouse.
Figure 31-1 shows the Metadata Dependency Manager. Like other windows in Warehouse Builder, the Dependency Manager has menus, toolbars, a navigator, a property inspector, and a canvas. The canvas displays one or more diagrams.
For specific information about these components, choose Topic from the Help menu.
Source databases often undergo changes even after a data warehouse has been designed and built. These changes imply a corresponding change, or impact, in your Warehouse Builder design or metadata. Warehouse Builder enables you to reimport the modified source definitions into the repository. However, your original warehouse design may no longer remain valid with the re-imported definitions, and you may need to make changes to the design and fix the inconsistencies.
You need to first find out how the warehouse design is affected by the changes in source and then determine all the design objects that are dependent upon the sources must synchronize the metadata so that all the affected design objects are updated to reflect the changes in the source. After this process is complete, you can redeploy the updated design to rebuild your data warehouse and synchronize the data.
In this scenario, a company retrieves all its statistical reports from a flat file named CUSTOMERS. Over a period of time, the file definition needs to be changed to generate reports on additional parameters. The statistical analysis database has also recently migrated from Oracle 9i to Oracle Database 10g.
The designers at this company first need to synchronize the modified metadata definitions for this file in the design repository with all the design objects and mappings that are based on its data. The CUSTOMERS flat file is part of multiple mappings in the ETL design, and any changes to its definitions invalidate all them. Manually tracking all the areas impacted by the CUSTOMERS flat file and updating the definitions is a process prone to errors.
The Dependency Manager enables them to identify all of the objects that are affected by this change to the data source. They can be sure that each related design object is updated so that the ETL designs remain valid. After finishing this process, they can redeploy the affected tables and the updated ETL design objects to their data warehouse.
Lineage and Impact Analysis (LIA) diagrams show the relationships among objects managed by Warehouse Builder. These relationships are constructed by mappings and process flows. The lineage diagram for a particular object shows its source objects, and the impact diagram shows its targets.
Lineage and impact are mirror images of each other. If Object A is part of the lineage diagram of Object B, then Object B is part of the impact diagram of Object A. When you read a diagram from left to right, you are seeing impact. When you read it from right to left, you are seeing lineage.
For example, you might have a mapping that extracts data from a file and loads it into a table by way of an external table. This is the relationship:
flat_file > external_table > table
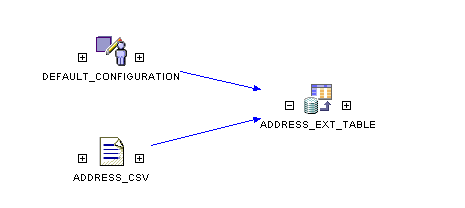
Figure 31-2 shows a lineage diagram of an external table named ADDRESS_EXT_TABLE. ADDRESS_CSV is a flat file, and it is part of the lineage of ADDRESS_EXT_TABLE. Thus, any change to ADDRESS_CSV will impact ADDRESS_EXT_TABLE.
Figure 31-2 Lineage Analysis Diagram for ADDRESS_EXT_TABLE

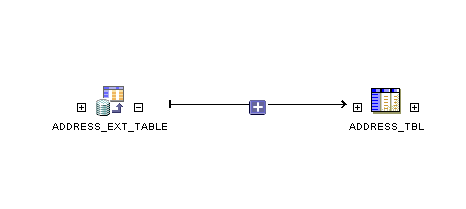
Figure 31-3 shows an impact diagram of ADDRESS_EXT_TABLE, which includes the ADDRESS_TBL. Any change to ADDRESS_EXT_TABLE will impact ADDRESS_TBL. ADDRESS_EXT_TABLE is part of the lineage of ADDRESS_TBL.
Figure 31-3 Impact Analysis Diagram for ADDRESS_EXT_TABLE

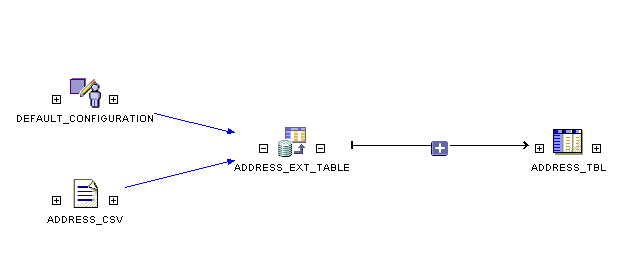
You can easily see both the lineage and the impact of an object just by clicking the plus signs (+) on either side of the object icon, as shown in Figure 31-4.
Figure 31-4 Lineage and Impact Analysis Diagram

You can generate an LIA diagram from the Project Explorer in the Design Center or by first opening the Metadata Dependency Manager.
To generate a diagram from the Design Center:
Expand the Project Explorer until you see the object that you want to analyze.
Right-click the object and choose Lineage or Impact from the popup menu.
The Metadata Dependency Manager will open with the diagram.
The Lineage and Impact commands are also available from the View menu.
To generate a diagram from the Metadata Dependency Manager:
From the Design Center Tools menu, choose Metadata Dependency Manager.
The Metadata Dependency Manager is displayed.
Expand the DM Context Tree until you see the object that you want to analyze.
Right-click the object and choose Show Lineage or Show Impact from the popup menu.
The diagram will be displayed on the canvas.
Your initial selection of an object and a diagram type simply determine the initial starting point and the direction that the diagram branches from that object. You can modify an LIA diagram in the following ways:
Drag-and-drop another object onto the diagram.
Click the plus (+) and minus (-) signs next to an object icon to expand or collapse a branch of the diagram.
Use the grouping tool to collapse a section of the diagram into a single icon, as described in "Using Groups in an LIA Diagram".
Double-click an object to display its attributes, as described in "Displaying an Object's Attributes".
Groups enable you to organize the objects in a complex diagram so that they are easier to locate and edit. By reducing the number of objects in a diagram, you can more easily focus on the objects currently of interest.
To create a group:
Select a group of objects by dragging and dropping a box around them.
Click the Group Selected Objects tool.
The Group Selected Data Objects dialog box is displayed.
Enter a name for the group.
The selected objects are collapsed into a single folder icon.
To display the individual objects in a group, double-click the folder icon. You can work on these objects in the same way as ungrouped objects.
To ungroup the objects, select the group and click the Ungroup Selected Object tool.
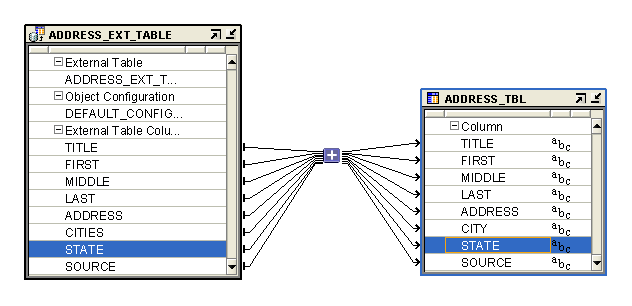
You can expand an object icon in a diagram so that you can examine its attributes. Figure 31-5 shows two expanded icons whose column attributes are connected by a mapping.
To expand an icon, double-click it. To reduce it to an icon, click the down arrow in the upper right corner.
To generate an LIA diagram for an attribute:
Generate an LIA diagram for an object.
Double-click the icons to display their attributes.
Right-click an attribute and select Show Lineage or Show Impact.
The attributes along the lineage or impact path for the selected attribute are highlighted in a different color.
You may use this detailed information for auditing or when planning to propagate changes.
Figure 31-5 Expanded Icons in an LIA Diagram

The LIA diagrams identify all of the objects that may be invalidated by a change to one or more objects. With this knowledge, you can examine the affected objects and modify them as necessary.
You can make these changes within the Dependency Manager, using either of these methods:
Object Editor: Provides extensive editing capabilities by opening the standard editor for the object.
Propagate Changes tool: Provides basic editing capabilities such as changing the name, data type, or precision for a single column or attribute.
To open the object editor:
Right-click the object icon in a diagram, and choose Open Editor from the popup menu.
To use the Propagate Changes tool:
Double-click the object icon in a diagram.
The icon will expand to show its attributes.
Right-click the attribute that you want to change, and choose Propagate Change from the popup menu.
The Propagate Change dialog box is displayed.
Make your changes to the attributes in the New Value column and select the Propagate box.
Click OK.
The Metadata Dependency Manager is a graphical interface that represents the potential impact of a change in the definition of an object. It has the following components:
The Metadata Dependency Manager menu bar provides commands for performing various tasks. Some of these commands are also available on the toolbars.
The Analysis menu contains the following commands:
Close: Closes the Dependency Manager.
Export Diagram: Exports the active diagram to the local file system as an SVG or JPEG file.
Print Options: Provides Print Setup, Preview, and Print options for printing the diagram.
The Edit menu contains the following commands:
Open Editor: Opens the Editor for the currently selected object.
Hide: Removes the selected objects from the canvas. Use the Refresh command on the View menu to restore the hidden objects.
Select All: Selects all objects displayed on the canvas.
Propagate Changes: Displays the Propagate Changes dialog box for a selected attribute. Use it to change the value of an attribute and to propagate that change to all objects downstream. For example, you can select a column in a table object and change its name, data type, and so forth.
Group Selected Objects: Creates a group containing the selected objects on the canvas. A folder icon represents all objects in the group. Double-click the icon to display the individual objects in the group. Grouping enables you to reduce clutter on the canvas when there are many objects.
Ungroup Selected Objects: Eliminates the selected group so that all objects are represented individually.
Group By Module: Automatically groups all objects by module. A folder icon represents the module and all objects in the module. Double-click the icon to display the individual objects in the group.
Ungroup Modules: Eliminates the module groups so that all objects are represented individually.
The View menu contains the following commands:
Toolbars: Displays or hides the Graphic tools or the Edit tools.
Mode: Sets the pointer for one of these actions:
Select: Selects one or more objects on the canvas.
Pan: Moves the entire diagram on the canvas.
Interactive Zoom: Expands the diagram as you move the pointer down, or shrinks the diagram as you move the pointer up.
Navigate Edge: Selects the next object in the flow.
Zoom: Displays a list of percentages that expand or shrink the diagram.
Fit in Window: Automatically chooses a size for the diagram so that it fits on the canvas.
Auto Layout: Organizes the objects and displays the diagram at its default size.
Center: Centers the diagram on the canvas.
Show Full Impact: Generates the full impact diagram of the selected object.
Show Full Lineage: Generates the full lineage diagram of the selected object.
Show Lineage: Displays the next level of objects in the lineage diagram of the selected object.
Hide Lineage: Hides the lineage of the selected object.
Show Impact: Displays the next level of objects in the impact diagram of the selected object.
Hide Impact: Hides the impact of the selected object.
Expand: Expands the selected icon in the diagram. The expanded icon shows the details of the object, such as the columns in a table or the attributes in a dimension.
Expand All: Expands all the object icons in the diagram.
Collapse: Collapses the expanded icon for a selected object.
Collapse All: Collapses all the expanded icons on the canvas.
Refresh: Refreshes the Dependency Manager diagram to reflect recent changes in the repository.
The Metadata Dependency Manager provides two toolbars as shortcuts to frequently used commands:
Use the Bird's Eye View to quickly change the portion of the diagram currently displayed on the canvas. This view displays a miniature version of the diagram on the canvas, with a scrollable box that represents the dimensions of the canvas. Drag the box to the area of the diagram currently of interest to you.
Use the DM Tree to change the content of the canvas. The DM Tree has these tabs:
DM Context Tree: Lists objects in the current project. Right-click an object, and use the popup menu to generate a new diagram or to add the object to the current diagram. You can also drag-and-drop an object onto the current diagram.
DM Graph Tree: Lists the current diagrams. You can close a diagram on the canvas, then use this list to redisplay the diagram without regenerating it.
Use the Property Inspector to view an object's properties.
To change the current object in the Property Inspector, right-click the object on the canvas and select Update Property Inspector on the popup menu.
For a description of a property, select the property in the Inspector. The description appears at the bottom of the window.
Use the canvas to display one or more lineage and impact diagrams. Each diagram is displayed on a separate tab.
You can use these techniques to create and manipulate diagrams on the canvas:
To open a new diagram, right-click an object in the DM Context Tree and choose Show Lineage or Show Impact from the popup menu.
To close a diagram, click the X on the tab. You can redisplay the diagram from the DM Graph Tree until you close the Metadata Management window.
To add an object to the canvas, drag-and-drop it from the DM Context Tree.
To display more of the lineage of an object, click the plus sign (+) to the left of its icon. To hide the lineage, click the minus sign (-) to the left.
To display more of the impact of an object, click the plus sign (+) to the right of its icon. To hide the impact, click the minus sign (-) to the right.
To display the details of an object, double-click it. You can then select an individual property and edit it by choosing Propagate Changes from the Edit menu.
To edit an object, right-click its icon and choose Open Editor from the popup menu.
Use this dialog box to make changes to an attribute and to propagate those changes to the repository.
Propagate
Identifies whether the change to an attribute value is propagated to the repository. Select this box to propagate the changes.
Attribute
Lists the attributes for the selected object, such as the columns of a table.
Existing Value
Displays the current values of the attributes, such as the data type.
New Value