| Bookshelf Home | Contents | Index | PDF | |
|
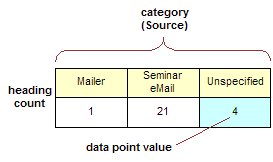
Configuring Siebel Business Applications > Configuring Special-Purpose Applets > Customizing a Chart Applet > How Siebel CRM Constructs a Chart AppletSiebel CRM builds a chart as an applet that contains one or more Chart object definitions. A Chart is a child of an applet. The Business Component property of a chart applet identifies the business component that provides data that Siebel CRM displays in a chart applet. Records in this business component are subject to the current view, the current query, and visibility requirements. Business component fields provide the data for the category, data point, and series axes in a chart applet. The properties of the chart object define the relationship between axes and fields. A single bar or line graph is the simplest form of chart applet. It contains no series axis and only a category field and a data point field are defined. Siebel CRM plots pairs of category and data point field values as points or bars. If multiple records use the same category value, then Siebel CRM adds together their data point values. Figure 57 illustrates how Siebel CRM plots the number of opportunities on the data point axis against the source of the opportunity on the category axis. Example sources include referral, magazine article, Web site, and so forth. To generate the data required for the line, Siebel CRM checks the Source field in each record and tallies the number of opportunities for each distinct source value. Figure 58 illustrates the result, which is a two row temporary table that includes a column for each source. Figure 59 illustrates a multiple line chart where Siebel CRM adds a row to the temporary table for each line in the series. Figure 60 illustrates the temporary table for a multiple line chart. Properties of the Chart ObjectTo create the data mapping from the business component to the chart applet, you must define the properties of the Chart object that are described in this topic. For situations where these properties are configured differently, see How Siebel CRM Constructs a Chart Applet and Siebel Object Types Reference. Table 42 describes properties of the Chart Object. |
 |
|
| Configuring Siebel Business Applications | Copyright © 2011, Oracle and/or its affiliates. All rights reserved. Legal Notices. | |