|
Applications Administration Guide > Target Account Selling >
Conducting an Organizational Analysis
Sales professionals can use the Organizational Analysis view to create formal and informal organizational charts that visually summarize their contact analyses. The Organizational Analysis view toggles between a Contacts list and an Organization Map. Contacts previously associated with the opportunity automatically appear in both views. The contacts shown in the Contacts list appear in the Organization Map view. The toggle control list is shown in Figure 36. You can click New in either the Contacts list view or the Organization Map to create contact records. Position the pointer on the information icon to display information on the view.
Figure 36. Organizational Analysis View, Contacts List, and Organization Map Toggle
|
Regardless of which view you use to create or select contacts, analyze each contact based on the criteria taught in the Target Account Selling methodology training program. This criteria includes Buying Role, Your Status, Level of Influence, Adaptability to Change, and Coverage. The Level of Influence that you assign to each contact determines the degree of shading that appears in the contact node in the Organization Map. Table 95 explains the contact node shading for each value in the Level of Influence field.
Table 95. Level of Influence Shading for Contacts
Value in Level of Influence Field |
Shading on Organization Chart |
Low |
None |
Political Structure (Medium) |
Light gray |
Inner Circle (High) |
Dark gray |
You can also map the politics in the customer organization by identifying formal and informal lines of influence between contacts. Mapping informal lines of influence helps you identify contacts who may not be ranked highly (and are easier to access) but have significant influence on key decision makers. To begin an organizational analysis
- Navigate to the Opportunities screen > List view.
- Drill down on an opportunity record.
- Click the Target Account Selling view tab.
- In the lower link bar, click Organizational Analysis.
The Organization Map view appears.
- Add new contacts.
You can also add new contacts by choosing Contacts from the drop-down list and entering the contacts in the list.
To create the Organization Map
- In the view drop-down list toggle, select Organization Map.
The organizational chart displays the nodes (boxes) containing information for each of the contacts you have analyzed and associated with the opportunity.
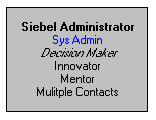
The following figure shows an example of a contact node (box) with the Level of Influence shading of dark gray. The node includes information about the contact, such as the contact's title and other contact analysis information (Decision Maker, Mentor).
You can visually represent the formal hierarchy in the organization by creating the Organization Map of key contacts in the deal.
- Select the contact node and drop it on top of the contact node that represents the contact's manager.
When you drop the contact node on the manager node, a line appears between the nodes, reflecting the reporting relationship.
- Repeat this procedure for each contact until you have completed the organization chart.
NOTE: The reporting relationships are also stored in the Contacts list (toggle view). The Manager Last Name and Manager First Name fields in the contact record are automatically populated. To expose this information in the contacts list, click the menu button, and then choose Columns Displayed.
To delete contacts on the Organization Map
- Right-click on the contact node and choose Edit > Delete from the menu.
NOTE: Contacts deleted from the organization map are no longer associated with the opportunity. However, the contact record still exists in your Contacts screen list.
To draw lines of influence
- In the Organization Map, press the CTRL key and simultaneously select the contact.
- Drag and drop the selected contact node on other contacts to draw the lines of influence.
The CTRL key must be depressed throughout this process for the informal line of influence to appear.
NOTE: This information is automatically updated in the Relationships view of the Contacts screen. You can indicate lines of influence in the Relationships view if you prefer.
To delete lines of influence on the Organization Map
- Right-click on the line and choose Edit > Delete from the menu.
To print the Organization Map
- Right-click on the Organization Map and select Zoom from the menu.
- Choose the Zoom level at which you want to print the chart.
- Right-click the Organization Map again and choose Print from the menu.
The Organization Map prints at the selected zoom level. Large charts print across multiple pages.
NOTE: The Organization Map does not print in the Initial Plan Report or Opportunity Plan Report. You must print it from the Organization Map view using the right-click menu.
|