

|
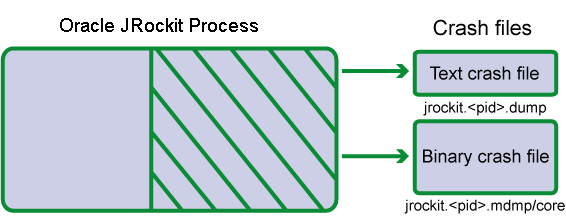
Your JVM process has suddenly crashed, which has resulted in the Oracle JRockit JVM creating a snapshot, crash files, of the state of the computer and the JVM process at the time of the crash. These crash files are written to disk and are called a bit different depending on which platform you are using and the kind of information contained within the file (see Figure 31-1).
You can use some the information in the crash files to determine the nature of the problem that caused the JVM to crash. The information contained in the crash files is also essential for the support organization within the JRockit JVM to help solving problems with the JVM. When submitting problem reports to the Oracle support organization, you need to include these crash files (see Submitting Problems to Oracle Support for more information).
This section provides information on the differences between the crash files and how to enable and disable them. You will also find example crash files and diagnostics leads on how to interpret the information in the text crash file, which will enable you to identify solutions to how to either fix your Java application or the way you use and set up the JRockit JVM.
This section includes information on the following subjects:
When the JRockit JVM crashes it creates two types of crash files (see Figure 31-1): a text crash file called dump and a binary crash file called mdmp (a Windows platform minidump) or core (a Linux and Sun platform core file). The format of the two types of crash files is: jrockit.<pid>.dump and jrockit.<pid>.mdmp/core, where pid is the process id that appears as a number, for example, jrockit.72.dump.

The information contained in the text dump file is information about the JVM at the point of time for the crash. This information can give hints and leads to why the JVM has crashed. See Listing 31-1 through Listing 31-4 for an example of the information contained in a text dump file. The text dump file can be viewed in a regular text editor. To turn the creation of the text dump file off, see Disabling Text dump Files.
The information in the binary core or mdmp crash file contains information about the entire JRockit JVM process and needs to be opened in a debugger. The size of the binary crash file is usually quite large, so you need to make sure there is enough disk space for the file to be completely written to disk. By default, the JVM records a full binary crash file. To set the size of the binary crash file, see Binary Crash File Sizing. To turn the creation of the binary crash file off, see Disabling the Binary Crash Files.
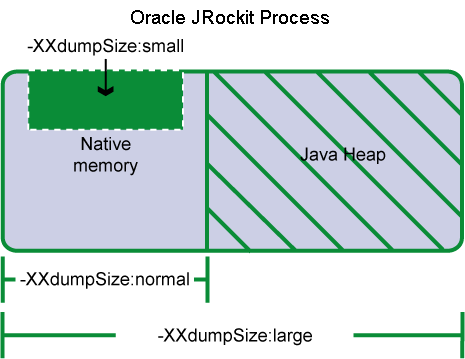
The size of the binary core or mdmp crash files vary tremendously. The text dump file is normally a very small file, usually under 100kB. The binary crash files, on the other hand, are, by default, set to log the entire JRockit JVM process (see Figure 31-2) and therefore become very large, which demands greater storage capacity on your system.
You can se the crash file size using the command line option -XXdumpSize. The default setting is -XXdumpSize:large. A large dump contains the entire JVM process including the Java heap. While small and normal settings are also available, neither of these sizes are adequate for troubleshooting a JVM crash since the Java heap is excluded.
If you don’t want a binary crash file, you can set -XXdumpSize:none. For more information on this option, see -XXdumpSize in the Oracle JRockit JVM
Command-Line Reference.

| Note: | Remember that you need to provide a <large> binary core or mdmp crash file with any problem that you submit to the Oracle JRockit support organization. |
If there is not enough memory on the disk where the crash file is written for the entire binary crash file, the file will become as large as possible, i.e. fill up the disk.
Both the binary crash files and the text dump files are saved to your current working directory (see Enabling Binary core Crash Files on Linux and Sun Solaris). If you want to save the crash files in a different location, use the environment variable JROCKIT_DUMP_PATH and specify where you want the information located. The path that you specify must exist and be writable.
For the Linux and Sun Solaris systems, you need to set ulimit -c <value> to something greater than zero, for example, ulimit -c unlimited. This value is measured in blocks, with each block equaling one kilobyte. You can set the value from either the command line or in a shell script. To disable crash files on Linux and Solaris, set ulimit -c 0.
To specify the where the JRockit JVM should put the binary core crash file, enter the following:
export JROCKIT_DUMP_PATH=<path to directory>
Binary mdmp files are always created on Windows. If you do not specify the variable JROCKIT_DUMP_PATH, the crash files end up in the current directory (the directory from where you start the JVM).
To specify the where JRockit JVM should put the crash file, enter the following:
set JROCKIT_DUMP_PATH=<path to directory>
The crash files are enabled by default so that you will be sure to get as much information as possible about your application and the JRockit JVM process as possible in the event of a crash; however, there might be times when you do not want the JVM to create any type of crash file, for example, if you have limited disk space.
Before turning the creation of the crash files off, please remember that the text dump file is a small and good source of information to get an initial grasp of what has gone wrong with the JVM and the binary core or mdmp crash file is essential when creating a support case for the Oracle JRockit support organization.
If you suspect problems with the creation of text dump files you can turn off the text dump file by using the option: -XXnoJrDump.
You can turn off the binary crash file by using the option: -XXdumpSize:none.
A JVM crash means that something has happened that the JVM couldn’t handle gracefully. The cause can be a programming error in the JVM, but a crash may also indicate a problem in the Java code or in the JVM setup. The dump file is a good source of initial troubleshooting information to help you identify the problem.
A dump file will not necessarily tell you exactly why the crash occurred, but it describes the environment where the JRockit JVM was running and the state of the JVM when the crash occurred. This gives some hints on where to start looking and can give an idea of the crash type. There are however some easily identified symptoms that you can look for in the dump file:
StackOverFlow field in the dump file. If this field indicates that stack overflow errors have occurred, the crash is likely to have been caused by a stack overflow. See Stack Overflow Crash for information on how to deal with stack overflow crashes.Stack Overflow in the Error message field or in the stack trace near the bottom of the dump file. Such occurrences may also indicate a stack overflow. See Stack Overflow Crash for information on how to deal with stack overflow crashes.C Heap field in the dump file. If this field indicates that memory allocations have failed, the process may have run out of virtual memory. See Out Of Virtual Memory Crash for information on how to deal with out of virtual memory errors.LD_ASSUME_KERNEL field in the dump file. Having this Linux-specific environment variable set usually leads to the JRockit JVM using unsupported system libraries and becoming unstable. See Unsupported Linux Configuration Crash for information on dealing with unsupported Linux configuration problems.
If none of these symptoms apply to your dump file you can try troubleshooting further using the information in JVM Crash or open a support case. To open a support case you must have a service agreement with Oracle.
This section shows an example of what a text dump file might look like and explains the parts of the dump file. The text dump file that has been used in this example is a combination of many different dump files, so that more crash scenarios can be covered.
Remember that the text crash files are not full descriptions of what has happened in the crash and the layout of the text crash file the JVM produces might differ from the examples given here.
Listing 31-1 shows an example of the first part of a dump file.
Listing 31-1 shows the start of the text dump file. This section contains information about when the crash occurred and for how long the JVM has been running. The file locations refer to the location of both text and binary crash files.
If you have a service agreement with Oracle, you can file a support case with your Oracle service provider. If you do not have a service agreement, you can post your problem on the Oracle JRockit JDK
developer forum under jrockit.developer.interest.general. Posting your problem on the forum is no guarantee to get it resolved, but the forum is a good source for information on JRockit JVM problems.
The information block that starts with Error Message, shows the actual error message that the operation threw at the time of the crash. Check your operating system vendor users information to find out more about the error.
Use the Version description to see if you are running the latest version of the JRockit JVM, see Oracle JRockit Supported Configurations for a complete list of supported versions.
GC stands for Garbage Collector and this description states which garbage collector that has been used. In this example, the generational concurrent (gencon) garbage collector has been used. Since the generational garbage collector has been used, there is a listing of where in the memory the nursery starts and ends. The mmStartCompaction and mmEndCompaction values are a description of where in the heap the compaction of the heap has taken place during the current or latest garbage collection.
For more information on memory management in the JRockit JVM, see Understanding Memory Management.
The information block that starts with CPU, describes how many CPUs that have been used and how much memory (Tot Phys Mem) that has been consumed by the Java process, application, or the JRockit JVM.
The OS version states the operating system version that you are running on. Please make sure that you are running on a supported operating system version, see Oracle JRockit JDK Supported Configurations.
The Thread field indicates the thread system that the JRockit JVM used at the time of the crash. In this example the JVM used the Native POSIX Thread Library (NPTL).
The State of the JVM at the time of the crash was that it was running. Other valid states could be starting up or shutting down.
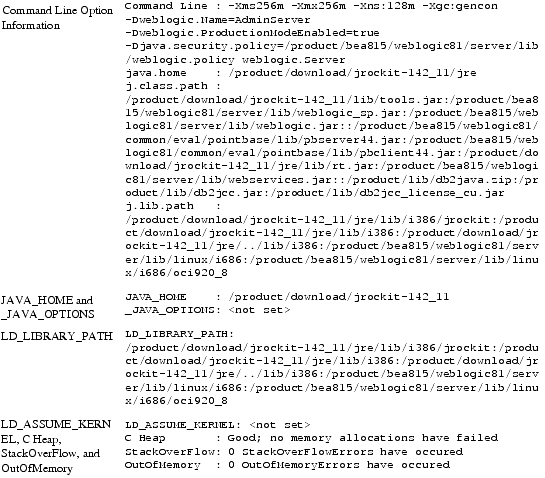
The second part of the example, see Listing 31-2, starts with the text Command Line.

Command Line lists all startup options that were sent to the JRockit JVM at startup. The example in Listing 31-2 has used command line options for setting a generational concurrent garbage collector (-Xgc:gencon), with an initial minimum and maximum Java heap (-Xms and -Xmx), and a nursery size setting (-Xns).
JAVA_HOME is the path to your Java home catalog; that is, where the JRockit JVM is installed. _JAVA_OPTIONS is a list of command line options that will be automatically passed to all newly started JRockit JVMs.
LD_LIBRARY_PATH is a Linux /Solaris specific environment variable that can make the JRockit JVM find libraries other than the default system libraries. Sometimes, you need to set this variable for running JNI code. You can set this variable so that the JVM starts using unsupported libraries on otherwise supported platforms.
The information block that starts with LD_ASSUME_KERNEL lists information of what might have gone wrong prior to the crash. See Symptoms to Look For for more information on what to look for in these fields.
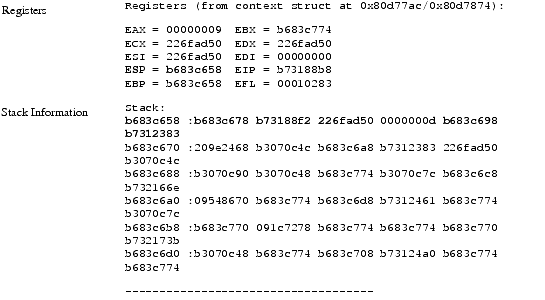
The third part of the example, see Listing 31-3, starts with the text Registers.

The Registers section is only useful to Oracle Support personnel troubleshooting your issues. You can ensure that the text crash file is not corrupt if the register ESP and the first number of the stack match (Listing 31-3). If these two numbers do not match, you can suspect that the text dump file itself is incorrect.
If the stack information says “unreadable” instead of showing numbers, the crash is probably due to stack overflow. The Stack information section is usually much longer than the one shown in Listing 31-3.
The information block that starts with Stack, see Listing 31-4, describes what has happened and where it happened in the thread stack at the point of the crash.
The Thread Stack Trace shows what the crashing thread was doing when the JRockit JVM crashed; for example, Listing 31-4 shows that a crash occurred during code generation.
Stack 0: start=0x108c64000, end=0x108cc4000, guards=0x108cb0000 (ok), forbidden=0x108ca8000 Stack 1: start=0x108c44000, end=0x108c64000, guards=0x108c58000 (ok), forbidden=0x108c60000
Thread Stack Trace:
at get_constant_alen+576()@0x2000000000631110<!-- this is the crashing point
at get_constant_alen+256()@0x2000000000630fd0
at alength_opt+96()@0x2000000000631300
at optStrengthReduction+320()@0x2000000000631c80
at optmanOptimizeMIR+656()@0x20000000005efbf0
at generateMethodWithStage+256()@0x20000000004a2920
at cmgrGenerateMethodFromPhase+320()@0x20000000004a2a70
at cmgrGenerateNormalMethod+240()@0x20000000004a27b0
at cmgrGenerateCode+672()@0x20000000004a2310
at generate_code2+896()@0x2000000000702830
at codegenThread+1312()@0x20000000007031c0
at tsiCallStartFunction+48()@0x20000000007b3640
at tsiThreadStub+336()@0x20000000007b53d0
at ptiThreadStub+80()@0x20000000007995c0
at start_thread+352()@0x20000000001317f0
at __clone2+208()@0x20000000002fb9f0
-- Java stack --
Additional information is available in:
	/usr/bea/user_projects/domains/jal/jrockit.17727.dump
	/usr/bea/user_projects/domains/jal/core or core.17727
If you see this dump, please open a support case with Oracle and supply as much information as you can on your system setup and the program you were running. You can also search for solutions to your problem at http://forums.bea.com in the forum jrockit.developer.interest.general.
Extended, platform specific info:
libc release: 2.3.4-stable
Elf headers:
libc		ehdrs:	EI:	7f454c46010101000000000000000000 ET: 3 EM: 3 V: 1 ENTRY: 004e8f20 PHOFF: 00000034 SHOFF: 001346c4 EF: 0x0 HS: 52 PS: 32 PHN; 10 SS: 40 SHN: 70 STIDX: 67
libpthread		ehdrs:	EI:	7f454c46010101000000000000000000 ET: 3 EM: 3 V: 1 ENTRY: 00704840 PHOFF: 00000034 SHOFF: 000107c4 EF: 0x0 HS: 52 PS: 32 PHN; 9 SS: 40 SHN: 39 STIDX: 36
libjvm		ehdrs:	EI:	7f454c46010101000000000000000000 ET: 3 EM: 3 V: 1 ENTRY: 0004ff30 PHOFF: 00000034 SHOFF: 0029d7c4 EF: 0x0 HS: 52 PS: 32 PHN; 3 SS: 40 SHN: 20 STIDX: 17
===== END DUMP =======================================================


|