

|
This section describes the BEA JRockit Memory Leak Detector (from now on referred to as Memory Leak Detector) start-up procedure and the user interface. Information on the following topics are included:
The memory leak detection process consists of three phases:
Trend analysis means to observe continuously updated object type related information and try to discover object types with suspicious memory growth. These object types should then be studied in the next phase of the memory leak detection process. The information in the trend analysis table is updated every ten seconds or more often if there are very frequent garbage collections.
Studying object type relations means following reference paths between object types. The goal is to find interesting connections between growing object types and what types of objects point to them. Finding the object type guilty of unusual memory growth will lead to the third and final phase of the memory leak detection process.
Instance investigation consists of finding an instance of abnormal memory size or an abnormal amount of references being held and then inspecting that instance. When inspecting an instance, values will be displayed; e.g. field names, field types, and field values. These values will hopefully lead you to the correct place for the error in the application code; i.e. where that particular instance of that particular object type is allocated, modified, or removed from the collection, depending upon what the situation implies. Minimizing the problem areas of the ones connected to the suspected instance will most likely lead you on the right track to finding the actual problem causing the memory leak and you will be able to fix it.
Before you start the Memory Leak Detector and your application, you need to start the management server.
-Xmanagement option to the command line.memleak in a command window.
For information on ports, see the User Guides for the Management Console:
http://edocs.bea.com/jrockit/tools/usingjmc/start.html#1035010 (for JRockit 5.0)
http://edocs.bea.com/jrockit/tools/usingjmc142/mancons.html#1001904 (for JRockit 1.4.2)
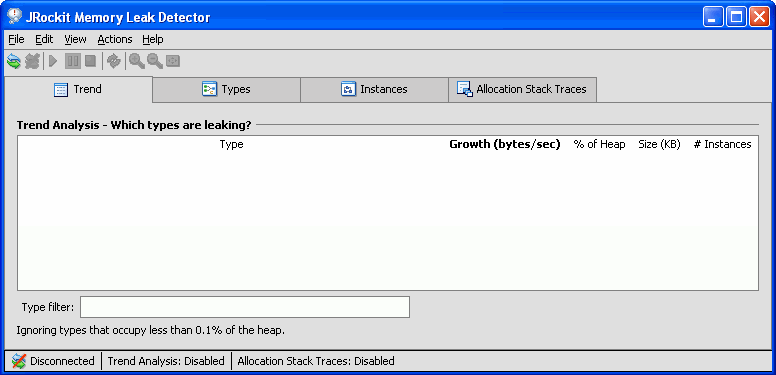
The Memory Leak Detector window opens (see Figure 2-1).
There are two system properties that can be set to enable authentication:
To enable the authentication, you need to set these properties when launching the Memory Leak Detector by typing, for example:
java -Dmemleak.jmx.username=<username> -Dmemleak.jmx.username=<password> -jar <path to MemoryLeakDetector.jar>
If you are using the memleak launcher in the \bin catalog, the command can, for example, look like this:
-J-Dmemleak.jmx.username=<password>
When it is not connected to any BEA JRockit JVM, the Memory Leak Detector window looks like Figure 2-1. The interface consists of four tabs, a tool bar, main menus, and a status bar.

The main window of the Memory Leak Detector contains four tabs as shown in Figure 2-2. Table 2-1 explains what you can do under the different tabs.

The Memory Leak Detector tool bar, see Figure 2-3, contains, for example, buttons to connect to the JRockit instance. See Table 2-2 for an explanation of the different tools in the tool bar.

The status bar (Figure 2-4) at the bottom of the window displays information regarding the current connection, whether the trend analysis is on or not, and whether the allocation stack trace is on or not.


|