


|
BEA AquaLogic Service Bus provides the capability to monitor and collect run-time information required for system operations. AquaLogic Service Bus aggregates run-time statistics, which you can view on a Dashboard. The dashboard allows you to monitor the health of the system and notifies you when alerts are generated in your services. With this information, you can quickly and easily isolate and diagnose problems as they occur.
This section includes the following topics:
This section contains information on the following topics:
Monitoring in AquaLogic Service Bus involves monitoring of the operational resources, server, and service level agreements. Figure 3-1 shows the architecture of AquaLogic Service Bus monitoring.
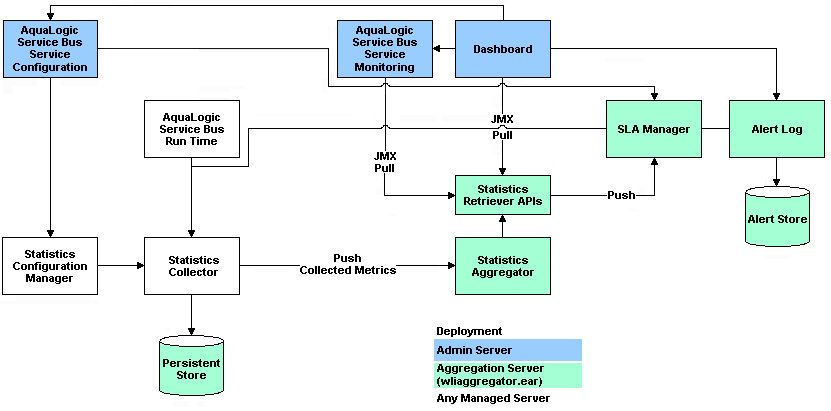
The Statistics Configuration Manager stores and manages the statistics configuration for each operational resource. An operational resource is defined as the unit for which statistical information can be collected by the monitoring subsystem. Operational resources include proxy services, business services, service level resources such as Web Services Definition Language (WSDL) Operations and flow components in a pipeline. The Statistics Configuration Manager is notified about changes in the service definition, such as adding, updating, or deleting a pipeline.
Each managed server in a cluster hosts a Statistics Collector. The Statistics Collector collects statistics on operational resources as directed by the Statistics Configuration Manager. The Statistics Collector also keeps samples history within the aggregation interval for the collected statistics. At every system-defined checkpoint interval, the Statistics Collector stores a snapshot of current statistics into a persistent store for recovery purposes and sends the information to the Statistics Aggregator.
One of the managed servers in a cluster, called the Aggregating Server or Aggregator, is designated as the aggregator for cluster-wide statistics. At system-defined checkpoint intervals, each managed server in the cluster sends a snapshot of its contributions to the Aggregator. The Aggregator then combines this information to offer cluster-wide statistics to its clients through Retriever APIs. The clients of Aggregator are the Dashboard, SLA Manager, and Service Monitoring modules.
To contribute a data point to the system, an operational resource in the system, such as a run-time proxy service pipeline, calls a method on the Statistics Collector, and identifies itself, the statistic, and the data point.
Alerts are raised in AquaLogic Service Bus to indicate potential violation of the service level agreements. You can use alerts for:
Alerts can also be raised in the message flow of the proxy service. You can use the alerts in a message flow for:
You can configure the severity of an alert in an alert rule for SLA alerts or in the Alert action of a message flow of a proxy service. You can configure alerts with one of the following levels of severity:
The alert destinations are notified when an alert is raised. If you do not configure any alert destination in an alert rule, the notifications are sent to AquaLogic Service Bus Console. For more information in alert destinations, see Understanding Alert Destination.
This section contains information on:
SLA alerts are automated responses to violations of Service Level Agreements (SLAs). These alerts are displayed on the AquaLogic Service Bus Dashboard. They are generated when the service violates the service level agreement or a predefined condition. To raise an SLA alert you have to raise an enable SLA Alerting both at the service level and at the global level. For more information on how to enable or disable monitoring for services, see Monitoring Services. The Alert History panel contains a customizable table displaying information about violations or occurrences of events in the system.
You must define alert rules to specify unacceptable service performance according to your business and performance requirements. Each alert rule allows you to specify the aggregation interval for that rule when configuring the alert rule. This aggregation interval is not affected by the aggregation interval set for the service. For more information on aggregation interval, see Aggregation Intervals. Alert rules also allow you to send notifications to the configured alert destinations. For information on defining alert rules, see Creating Alert Rules in the Using the AquaLogic Service Bus Console.
Consider the following use case to verify the service level agreements:
Assume that a particular proxy service is generating SLA alerts due to slow response time. To investigate this problem, you must log into the AquaLogic Service Bus Console and a review at the detailed statistics for the proxy service. At this level, you will be able to identify that, a third-party Web service invocation stage in the pipeline is taking a lot of time and is the actual bottleneck. You can use these alerts as the basis for negotiating Service Level Agreements. After successfully renegotiating service level agreements with the third-party Web service provider, you must configure alert metrics to track the Web service provider's compliance with the new agreement terms.
Pipeline alerts can be generated in a message flow whenever you define an Alert action available under the reporting category in the message flow.
You can also define conditions under which a pipeline alert is triggered using the conditional constructs available in the pipeline editor such as Xquery Editor or an if-then-else construct. You must configure the Alert Destination resource in an alert rule, to define the destination for the alert.
You will have complete control over the alert body including the pipeline, and context variables. Also you can extract the portions of the message. For more information on how to configure Alert actions in a stage, see
Alert— Proxy Service: Actions in Using the AquaLogic Service Bus Console. The alerts are notified to alert destinations.
You can obtain an integrated view of all the alerts generated by a service on the Dashboard page in AquaLogic Service Bus Console.
Alert destinations are resources to which alerts are dispatched.
AquaLogic Service Bus Console is the default alert destination for notification of any alert. The alerts are notified to the AquaLogic Service Bus console regardless of whether you configure an alert destination or not. It provides information about the alerts generated due to SLA violations or as a result of alert actions configured in the pipeline.The dashboard page displays the overall health of AquaLogic Service Bus. It provides an overview of the state of the system comprised of server, services, and alerts.
For more information on how to interpret the information on the dashboard, see The AquaLogic Service Bus Dashboard.
In AquaLogic Service Bus you can configure one or more of the following alert destinations:
This is one of the destinations for the alerts.To configure this alert destination you have to use the SMTP server global resource or a JavaMail session in the WebLogic server. For more information on SMTP Server resource, see Overview of SMTP Servers in Using the AquaLogic Service Bus Console. For more information on configuring JavaMail sessions, see Configure access to JavaMail in WebLogic Server Administration Console Online Help.
The SMTP server global resource captures the address of the SMTP server port number, and if required, the authentication credentials.The authentication credentials are stored inline and are not stored as a service account. The alert manager makes use of the e-mail alert destination to send the outbound e-mail messages when both pipeline alerts and SLA alerts are generated. When an alert is delivered an e-mail metadata consisting of the details about the alert is prefixed to the payload configured.
You can specify the e-mail id of the recipients in the Mail Recipients field. for more information on configuring an e-mail alert destination, see Adding an E-Mail Recipient: Alert Destinations in Using the AquaLogic Service Bus Console.
The Simple Network Management Protocol (SNMP) traps allow any third party software to interface monitoring Service Level Agreements (SLAs) within AquaLogic Service Bus. By enabling the notification of alerts using SNMP, Web Services Management (WSM) and the Enterprise Service Management (ESM) tools can monitor SLA violations and pipeline alerts by monitoring alert notifications.
Simple Network Management Protocol (SNMP) is an application-layer protocol which allows the exchange of information on the management of a resource across a network. It enables you to monitor a resource and if required, take some action based on the data obtained from the resource. Both the SNMP version 1 and SNMP version 2 are supported by AquaLogic Service Bus. SNMP is made up of the following components:
This is the resource that is being monitored. The resource and its attributes are added to the Management Information Base (MIB).
The Management Information Base (MIB) is a data structure that stores all the resources to be monitored in an hierarchical manner. It also stores the attributes of the resources. Each resource is given a unique identifier called the Object Identifier (OID).You can use the SNMP commands to retrieve the information on the management of a resource. The following section gives an illustration of the WebLogic Server MIB.
The Weblogic Server installer creates a copy of the MIB in the following location:
<BEA_HOME>/weblogic92/server/lib/BEA-WEBLOGIC-MIB.asn1
where <BEA_HOME> is the directory in which you installed the WebLogic Server. WebLogic Server exposes thousands of data points in its management system. To organize this data it provides a hierarchical data model that reflects the collection of services and resources that are available in a domain. Figure 3-2 illustrates the hierarchy of objects in the MIB.
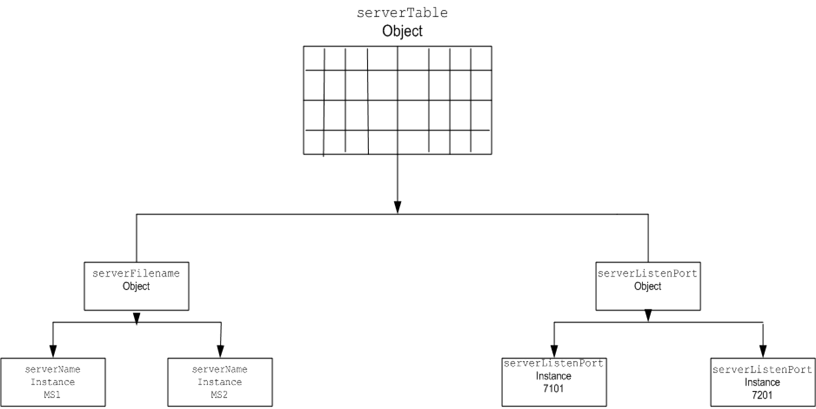
For example, if you created two managed servers, MS1 and MS2, in a domain, then MIB contains one object serverTable, which in turn contains one serverName object.The serverName object in turn contains two instances containing values MS1 and MS2. The MIB assigns a unique number called an object identifier (OID) to each managed object. Once assigned you cannot change the OID. Each OID consists of a sequence of integers. This sequence defines the location of the object in the MIB tree. Each node in the path has both a number and a name associated with it.
For more information on WebLogic Server MIBs see WebLogic Server documentation at WebLogic Server® 9.2 MIB Reference.
Each managed resource uses an SNMP agent to update the relevant information in the MIB. For this you should configure the SNMP agent to detect certain conditions within a managed resource and send trap notifications (reports) to the SNMP manager. You can configure the SNMP agent to generate traps in one of the following ways:
The SNMP manager manages the SNMP agents. SNMP is also it is the primary interface to the Network Management System.
The Network Management System forms the interface with the user. It gathers data using the SNMP manager and presents it to the user.
Java Messaging Service (JMS) is another destination for pipeline alerts and SLA alerts. You will have to configure a JNDI URL for the JMS destination for alerts. When you configure an alert rule to post a message to a JMS destination, you must create a JMS connection factory and a queue or topic, and target them to the appropriate JMS server in the WebLogic Server Administration Console. For information on how to do this, see “Configuring a JMS Connection Factory” and “JMS Resource Naming Rules for Domain Interoperability” in Configuring JMS System Resources in Configuring and Managing WebLogic JMS. When you define the JMS alert destination you can either use a destination queue or a destination topic. The message type can be bytes or text. For more information on how to configure JMS alert destination see Alert Destinations in Using the AquaLogic Service Bus Console.
The Reporting destination allows you to send notifications of pipeline alerts or SLA alerts to the default AquaLogic Service Bus JMS reporting provider or custom reporting provider that can be developed using the reporting APIs provided by AquaLogic Service Bus. This allows third parties to receive and process alerts in custom Java code.For more information on reporting, see Reporting.
In AquaLogic Service Bus you must define conditions based on which alerts are raised. The conditions are called the alert rule. The alert rule also configures the severity level and an alert destination for an alert.
This section provides information on the following topics:
Alerts are automated responses to SLAs violations, which are displayed on the Dashboard. You must define alert rules to specify unacceptable service performance according to your business and performance requirements. When you configure an alert rule, you can specify the aggregation interval. The alert aggregation interval is not affected by the aggregation interval set for the service. For more information on aggregation interval, see Aggregation Intervals.
Creating an alert rule involves the following steps:
| Note: | You can create alert rules even if you have not enabled for monitoring for a service. |
For more information about creating an alert rule is located in “Create an Alert Rule” in Monitoring in the Using the AquaLogic Service Bus Console.
On the Alert Rule page, if you set the Alert Frequency to Every Time, the notifications are issued to the dashboard every time the alert rule evaluates to True. If you set the Alert Frequency to Notify Once the notifications are issued the first time the rule evaluates to True, and no more notifications are generated until the condition resets itself and evaluates to True again.
In the case where the Alert Frequency is set to Every Time, the number of times an alert rule is fired depends on the aggregation interval associated with that rule. For example, if the aggregation interval is set to five minutes, the sample interval is one minute. Rules are evaluated each time five samples of data are available. Therefore, the rule is evaluated for the first time approximately five minutes after it is created and every minute thereafter.
In the case where the Alert Frequency is set to Notify Once, after an alert is fired the first time in an aggregation interval, it is not fired again in the same aggregation interval.
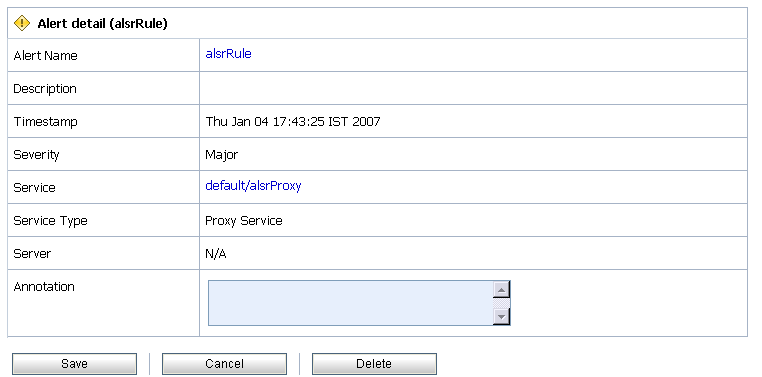
You can access this page when you click the name of the alert rule (or alert summary) in the Alert History table. The Alert Details page displays complete information about the alert and allows you to add an annotation to the alert, as shown in the Figure 3-3. Click on the name of the alert rule to go to the View Alert Rules Details Page. Click on the name of the service to go to the Service Monitoring Details page of the proxy service or the business service. Click on Delete to delete the alert rule. For more information on viewing alert details, Alert Details—Monitoring see in Using the AquaLogic Service Bus Console.
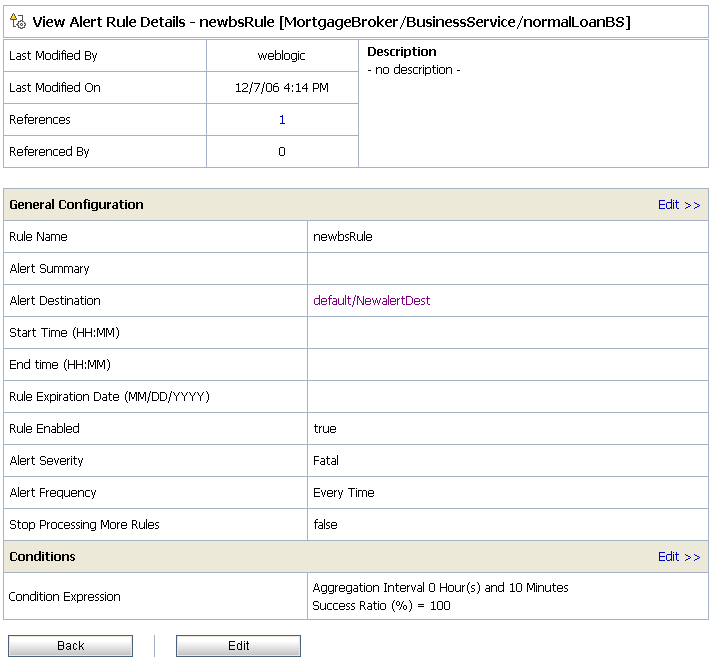
The View Alert Rule Details page displays complete information about a specific alert rule, as shown in Figure 3-4. You can view the details of the alert rule in this page. You can edit an alert rule configuration from this page. For more information on how to edit an alert rule, see To Review Configuration: Creating an Alert Rule—Monitoring in Using the AquaLogic Service Bus Console.
The information in this section is presented in question-answer format. The following are some of the most frequently asked questions:
I have restarted the server and none of my services have processed any requests. Why are alerts being generated?
Answer: Once the Monitoring subsystem has started collecting data for services, stopping and restarting a server does not abort the collection process. The data collected is persisted and statistic collection picks up from where it left off.
I have created an alert rule where I have defined the condition so as to raise an error if the success ratio drops below given percentage. But why are alerts raised even when the condition is not true?
Example: You have an alert rule with the following definition:
       Aggregation Interval:0 Hours(s) and 5 Minutes
       Success Rate < 80%
The Service Monitoring Summary page shows the following values:
Why are you being alerted in this case? Shouldn’t the success rate be 80% in this case?
Answer: No, the message count value displayed is the total of all messages processed by the service, including the ones that generated an error. Subsequently, in this case, the success rate is 75%.
I have created a service with an aggregation interval of ten minutes that sends a JMS message. I could see the message on the Service Monitoring Summary page, but some time later why does the message count for my service shows as zero?
Answer: The Service Monitoring Summary page displays dynamic statistics. In this case, it shows the message count in the last ten minutes. Because no messages were processed by the system in the last ten minutes, the message count is displayed as zero.
I changed the aggregation interval of a service. Why does the Service Monitoring Summary page for Current Aggregation Interval not display any statistics for this service?
Answer: Changing the aggregation interval for a service removes the statistical information for all the services and alerts associated with that service. The alert initializes again and triggers an alert at the end of aggregation interval expiry.
I have defined an alert rule for a business service with multiple endpoints. When one of the endpoints goes down, the alert is triggered. Why is an error is generated, when a service has only one endpoint?
Example: You have a business service with multiple endpoints with an alert rule defined as Failover-count > 0. When one of the endpoints goes down, the alert is triggered. However, when a service has only one endpoint, the Failover-count is not incremented for this service. Instead, why is an error is generated.
Answer: Set the Retry count to a number greater than zero. For information about setting the Retry count, see “Adding a Business Service” in Business Services in Using the AquaLogic Service Bus Console.
I see that an alert is generated on the Dashboard but why is this not being reflected on the Service Monitoring Details page for Current Aggregation Interval?
Answer: Alert rules are evaluated after the completion of the interval, which occurs after a checkpoint completion. If a rule evaluates to true, the rule’s actions are triggered, a log is generated, and the interval-count statistic attribute (Alerts for Current Aggregation Interval) is incremented. The updated value of this counter is processed in the next checkpoint, 60 seconds later. The Monitoring Details page displays the updated count approximately one minute after the alert is generated.
How does the active time for rules that span midnight work?
Answer: Consider the case where the active time for a rule is specified as 22:00 to 09:00.
On a given date, say June 7, the rule will be active and inactive as follows:
June 6, 10:00 P.M. to June 7, 9:00 A.M. – Active
June 7, 9:01 A.M. to June 7, 9:59 P.M. – Inactive
June 7, 10:00 P.M. to June 8, 9:00 A.M. – Active
The monitoring system aggregates the data received every minute makes it available for the retriever sub system. The aggregator thread is behind by twenty five seconds with respect to the Statistics Collector checkpoint thread.
If you disable monitoring for the domain, you disable the collection of statistics for that domain. The monitoring data is no longer collected from the next minute, which means there is no data returned if you attempt to retrieve it. The same applies when you enable monitoring for the domain. The system initially does not show any data. However, after a maximum of two minutes, the Service Summary page displays the results of monitoring.
In AquaLogic Service Bus, the monitoring subsystem collects statistical information, such as message count and statistics over an aggregation interval. The aggregation interval is the time period over which statistical data is collected and displayed in AquaLogic Service Bus Console. In an statistics are recomputed at regular intervals known as the sample interval. Thus aggregation interval is composed of many sample intervals. The duration of the sample interval depends on the aggregation interval.The following is an illustration of how the aggregation interval works:
Consider a proxy service you have configured for processing a purchase order, for which you have configured an aggregation interval of ten minutes. Until the first ten minutes elapse, the Service Summary page displays the partially computed data because the system has not yet collected a full ten minutes worth of data. After the first ten minutes of data aggregation, the system always displays the last ten minutes of data. For example, at the fourteenth minute, the Dashboard displays minutes four through fourteen. If no messages are processed after the fifteenth minute, on the twenty fifth minute, no data is displayed for the service.
Under certain conditions an alert rule may fire if the expiration of a sample interval completes an aggregation interval. If you update an alert rule aggregation interval or create an alert rule with new aggregation interval, then the new aggregation interval is set for the service and the conditions specified in the alert rule that has statistical metrics associated with the service. Also if the statistics from the aggregation interval associated with the previous alert rule is a part of the new or the updated alert rule, then the new alert rule will inherit the statistics and the alert rule is fired when the sample interval of the aggregation interval expires.
For example you have a service s1 for which you have defined an alert rule a1 with aggregation interval equal to ten minutes and condition message count>10. The sample interval for this aggregation interval would be five minutes. Statistics for the service will be collected during each sample interval and aggregated over the aggregation interval. Now when you create a new alert rule a2 with an aggregation interval of fifteen minutes and the condition being the same. that is an alert should be raised when the message count >10. The alert for the new aggregation interval should fire after time interval of t+15 minutes, where t is the time when the new aggregation interval was set. However, as the statistics for alert rule a1 are already being collected the alert rule may fire when a sample interval for the alert rule a2 completes.
For more information about how aggregation interval affects the display of monitored information, see Statistics Associated With Different Resources.
You must explicitly enable monitoring for any business or proxy service that you create; monitoring is disabled by default. After you have enabled monitoring and set the aggregation interval for your individual services, you can enable or disable monitoring for all those services from the Global Settings page in the System Administration module. For more information, see Configuring Operational Settings at a Global Level.
At run time, the default refresh rate for the Dashboard page is one minute. However, it may take up to three minutes for the information to be displayed on the Dashboard. This delay occurs because of the time gaps between when the messages are processed by the proxy service, when the metrics are collected, and the refresh rate of the Dashboard. The system works as follows:
For example, a proxy service starts sending data in T1, as shown in Figure 3-5. At T2—that is, the second minute—the Statistics Collector sends the data to the aggregator. However, if an aggregation cycle has just occurred, the aggregator does not merge this data until the next aggregation cycle, which occurs after one minute, or a maximum of two minutes from the previous aggregation cycle. When the data is merged, it is now available for AquaLogic Service Bus Console. Since the console refreshes every minute, if the refresh cycle has just passed, but the console displays the alerts after a maximum time of three minutes.
By default refresh rate of the dashboard is set to 1 minute. But you can set it to 2,3,4,5,10,20, or 30 minutes. You can view the alert history data by default for 30 minutes. But you can also view this data for 1, 2, 3, or 6 hours.
You can change the Dashboard polling interval in the Global Settings in Operations module in the AquaLogic Service Bus Console. For information on how to do this, see Changing the Dashboard Settings: Monitoring in Using the AquaLogic Service Bus Console.
The dashboard displays all the alerts that have been fired. This display is dynamically refreshed. These alerts could be the result of SLA violations or pipeline alerts.Service Level Agreements(SLAs) are agreements that define the precise level of service expected from the AquaLogic Service Bus business and proxy services, while pipeline alerts are defined in the message flow for business purposes such as record the number of message that flow through the message pipeline, or to report errors but not for the health of the system. Each row of the table displays the information that you have configured, such as the severity, timestamp, and associated service. Clicking the severity link will display more details about the alert to help analyze the cause of the alert.
This section helps you to understand the information displayed on AquaLogic Service Bus dashboard. The dashboard displays separate views for SLA alerts and pipeline alerts.
The following sections contain information for:
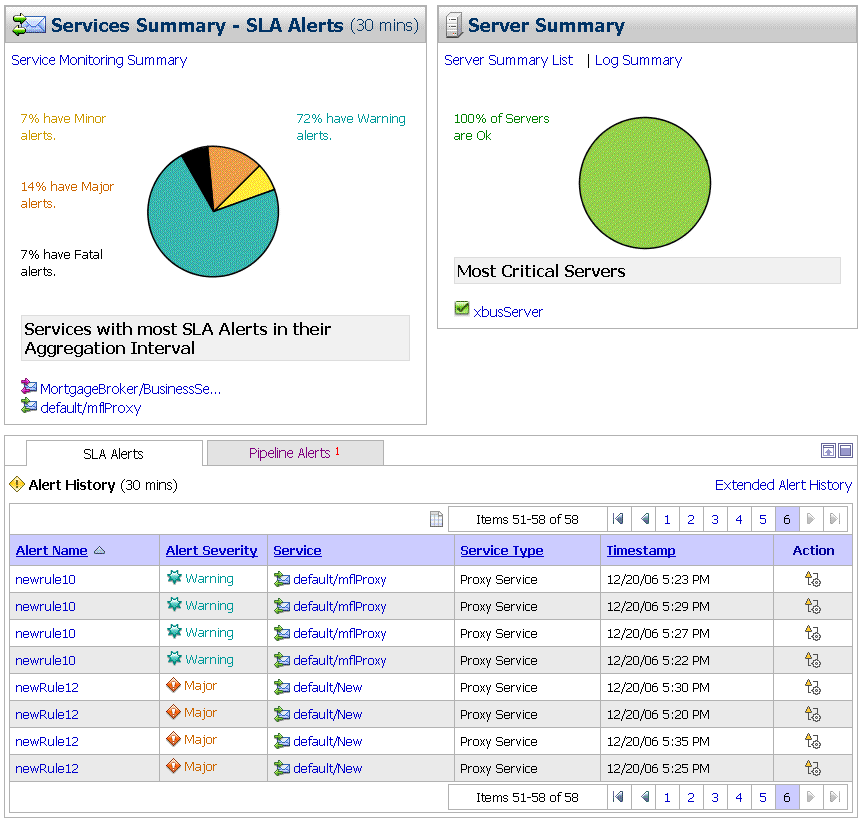
When you log onto the AquaLogic Service Bus Console, by default the dashboard for SLA alerts Figure 3-6 is displayed. The dashboard shows the monitoring information for the alert history duration set in the dashboard settings page. It provides an overview of the state of the system—comprised of services, server, and alerts.
The following sections provide information for:
The Service Summary panel provides an overview of the state of the services. The Service Summary pie chart shows the distribution of SLA alerts based on their severity for the duration set for alert history in the dashboard settings page. The severity level of alerts is user configurable and has no absolute meaning. Severity types include
The services having the most number of alerts are listed beneath the pie chart, as shown in Figure 3-7. Up to ten services are listed in descending order of services with the most alerts in their respective current aggregation interval.
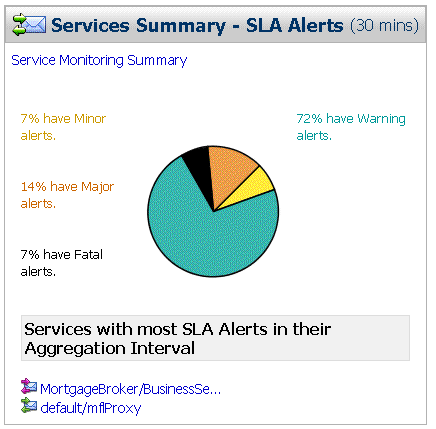
From the Service Summary panel, you can access more information about alerts by clicking the following:
| WARNING: | When a service (or its component; for example, a pipeline node) is renamed or relocated, its statistical data is lost. |
For information on how to access detailed alert information, see “Viewing the Dashboard Statistics” in Monitoring in the Using the AquaLogic Service Bus Console.
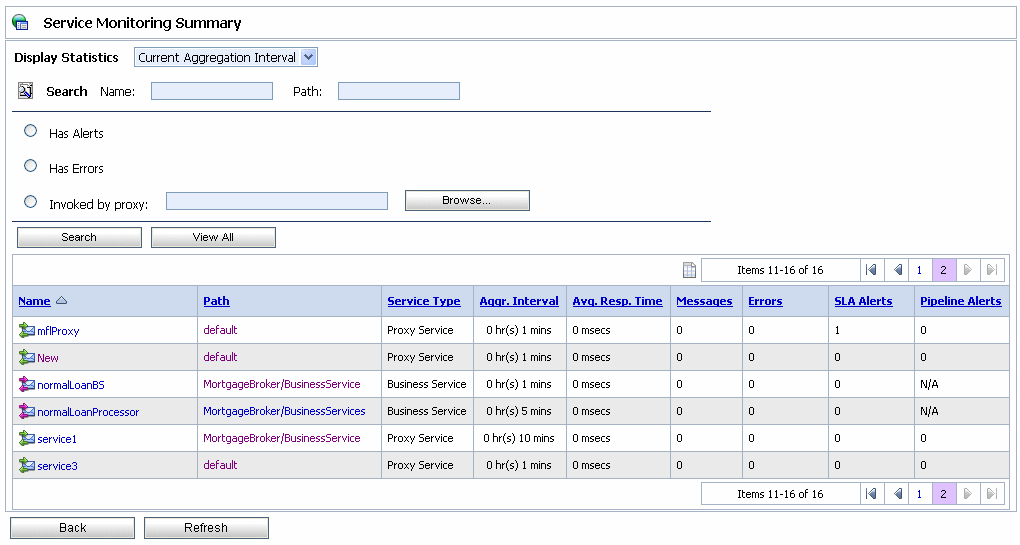
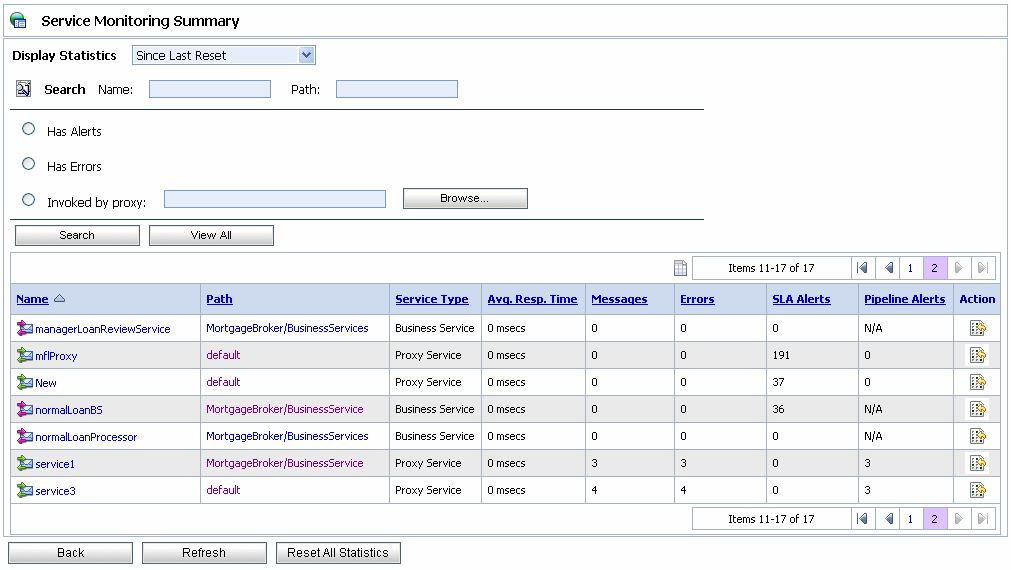
The Service Monitoring Summary page provides two views of service monitoring statistics, as shown in Figure 3-8 and Figure 3-9.
The first is a dynamic view of statistical data collected by each service. This view is available when you select Current Aggregation Interval in the Display Statistics field. The aggregation interval displayed in this view determines the statistics that are displayed. For example, if the aggregation interval of a particular service is twenty minutes, that service’s row displays the data collected in the last twenty minutes. From this page you can view all services or search for services based on the given criteria. For more information on the statistics displayed in this page, in the Current Aggregation Interval view, see Listing and Locating Service Metrics—Monitoring in Using the AquaLogic Service Bus Console.
The second view is a running count of the metrics. This view is available when you select Since Last Reset in the Display Statistics field. The statistics displayed in each row are for the period since you last reset the statistics for an individual service or since you last reset the statistics for all services. From this page you can view all services or search for services based on the given criteria. You can also reset statistics for selected services or for all services. For more information on the statistics displayed in this page, in the Since Last Reset view, see Listing and Locating Service Metrics—Monitoring in Using the AquaLogic Service Bus Console.
The Service Monitoring Details page provides you with two views of detailed information about a specific service, as shown in Figure 3-10 and Figure 3-11.
The first is a dynamic view of statistical data collected by each service. This view is available when you select Current Aggregation Interval in the Display Statistics field. The aggregation interval displayed in this view determines the statistics that are displayed. For example, if the aggregation interval of a particular service is twenty minutes, that service’s row displays the data collected in the last twenty minutes. From this page you can view all services or search for services based on the given criteria. For more information on the statistics displayed in this page, in the Current Aggregation Interval view, see Listing and Locating Service Metrics—Monitoring in Using the AquaLogic Service Bus Console.
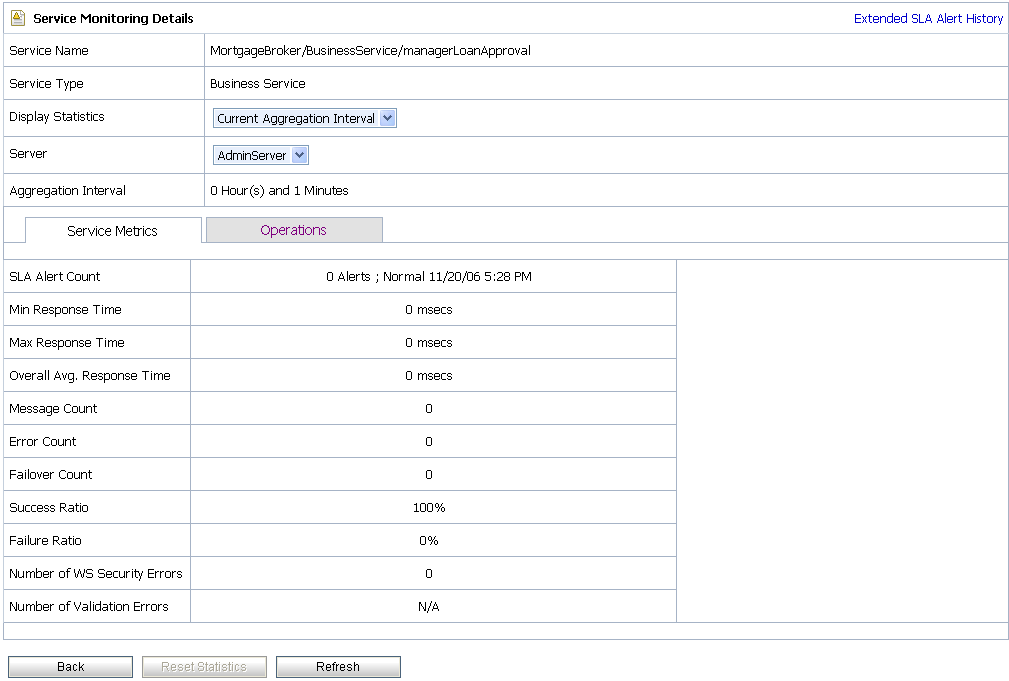
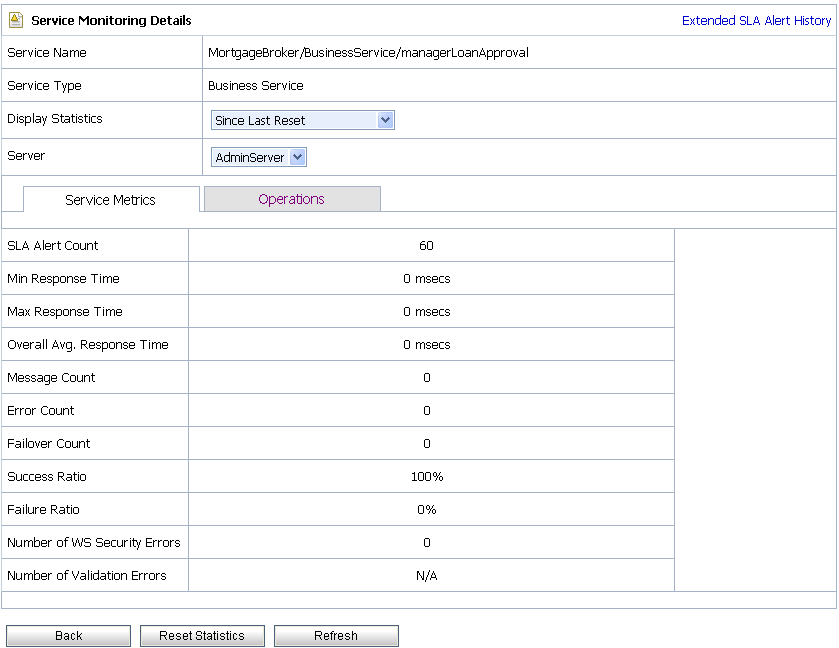
The second view is a running count of the metrics. This view is available when you select Since Last Reset in the Display Statistics field. The statistics displayed in each row are for the period since you last reset the statistics for an individual service or since you last reset the statistics for all services. From this page you can view all services or search for services based on the given criteria. You can also reset statistics for this service. For more information on the statistics displayed in this page, in the Since Last Reset view, see Listing and Locating Service Metrics—Monitoring in Using the AquaLogic Service Bus Console.
You have the following tabs in the Service Monitoring Details page for each of the above views:
This panel enables you to quickly view the status of the alerts and service level statistics for the service in the current aggregation interval. When you view the service level statistics for the time interval since the last reset, this displays the total number of alerts since last reset. For more information on the metrics displayed in this view, see Viewing Service Monitoring Details—Monitoring in Using the AquaLogic Service Bus Console
The Alert History (Figure 3-15) for SLA alerts table shows all the SLA alerts, which have occurred in the alert history duration you have set in the dashboard settings page. It contains the following details:

AM/PM. icon to go to the View Alert Rules Details page. For more information on View Alert Rules Details page, see Viewing Alert Details.
To customize the information displayed in the Alert History table, click customize table  icon above the table. The available filtering is shown in the Figure 3-21. For more information on customizing the alert history table, see
Customizing Table Views—Monitoring in Using the AquaLogic Service Bus Console
To view a complete list of alerts, click Extended Alert History. For more information on Extended Alert History, see Viewing the Extended Alert History for SLA Alerts.
The extended alert history page for the SLA alerts contains information about all the SLA alerts that have been generated in the domain. You can view all the alerts that were triggered or search for specific alerts from the table. For more information on data displayed in the extended SLA alert history page, see Listing and Locating Alerts—Monitoring in Using the AquaLogic Service Bus Console.
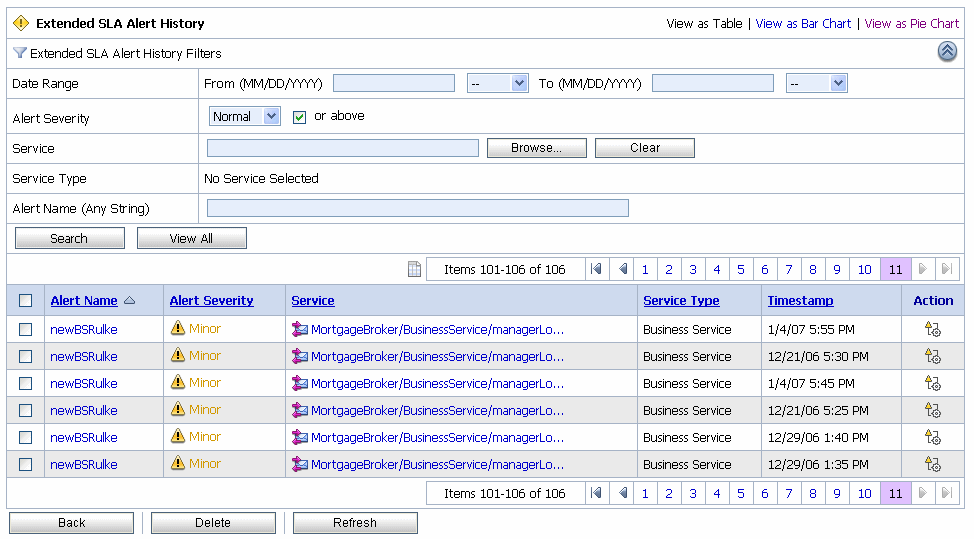
You can delete the alerts from this page or go to the View Alert Rules Page. You can filter your search using the Extended Alert History Filters pane. You can filter using the following criteria:
To view a pie or bar chart of the alerts, click View Bar Chart or View Pie Chart in the page.
You can also customize the table depending on information you require. To customize the information displayed in the table click on the  table customizer icon. You must use the Table Customizer (see Figure 3-17) to customize the information displayed in the Extended SLA Alert History table.
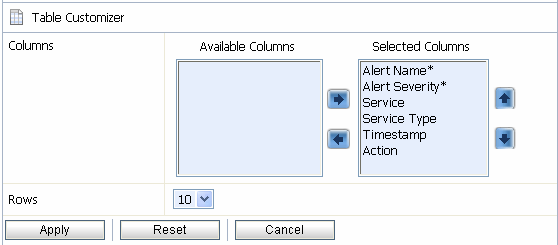
For information about how to use the customizing your search, see “Customizing Your View of Alerts” in Monitoring in the Using the AquaLogic Service Bus Console.
When you log onto AquaLogic Service Bus Console, by default the dashboard for SLA alerts is displayed. Click on Pipeline Alerts to view the dashboard for the pipeline alerts.The dashboard shows the monitoring information for the last thirty minutes. It provides an overview of the state of the system—organized by server, services, and pipeline alerts, as shown in Figure 3-18.
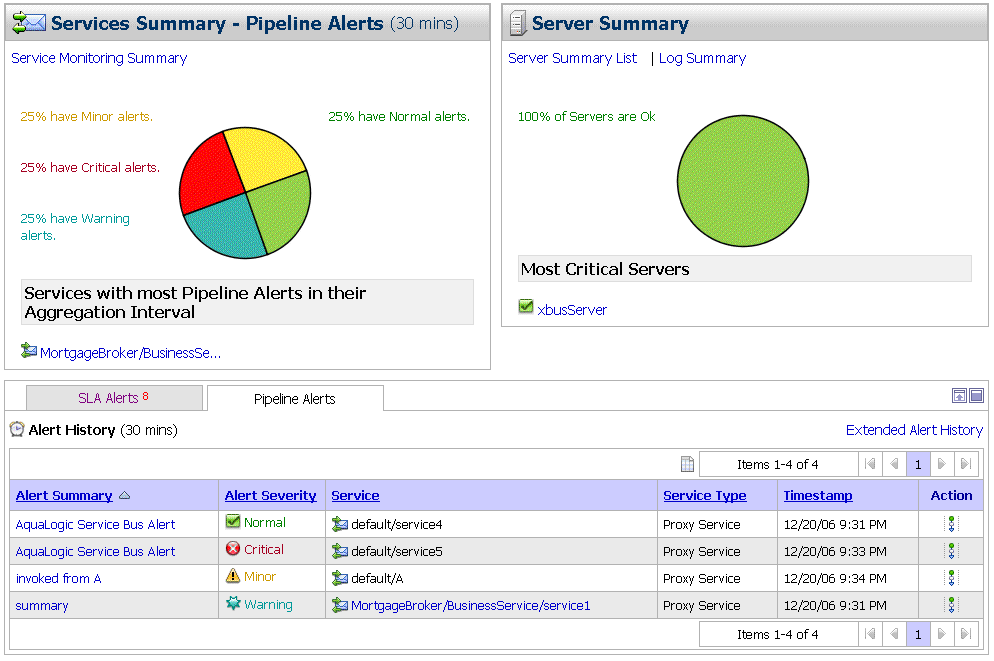
This section contains information for:
The services summary panel (see Figure 3-19) shows the distribution of alerts based on their severity.
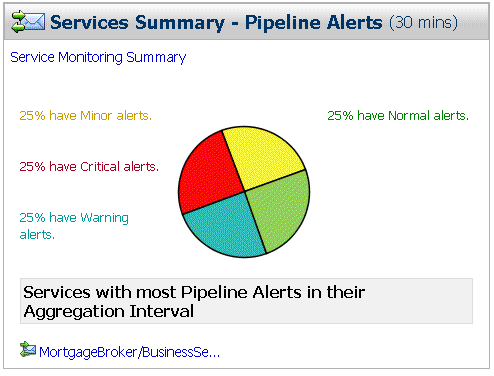
It provides an overview of the state of the services. The Service Summary pie chart shows the percentage of pipeline alerts according to their severity for all services for the alert history duration set in the dashboard settings page. The severity level of alerts is user configurable and has no absolute meaning. Severity types include
The services having the most number of alerts are listed beneath the pie chart, as shown in Figure 3-19. Up to ten services are listed in descending order of services with the most alerts.
From the Service Summary panel, you can access more information about alerts by clicking the following:
| WARNING: | When a service (or its component; for example, a pipeline node) is renamed or relocated, its statistical data is lost. |
For information on how to access detailed alert information, see “Viewing the Dashboard Statistics” in Monitoring in the Using the AquaLogic Service Bus Console.
The Alert History (see Figure 3-20) for pipeline alerts displays the details of all the pipeline alerts that have been triggered in the last alert history duration set in the dashboard settings page. It contains the following details:
AM/PM.To view a complete list of alerts, click Extended Alert History. For more information on Extended Alert History, see Extended the Alert History for Pipeline Alerts.
To customize the information displayed in the Alert History table, click customize table  icon above the table. The available filtering is shown in the Figure 3-21.
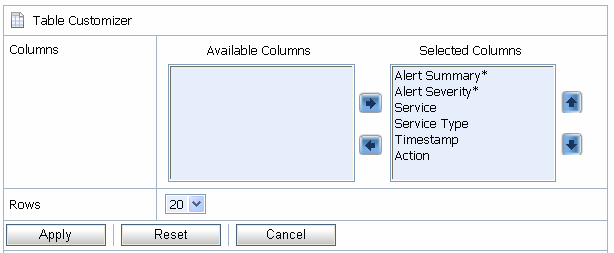
To customize the sort order of the displayed alerts, click the sort icons beside the column headers.
The extended alert history page for the pipeline alerts contains information about all the pipeline alerts that have been generated in the domain. You can view all the alerts that were triggered or search for specific alerts from the table. For more information, see Listing and Locating Alerts—Monitoring in Using the AquaLogic Service Bus Console.
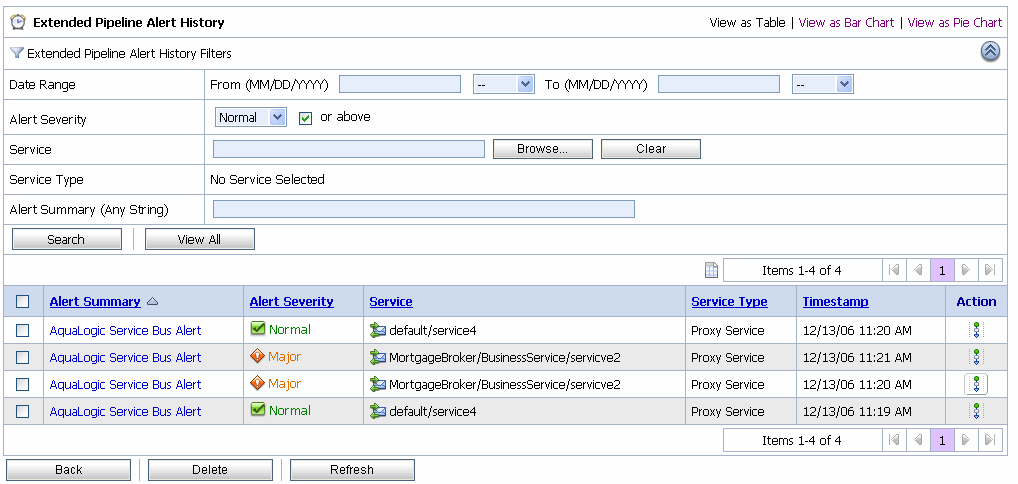
You can filter your search using the Extended Alert History Filters pane. You can filter using the following criteria:
To view a pie or bar chart of the alerts, click View Bar Chart or View Pie Chart in the page.
You can also customize the table depending on information you require. To customize the information displayed in the table click on the  table customizer icon. You must use the Table Customizer (see Figure 3-17) to customize the information displayed in the Extended Pipeline Alert History table. For more information, see
The Server Summary panel displays the status of all the servers associated with the domain. It provides an overview of the state of the servers. The pie chart shows the status of each server in the domain. The status for each server is derived from the WebLogic Diagnostic Service. The five most critical servers are displayed, as shown in Figure 3-23.
| Note: | The Server Summary panel is common for both SLA alert view and pipeline alert view of the dashboard. |
For more information about the WebLogic Diagnostic Service, see Configuring and Using the WebLogic Diagnostics Framework.
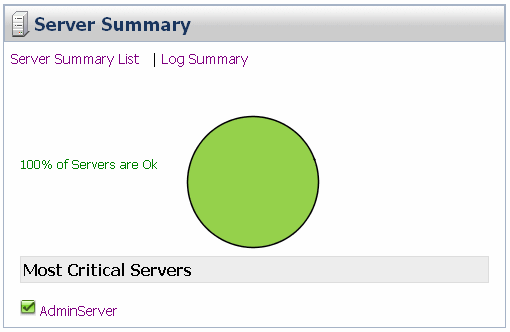
The displayed status has the following meanings:
Fatal—the server has failed and must be restarted.Critical—server failure likely; something must be done immediately to prevent failure. For more details, check the server logs and the corresponding RuntimeMBean.Warning—the server could have problems in the future. For more details, check the server logs and the corresponding RuntimeMBean.OK—the server is functioning without any problems.Overloaded—the server has more work assigned to it than the configured threshold; it might refuse more load.This section contains the following information for:
The Log Summary page displays the summary log for the servers associated with the domain. The domain log file provides a central location from which to view the overall status of the domain. Each server instance forwards a subset of its messages to a domain-wide log file. By default, servers forward only messages of severity level Notice or higher. You can modify the set of messages that are forwarded. For more information, see
Understanding WebLogic Logging Services in Configuring Log Files and Filtering Log Messages.
If you configure the logging action in a pipeline, the log is forwarded to the server log. Unless you configure WebLogic Server to forward these messages to the domain log, you cannot view this log from AquaLogic Service Bus Console. For information in how to do this, see Create Log Filters in the WebLogic Server Administration Console Online Help.
To see the number of messages currently raised by the system, click the View Log Summary link in the Server Summary panel. A table is displayed that contains the number of messages grouped by severity, as shown in Figure 3-24.
| Note: | You can view the log summary only if you posses administrator privileges in the WebLogic Server Console. |
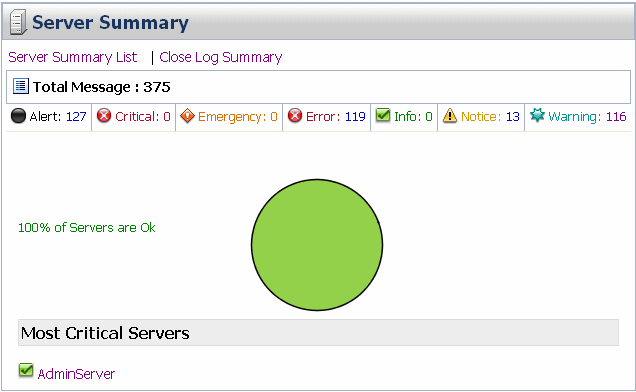
The displayed message statuses have the following meanings:
This display is based on the health state of the running servers, as defined by the WebLogic Diagnostic Service. For more information about the WebLogic Diagnostic Service, see Configuring and Using the WebLogic Diagnostics Framework.
To view the domain log for a particular type of message, click the number corresponding with the type of message. Figure 3-25 shows an example of a domain log file displayed in the AquaLogic Service Bus Console.
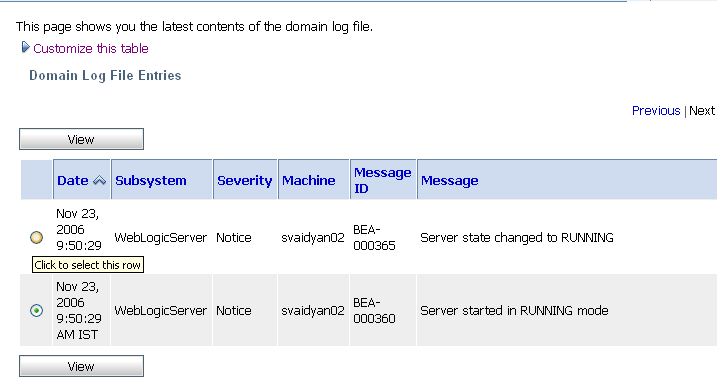
The following information is displayed:
For more information, see “Message Attributes” in Understanding WebLogic Logging Services in Configuring Log Files and Filtering Log Messages.
To display details of a single log file on the page, select the appropriate log, then click the View. You can also customize the Domain Log File Entries table to view the following additional information:
For additional description of these information, see Viewing Details of Server Log Files— Monitoring in Using the AquaLogic Service Bus Console. For more information on how to customize the Domain Log File Entries table, see Customizing Your View of Domain Log File Entries—Monitoring in Using the AquaLogic Service Bus Console.
The Server Summary page provides a customizable table of servers, as shown in Figure 3-26.

As shown in the upper section of the Figure 3-26, the Server Summary Page displays the number of messages currently raised by the system. For information about the meaning of each type of status message, see Understanding the Log Summary.
The server table displays the following information:
Health—the health of the server: Fatal—the server has failed and must be restarted.Critical—server failure likely; something must be done immediately to prevent failure. For more details, check the server logs and the corresponding RuntimeMBean.Warning—the server could have problems in the future. For more details, check the server logs and the corresponding RuntimeMBean.OK—the server is functioning without any problems.Overloaded—the server has more work assigned to it than its configured threshold; it cannot take on more load.| Note: | Click the check box associated with the status to filter the results based on more than one status value. |
To view this information in the table as a pie or bar chart, click View as a Bar Chart or View as a Pie Chart.
To filter the display of servers, click Customize Table above the server table. The available filtering is shown in Figure 3-27.
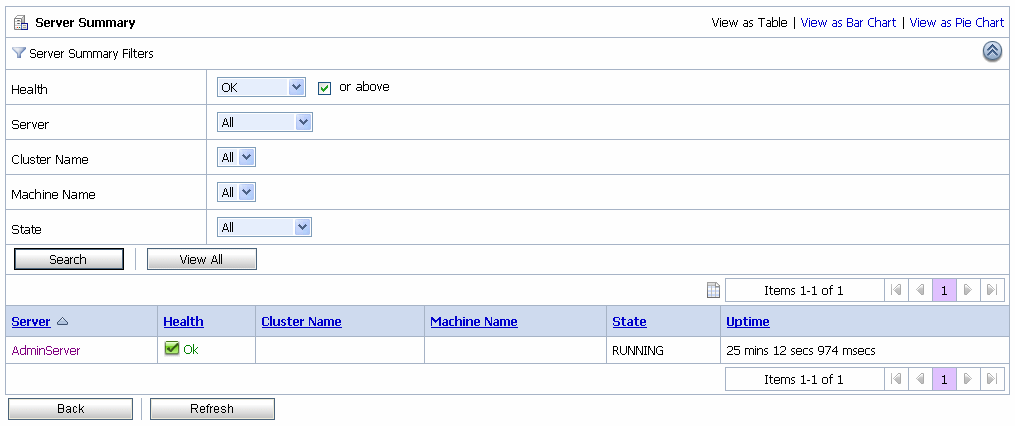
For information about how to use the Server Summary Table Filter, see “Customize Your View of the Server Summary” in Monitoring in the Using the AquaLogic Service Bus Console.
You can access the View Server Details page by clicking the name of a server under Most Critical Servers or by clicking the name of a server in the Servers Summary page.
The View Server Details page enables you to view more server monitoring details, as shown in Figure 3-28.
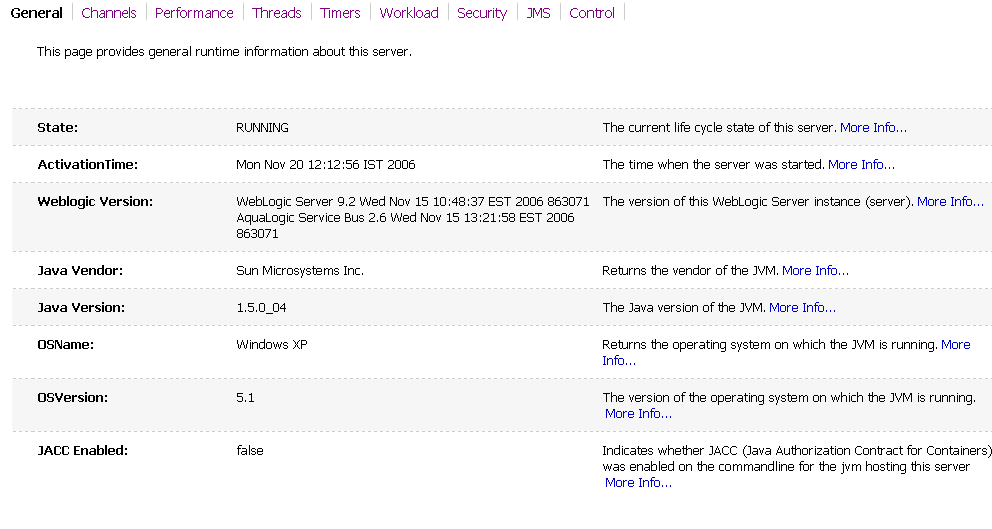
The information displayed on this page is a subset of the Monitoring tab in the AquaLogic Service Bus Console Server Settings page. The details available are:
For more information, see WebLogic Server Administration Console Online Help.
From the dashboard, you can drill-down into the system and easily find specific information, such as the average execution time of a service, the date and time an alert occurred, or the duration for which server has been running.
You configure the dashboard and monitoring in the AquaLogic Service Bus Console, which is described in the Monitoring section of Using the AquaLogic Service Bus Console.
The following sections describe some of the tools and functionality available in the AquaLogic Service Bus Console to monitor messages and system operations. It includes:
When you create a business service or a proxy service, monitoring is disabled by default for that service. This section describes:
You can enable or disable the operational settings for an individual service from the Operation Settings view of the View a Proxy Service (see Figure 3-29) or View a Business Service page (see Figure 3-30).
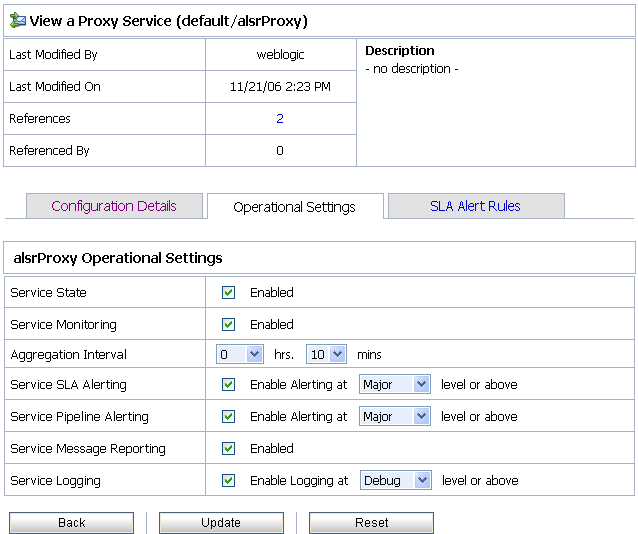
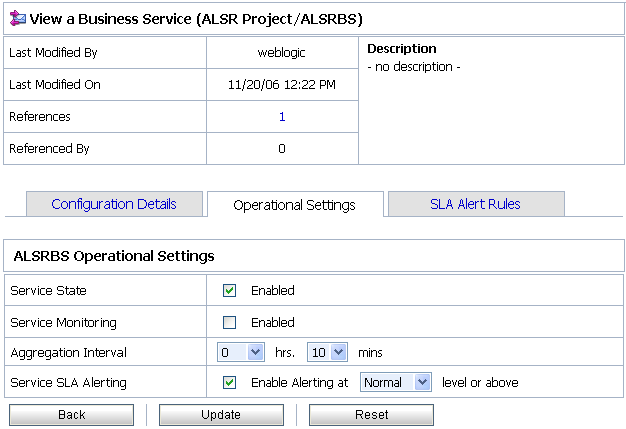
The View a Proxy Service or View a Business Service pages contain the following information about a proxy service or a business service:
All alerts that are of same or higher severity will then be raised whenever the rule condition is met.
You can enable or disable the following settings for proxy services only.
You can access the Global Settings page from the operations module. You can use the Global Settings page (see Figure 3-31) to configure the following operational settings for services:
| Notes: |
Monitoring Statistics helps you know how many messages in a particular service have processed successfully and how many have failed. To access this information, from the Dashboard, you access the Service Monitoring Summary page and filter the display for the relevant service. Besides displaying the number of messages that have been processed successfully or failed, you can also see which project the service belongs to, the average execution time of message processing, and the number of alerts associated with the service. You can view monitoring statistics for the period of the current aggregation interval or for the period since you last reset statistics for this service or since you last reset statistics for all services.
You use the Service Monitoring Summary page or the Service Monitoring Details page with Display Statistics set to Since Last Reset to reset statistics.
| Caution: | When you reset the statistics, make sure you are not in a WebLogic session on the WebLogic Server Administration Console. |
Clicking the name of the service brings you to that service’s Service Monitoring Details page. This page provides additional information such as the minimum and maximum response times and the overall average time it takes for the service to execute a message, the success-failure ratio, the number of messages that have failed because of security or validation errors, and the number of messages associated with proxy service components (pipelines and route nodes). You can view this information for specific operations associated with the service. Again, you can view these statistics for the period of the current aggregation interval or you can display the statistics for the period since you last reset statistics for this service or since you last reset statistics for all services.
To view the statistical information for business service operations in the Service Monitoring Details page, you must mention the name of the operation that is being invoked in the route node of the proxy service that routes messages to the business service. For example, say proxy service A routes messages to business service B, for operation C. The Service Monitoring Details page for the business service B increments the message count for operation C in conjunction with the Service Monitoring Summary page only if the binding and the transport layers of the AquaLogic Service Bus recognize the operation that is invoked. You can achieve this in one of the following ways:
$outbound, for example insert "<ctx:operation>foo</ctx:operation>"
as last child element in "./ctx:service", where foo is the name of the operation that is invoked.
If you do not mention name of the operation in the route node of the proxy service, the binding and transport layers of the AquaLogic Service Bus fail to recognize the operation that is invoked. Hence the metrics for operation C will not be incremented in the Service Monitoring Details page (for business service B) in conjunction with the Service Monitoring Summary page, which will be incremented to reflect the number of messages sent to the business service B.
The following section provides more information on different statistics associated with:
A service has an inbound endpoint or an outbound endpoint that is registered with the Service Directory of AquaLogic Service Bus. Such services are associated with other resources such as WSDLs, and security settings. The statistics reported for this resource type is listed in Table 3-1. It also give you the type of the statistics.
Statistics are collected for two FLOW_COMPONENT types, namely, Pipeline-pair nodes and Route notes. For more information on Pipeline-pair node and route node, see Building Message Flow —Modeling Message Flow in AquaLogic Service Bus User Guide. The statistics reported for FLOW_COMPONENT are listed in Table 3-2.
The statistics pertaining to the WEBSERVICE_OPERATION resources such as WSDLs, are collected and stored in a runtime XML file. The statistics reported for this type of resource are listed in Table 3-3.
Auditing helps you to keep track of changes in the configuration of the AquaLogic Service Bus. The three types of auditing you can perform are briefly described in:
When you perform configurational changes in AquaLogic Service Bus console a track record of the changes is generated and history of all the configurational changes is maintained. Only the previous image of the object is maintained. You can view or access the history of configurational changes and the list of resources that have been changed during the session only through the console. However, in order to access all the information on configuration you have to activate the session.
Auditing the entire message flow pipeline during is time consuming. However, you can use the reporting action to perform selective auditing of the message flow pipeline during run time. You insert the reporting action at required points in the message flow pipeline and extract the required information. The extracted information may be then stored in a database or sent to the reporting stream in order to write the auditing report.
When a message is sent to the proxy service and there is a breach in the transport level authentication or the security of the Web Services, WebLogic server generates an audit trail. You must configure the WebLogic server to generate this audit trail. Using this you can audit all security violations that occur in the message flow pipeline. It also generates an audit trail whenever it authenticates a user. For more information on security auditing, see Configuring the WebLogic Security Framework: Main Steps in AquaLogic Service Bus Security Guide.


|