Configuring and Using the WebLogic Diagnostics Framework
|
|
Configuring and Capturing Diagnostic Images
You use the Diagnostic Image Capture component of the WebLogic Diagnostic Framework (WLDF) to create a diagnostic snapshot, or dump, of a server's internal runtime state at the time of the capture. This information help support personnel analyze what might have contributed to a server failure.
The following topics describe the Diagnostic Image Capture component:
- How to Initiate Image Captures
- First Failure Detection and Notification
- Configuring Diagnostic Image Captures
- It is recommended that you do not edit the config.xml file directly.
How to Initiate Image Captures
A diagnostic image capture can be initiated by:
- A "first failure" detection. See First Failure Detection and Notification.
- A configured watch notification. See Configuring Notifications.
- A request initiated by a user in the Administration Console (and requests initiated from third-party diagnostic tools). See Configure and capture diagnostic images in the Administration Console Online Help.
- A direct API call, using JMX. See Listing 4-1
- WLST command
First Failure Detection and Notification
The Diagnostic Image Capture component includes a first failure notification feature. When a server makes the transition into a failed state, this feature automatically triggers an image creation notification. That notification triggers the creation and capture of a diagnostic image. The first-failure notification feature ensures that the state of a server when it failed is preserved.
Note: The first failure notification feature is not the same as a notification from the WLDF Watch and Notification component. For information about watches and notification, see Configuring Watches and Notifications.
You can configure an image lockout period for first failure notifications, as described in Configuring Diagnostic Image Captures. The image lockout time limits the number of diagnostic images that are captured in a specified time period. When a server fails and recovers multiple times in a short period of time—such as may happen due to storm-related power failures—the image-lockout period prevents the server from repeatedly capturing and persisting diagnostic images that are very similar in content and that unnecessarily use up system resources, such as disk space.
Configuring Diagnostic Image Captures
Because the diagnostic image capture is meant primarily as a post-failure analysis tool, there is little control over what information is captured. Available configuration options are:
- The destination for the image
- For a specific capture, a destination that is different from the default destination
- A lockout, or timeout, period, to control how often an image is taken during a sequence of server failures and recoveries
As with other WLDF components, you can configure Diagnostic Image Capture using the Administration Console (see Configure and capture diagnostic images in the Administration Console Online Help), the WebLogic Scripting Tool (WLST), or programmatically.
Listing 4-1 shows an example of WLST commands for generating an image capture.
Listing 4-1 Sample WLST Commands for Generating a Diagnostic Image
url='t3://localhost:7001'
username='system'
password='gumby1234'
server='myserver'
timeout=120
connect(username, password, url)
serverRuntime()
cd('WLDFRuntime/WLDFRuntime/WLDFImageRuntime/Image')
argTypes = jarray.array(['java.lang.Integer'],java.lang.String)
argValues = jarray.array([timeout],java.lang.Object)
invoke('captureImage', argValues, argTypes)
How Diagnostic Image Capture Is Persisted in the Server's Configuration
The configuration for Diagnostic Image Capture is persisted in the config.xml file for a domain, under the <server-diagnostic-config> subelement of the <server> element for the server, as shown in Listing 4-2:
Listing 4-2 Sample Diagnostic Image Capture Configuration
<domain>
  <!-- Other domain configuration elements -->
  <server>
    <name>myserver</name>
    <server-diagnostic-config>
      <image-dir>logs\diagnostic_images</image-dir>
      <image-timeout>2</image-timeout>
    </server-diagnostic-config>
    <!-- Other configuration details for this server -->
  </server>
  <!-- Other server configurations in this domain-->
</domain>
Note: It is recommended that you do not edit the config.xml file directly.
Contents of the Captured Image File
The most common sources of a server state are captured in a diagnostic image capture, including:
- Configuration
- Log cache state
- Java Virtual Machine (JVM)
- Work Manager state
- JNDI state
- Most recent harvested data
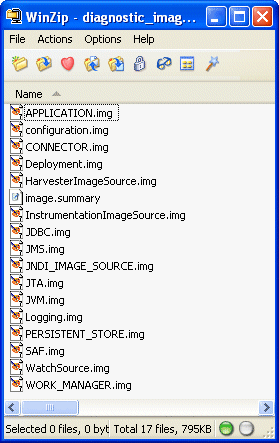
The Diagnostic Image Capture component captures and combines the images produced by the different server subsystems into a single ZIP file. In addition to capturing the most common sources of server state, this component captures images from all the server subsystems including, for example, images produced by the JMS, JDBC, EJB, and JNDI subsystems.
Note: A diagnostic image is a heavyweight artifact meant to serve as a server-level state dump for the purpose of diagnosing significant failures. It enables you to capture a significant amount of important data in a structured format and then to provide that data to support personnel for analysis.
Each image is captured as a single file for the entire server. The default location is SERVER\logs\diagnostic_images. Each image instance has a unique name, as follows:
diagnostic_image_DOMAIN_SERVER_YYYY_MM_DD_HH_MM_SS.zip
The contents of the file include at least the following information:
- Creation date and time of the image
- Source of the capture request
- Name of each image source included in the image and the time spent processing each of those image sources
- JVM and OS information, if available
- Command line arguments, if available
- WLS version including patch and build number information
Figure 4-1 shows the contents of an image file. You can open most of the files in this ZIP file with a text editor to examine the contents.
