10 One View Reporting for Outbound Inventory Management (Release 9.1 Update)
This chapter provides overview information, processing options, and reports for the following applications:
-
Section 10.1, "One View Outbound Agreement Inquiry (P42I270)"
-
Section 10.2, "One View Outbound Inventory Valuation Inquiry (P42I271)"
-
Section 10.3, "One View Outbound Inventory Consumption Inquiry (P42I272)"
10.1 One View Outbound Agreement Inquiry (P42I270)
Access the One View Outbound Agreement Inquiry application (P42I270) on the Outbound Inventory Inquiries (G42I20) menu. Use One View Outbound Agreement Inquiry to query outbound inventory agreements and create outbound inventory agreement inquiry reports. One View Outbound Agreement Inquiry uses the One View Outbound Agreement Inquiry business view (V42I270), which include columns from the Address Book Master table (F0101), Agreement Master table (F38010), Outbound Inventory Agreement Master table (F42I010), and the Outbound Inventory Agreement Detail table (F42I011). Additionally, the system also retrieves data from the following tables:
-
Outbound Inventory Agreement Transaction File (F42I015)
-
Agreement Quantities (F38011)
-
Outbound Inventory Agreement Master Change History (F42I06)
-
Outbound Inventory Agreement Quantities Change History (F42I07)
-
Outbound Inventory Item Balance (F42I021)
This application provides the ability to create and run reports on outbound inventory agreements including outbound agreement analysis and outbound inventory agreement quantity analysis.
10.1.1 Processing Options
Processing options enable you to specify the default processing for programs and reports.
10.1.1.1 Default
- Agreement Number
-
Use this processing option to specify the default agreement number that appears in the application.
- Supplement Number
-
Use this processing option to specify the default agreement supplement number that appears in the application.
- Branch/Plant
-
Use this processing option to specify the default outbound branch/plant that appears in the application.
- Agreement Type
-
Use this processing option to specify the default agreement type that appears in the application.
- Item Number
-
Use this processing option to specify the default item number that appears in the application.
10.1.1.2 Process
- 1. As If Primary UOM
-
Use this processing option to specify the default As If Primary Unit Of Measure that appears in the application.
- 2. As If Secondary UOM
-
Use this processing option to specify the default As If Secondary Unit Of Measure that appears in the application.
- 3. As If Currency Code
-
Use this processing option to specify the default As If Currency Code that appears in the application.
The system uses the As If Primary UOM, As if Secondary UOM, and the As If Currency Code values to convert quantities and currencies to be used by the application.
10.1.1.3 Versions
- 1. One View Outbound Inventory Valuation Inquiry (P42I271)
-
Use this processing option to identify the version of the One View Outbound Inventory Valuation Inquiry (P42I271) program when accessed from the Form menu.
If you leave this processing option blank, the system uses the version ZJDE0001.
- 2. One View Outbound Inventory Consumption Inquiry (P42I272)
-
Use this processing option to identify the version of the One View Outbound Inventory Consumption Inquiry (P42I272) when accessed from the Form menu.
If you leave this processing option blank, the system uses the version ZJDE0001.
10.1.2 Special Processing
The system extracts and displays the month and year from important dates to filter information and create reports.
10.1.3 Reports
The reports delivered with the One View Outbound Agreement Inquiry application are:
-
Outbound Agreement Analysis
-
Outbound Agreement Quantity Analysis
-
Outbound Agreement Status Analysis (Release 9.1 Update)
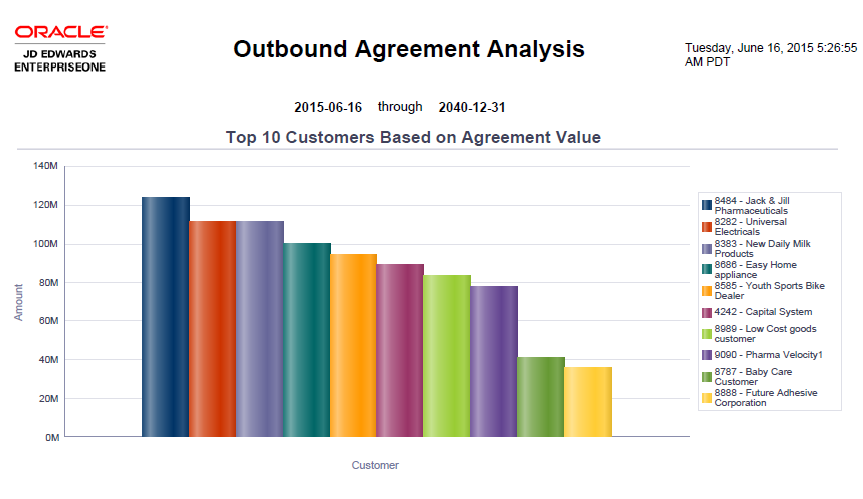
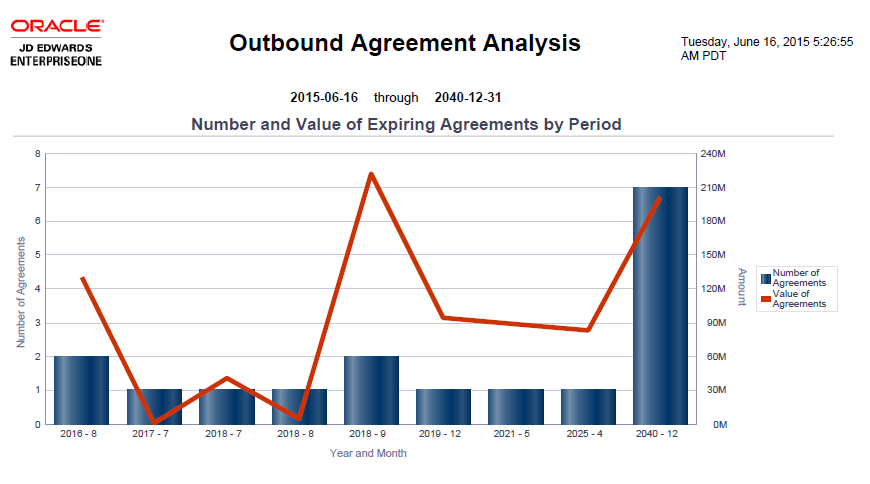
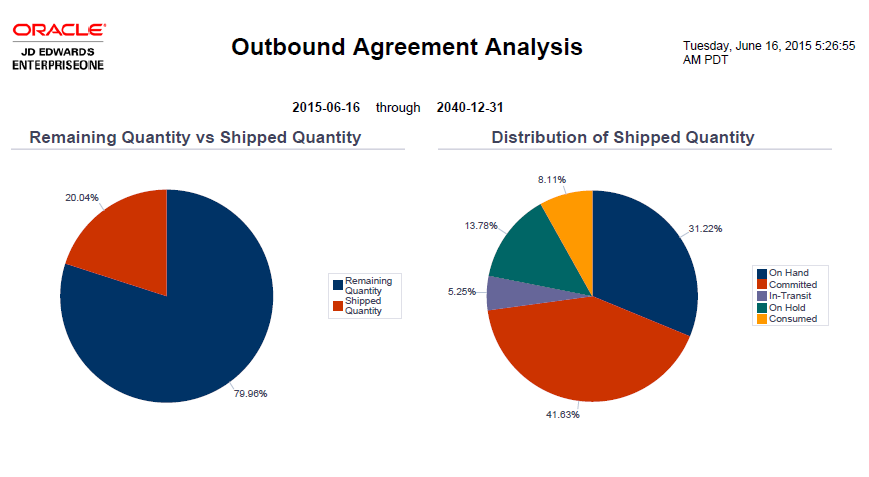
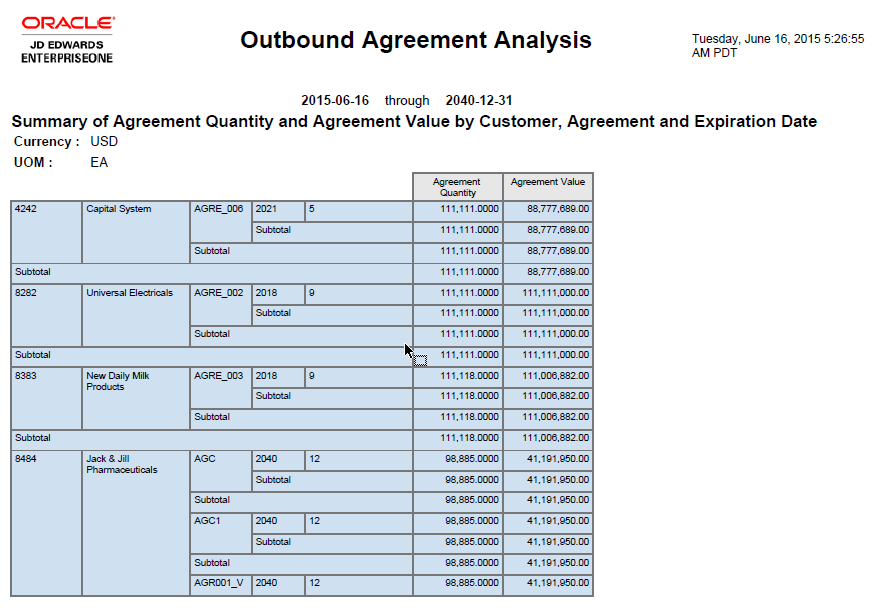
10.1.3.1 Outbound Agreement Analysis Report
The Outbound Agreement Analysis report enables you to analyze outbound inventory agreement value and quantity data. The report contains the following components:
| Component | Description |
|---|---|
| Top 10 Customers Based on Agreement Value (bar graph) | This graph enables you to view your top 10 customers in terms of agreement value for a given time period. |
| Number and Value of Expiring Agreements by Period (bar graph) | This graph enables you to review the number and value of outbound inventory agreements that will expire in a given period of time. |
| Remaining Quantity vs Shipped Quantity (pie chart) | This chart enables you to compare agreement remaining quantity and quantity shipped to your customers' location for a given time period. |
| Distribution of Shipped Quantity (pie chart) | This chart enables you to review the distribution of shipped quantity to your customers' location. The chart enables you to review the quantity in transit, committed quantity, quantity on hand, quantity on hold and consumed quantity. |
| Summary of Agreement Quantity and Agreement Value by Customer, Agreement and Expiration Date (table) | This table displays the agreement value and quantity information based on customer, agreement number and agreement expiration dates. |
| Outbound Agreement Analysis Details Table (table) | This table provides details of outbound inventory agreement analysis and lists agreement number, agreement supplement, agreement detail expiration date, agreement quantity, remaining quantity, currency and agreement value. |
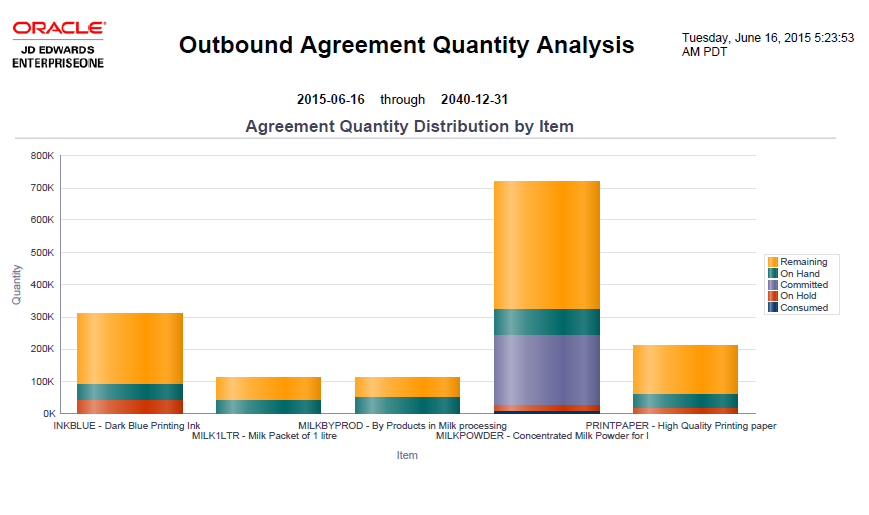
10.1.3.2 Outbound Agreement Quantity Analysis
The Outbound Agreement Quantity Analysis enables you to analyze outbound inventory agreement quantity information based on items and customers. The report contains the following components:
| Component | Description |
|---|---|
| Agreement Quantity Distribution by Item (bar graph) | This graph enables you to review the distribution of agreement quantity (quantity on hand, quantity on hold, agreement remaining quantity, committed quantity, and consumed quantity) for different items. |
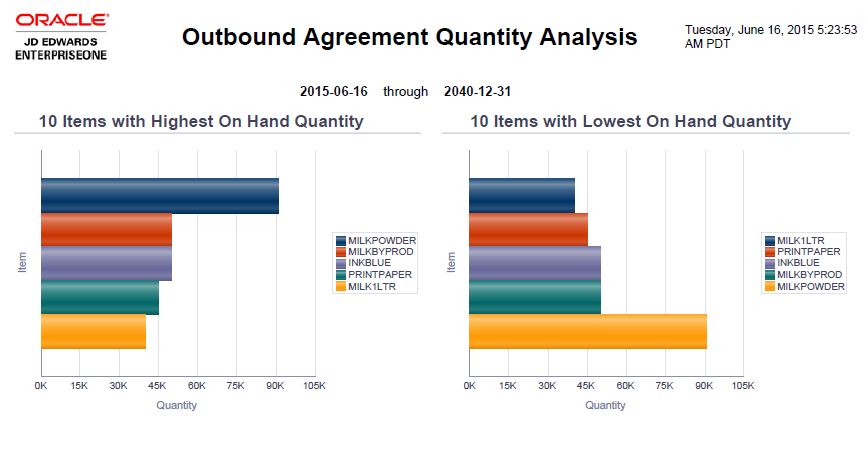
| 10 Items with Highest On Hand Quantity (bar graph) | This graph enables to view the 10 items with the highest on hand quantity at your customer's location. |
| 10 Items With Lowest On Hand Quantity (bar graph) | This graph enables you to review the 10 items with the lowest on hand quantity at your customer's location. |
| Outbound Agreement Revisions Analysis (bar graph) | This graph enables you to review the number of revisions that were made to different outbound inventory agreements header and detail. |
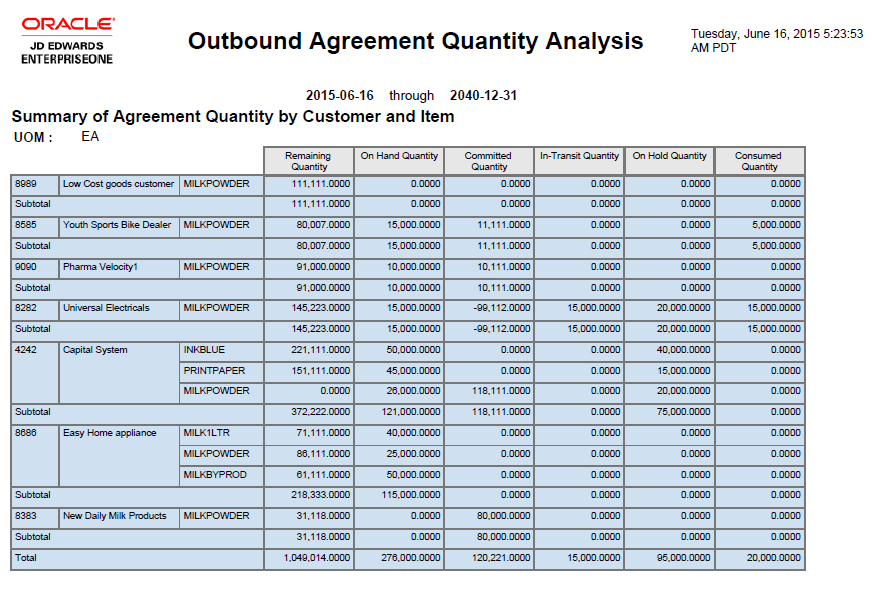
| Summary of Agreement Quantity by Customer and Item (table) | This table enables you to review the distribution of agreement quantity (quantity on hand, quantity on hold, agreement remaining quantity, committed quantity, and consumed quantity) based on item and customer. |
| Outbound Agreement Quantity Analysis Details Table | This table enables you to review agreement quantity analysis and lists customer sold to name, item number, location, agreement quantity, agreement remaining quantity, on hand quantity, committed quantity, quantity in transit, quantity on hold and consumed quantity. |
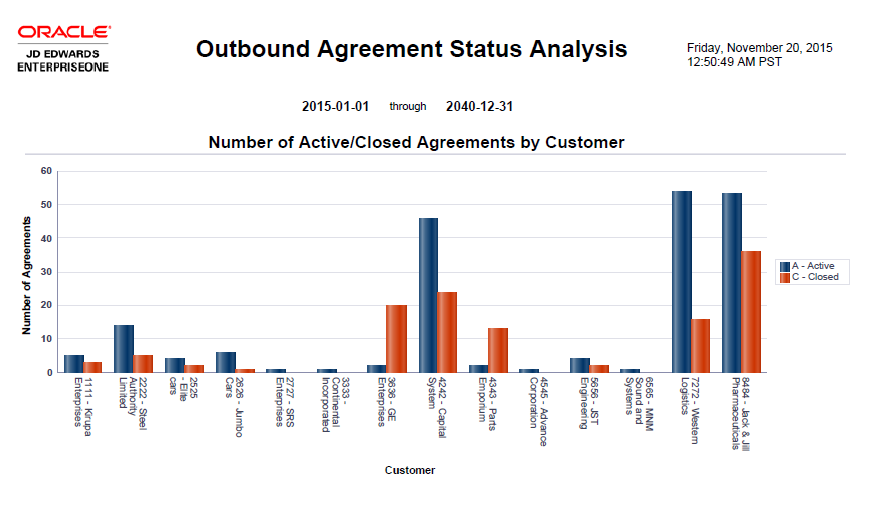
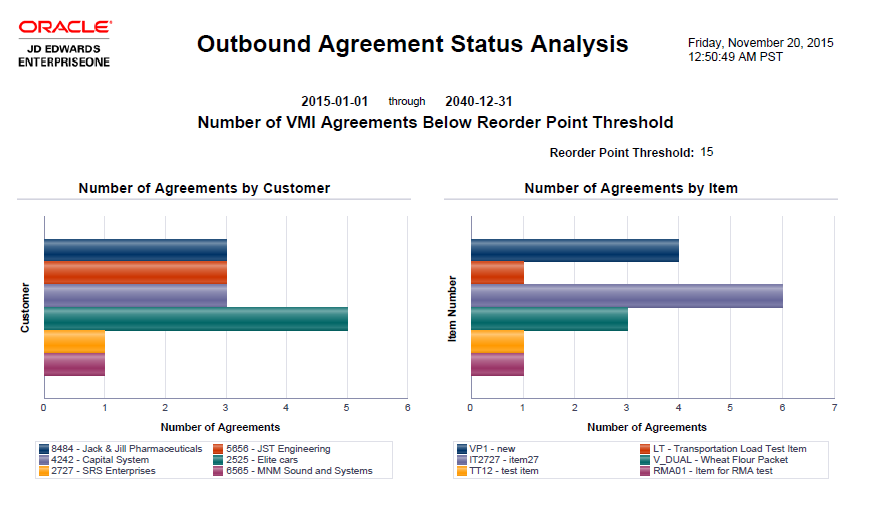
10.1.3.3 Outbound Agreement Status Analysis (Release 9.1 Update)
The Outbound Agreement Status Analysis report enables you to analyze the statuses of different outbound inventory agreements. The report contains the following components:
| Component | Description |
|---|---|
| Number of Active/Closed Agreements by Customer (bar graph) | This graph enables you to review and compare the number of active and closed outbound inventory agreements for different customers. |
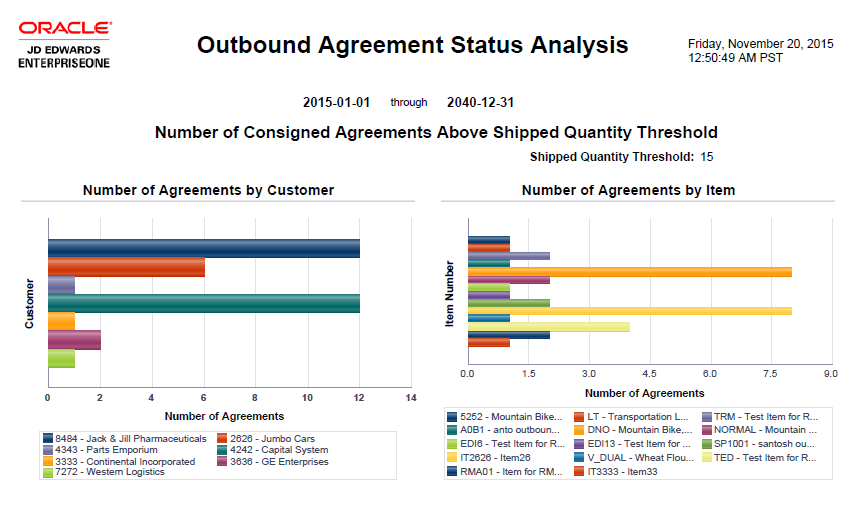
| Number of Consigned Agreements Above Shipped Quantity Threshold - Number of Agreements by Customer (bar graph) | This graph enables you to review the agreements with different customers, which have crossed the shipped quantity threshold. |
| Number of Consigned Agreements Above Shipped Quantity Threshold - Number of Agreements by Item (bar graph) | This graph enables you to review the agreements with different items, which have crossed the shipped quantity threshold. |
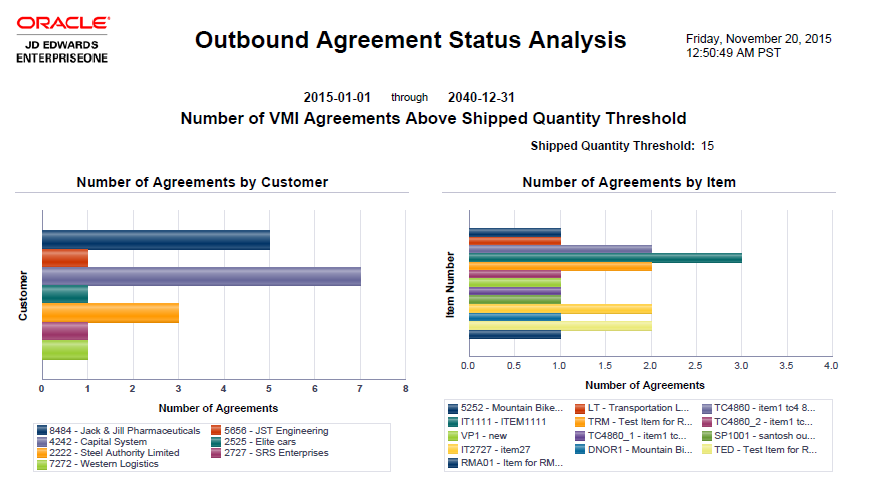
| Number of VMI Agreements Above Shipped Quantity Threshold - Number of Agreements by Customer (bar graph) | This graph enables you to review the agreements with different customers, which have crossed the shipped quantity threshold.
Shipped Quantity Threshold is a value that represents the percentage of agreement quantity which is compared against total shipped quantity from an agreement. |
| Number of VMI Agreements Above Shipped Quantity Threshold - Number of Agreements by Item (bar graph) | This graph enables you to review the agreements with different items, which have crossed the shipped quantity threshold. |
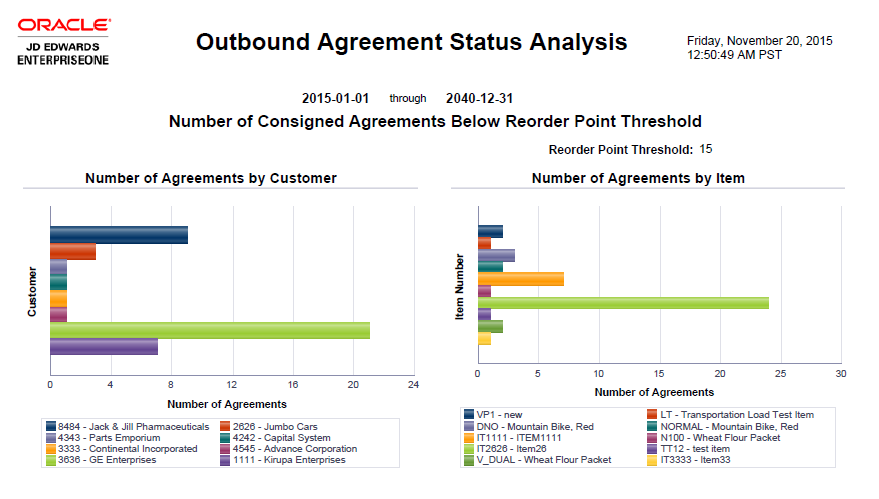
| Number of Consigned Agreements Below Reorder Point Threshold - Number of Agreements by Customer (bar graph) | This graph enables you to review the agreements with different customers, which are below the reorder point threshold.
Reorder Point Threshold is a value that represents the percentage of reorder point of an agreement, which is compared against total shipped quantity from the agreement that is available for consumption at the customer's location. You can optionally add committed and in-transit quantity to the shipped quantity. |
| Number of Consigned Agreements Below Reorder Point Threshold - Number of Agreements by Item (bar graph) | This graph enables you to review the agreements with different items, which are below the reorder point threshold. |
| Number of VMI Agreements Below Reorder Point Threshold - Number of Agreements by Customer (bar graph) | This graph enables you to review the agreements with different customers, which are below the reorder point threshold. |
| Number of VMI Agreements Below Reorder Point Threshold - Number of Agreements by Item (bar graph) | This graph enables you to review the agreements with different items, which are below the reorder point threshold. |
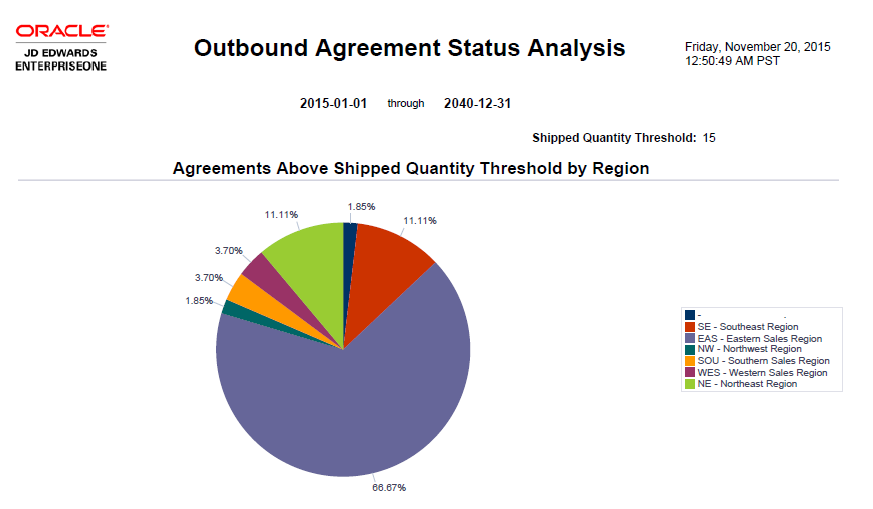
| Agreements Above Shipped Quantity Threshold by Region (pie chart) | This chart enables you to review the percentage of agreements that have crossed the shipped quantity threshold across different regions. |
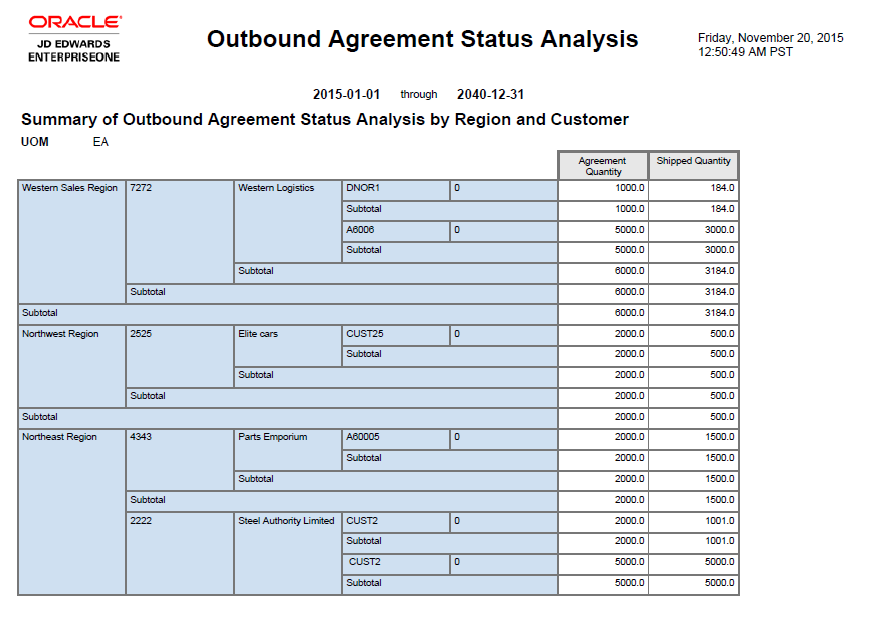
| Summary of Outbound Agreement Status Analysis by Region and Customer (table) | This table enables you to review agreement quantity and shipped quantity for different regions and customers. |
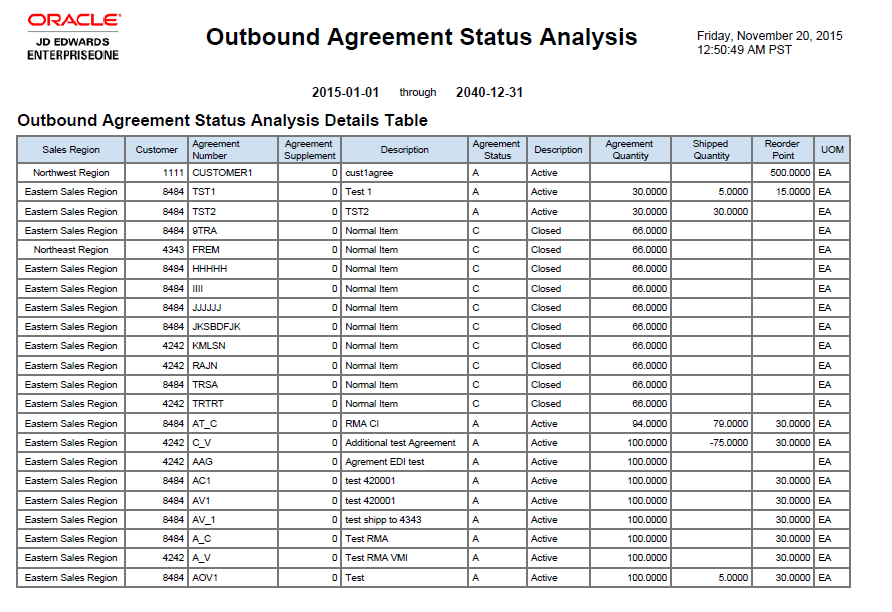
| Outbound Agreement Status Analysis Details Table (table) | This table provides details of outbound agreement status analysis and lists sales region, customer, agreement number, agreement supplement, agreement status, agreement quantity, shipped quantity, and reorder point. |
10.2 One View Outbound Inventory Valuation Inquiry (P42I271)
Access the One View Outbound Inventory Valuation Inquiry application (P42I271) on the Outbound Inventory Inquiries (G42I20) menu. Use One View Outbound Valuation Inquiry to query cost and revenue analysis and create outbound inventory valuation inquiry reports. One View Outbound Valuation Inquiry uses the Outbound Inventory Valuation Inquiry business view (V42I271), which include columns from the Outbound Inventory Agreement Acknowledge table (F42I02), Outbound Inventory Agreement Transaction File table (F42I015), Outbound Inventory Agreement Master table (F42I010), and the Outbound Inventory Agreement Detail table (F42I011).
This application provides the ability to create and run reports to analyze cost and revenue associated with outbound inventory transactions.
10.2.1 Processing Options
Processing options enable you to specify the default processing for programs and reports.
10.2.1.1 Default
- Sold To
-
Use this processing option to specify the default Sold To value that appears in the application.
- Ship To
-
Use this processing option to specify the default Ship To value that appears in the application.
10.2.1.2 Process
- 1. As If Primary UOM
-
Use this processing option to specify the default As If Primary Unit Of Measure that appears in the application.
- 2. As If Secondary UOM
-
Use this processing option to specify the default As If Secondary Unit Of Measure that appears in the application.
- 3. As If Currency Code
-
Use this processing option to specify the default As If Currency Code that appears in the application.
The system uses the As If Primary UOM, As if Secondary UOM, and the As If Currency Code values to convert quantities and currencies to be used by the application.
- 4. Cost used for Valuation
-
Use this processing option to specify how the system processes the cost to be used for Value of Inventory for Supplier. Values are
Blank: Transfer Cost from the original sales order
1: Cost from the supplying branch/plant of the original sales order
2: Cost from the outbound branch/plant.
10.2.1.3 Versions
- 1. One View Outbound Inventory Agreement Inquiry (P42I270)
-
Use this processing option to identify the version of the One View Outbound Agreement Inquiry application (P42I270) when accessed from the Form menu.
If you leave this processing option blank, the system uses the version ZJDE0001.
- 2. One View Outbound Inventory Consumption Inquiry (P42I272)
-
Use this processing option to identify the version of the One View Outbound Inventory Consumption Inquiry (P42I272) when accessed from the Form menu.
If you leave this processing option blank, the system uses the version ZJDE0001.
10.2.2 Special Processing
The system extracts and displays the month and year from important dates to filter information and create reports.
For the Outbound Inventory Valuation Analysis by Item report, the system requires a single item to filter information and design reports for the specified item.
For the Value and Age of Inventory by Item and Customer report, the system requires a single item and a single customer to filter information and design reports for the specified item and customer.
|
Note: For calculating inventory valuation, the system uses the values you enter in the processing options, but for calculating profit, the system uses the actual sales amounts from vendor managed or consigned inventory sales orders. |
10.2.3 Reports
The reports delivered with the One View Outbound Inventory Valuation Inquiry application are:
-
Outbound Inventory Valuation Analysis by Item
-
Value and Age of Inventory by Item and Customer
-
Outbound Inventory Valuation Analysis by Customer (Release 9.1 Update)
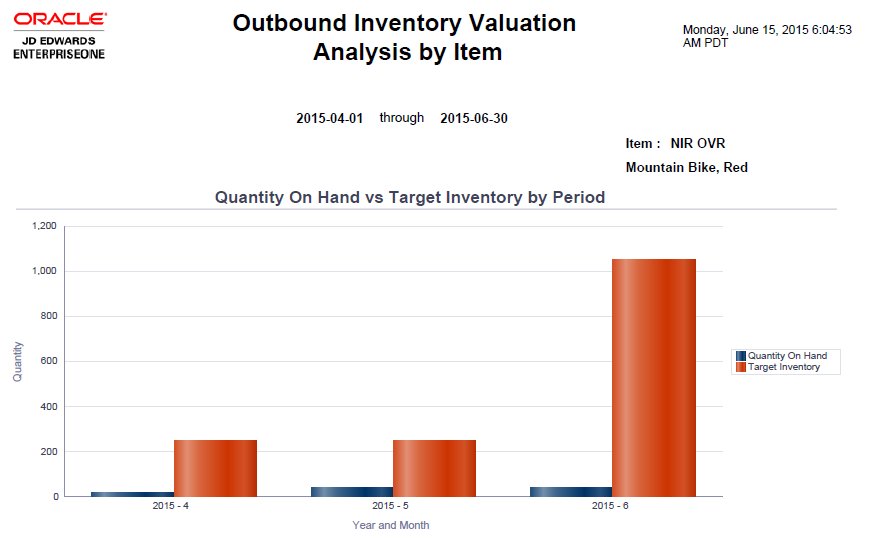
10.2.3.1 Outbound Inventory Valuation Analysis by Item
The Outbound Inventory Valuation Analysis by Item report enables you to analyze cost and revenue associated with outbound inventory transactions. The report contains the following components:
| Component | Description |
|---|---|
| Quantity On Hand vs Target Inventory by Period (bar graph) | This graph enables to you to review and compare the quantity available for consumption and target inventory level at the customers' location for a given period. |
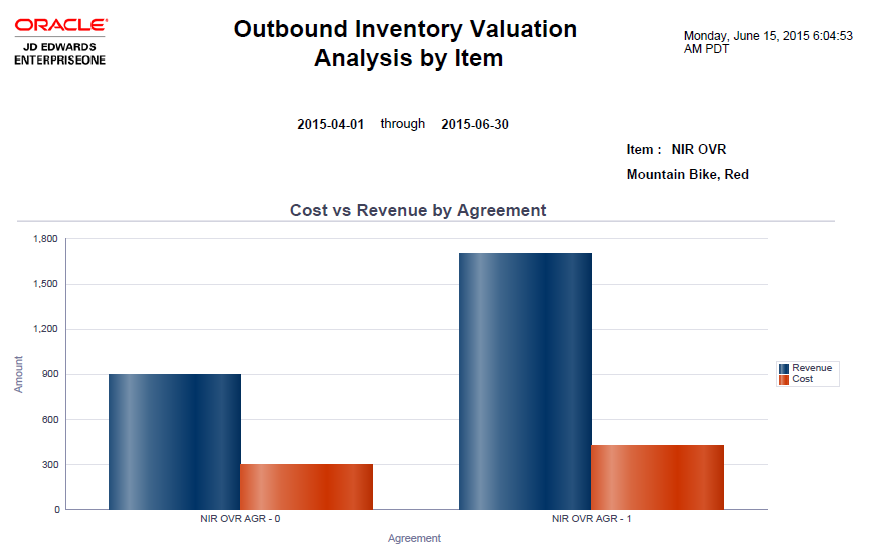
| Cost vs Revenue by Agreement (bar graph) | This graph enables you to compare the cost and revenue generated for different outbound inventory agreements for a given period. |
| Summary of Cost and Revenue by Agreement and Period (table) | This table enables you to review and compare cost and revenue for different agreements for a given period. |
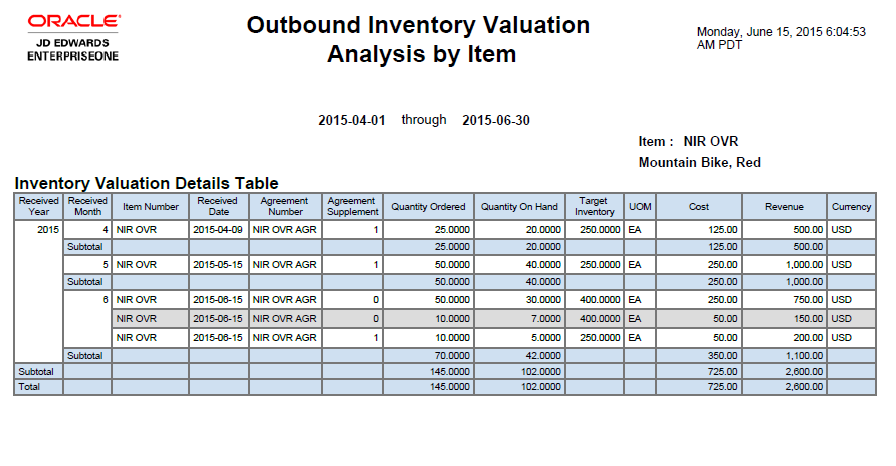
| Inventory Valuation Details Table (table) | This table describes inventory valuation details and lists quantity received year, quantity received month, item number, quantity received date, agreement number, quantity ordered, quantity on hand, target inventory, and cost and revenue. |
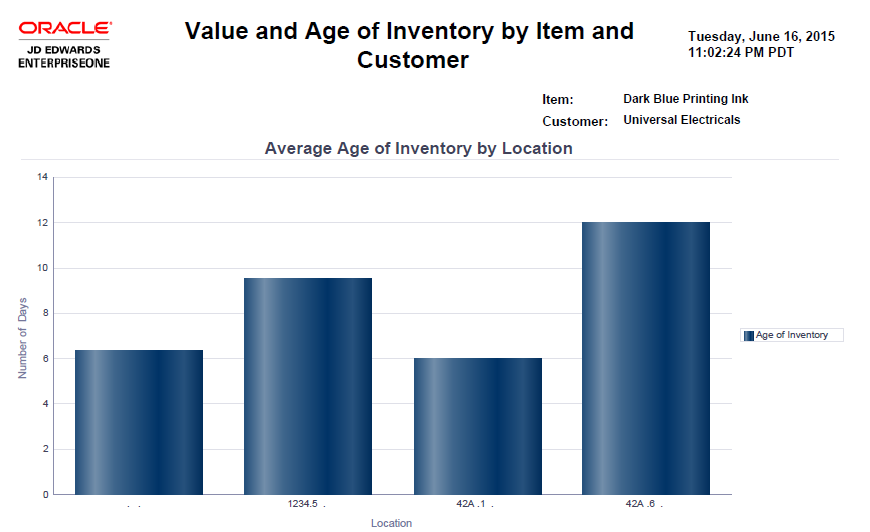
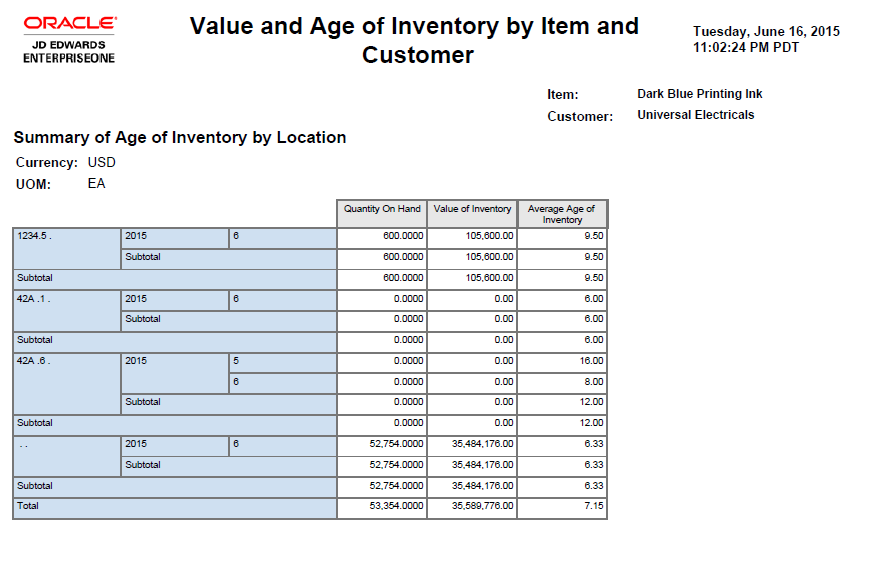
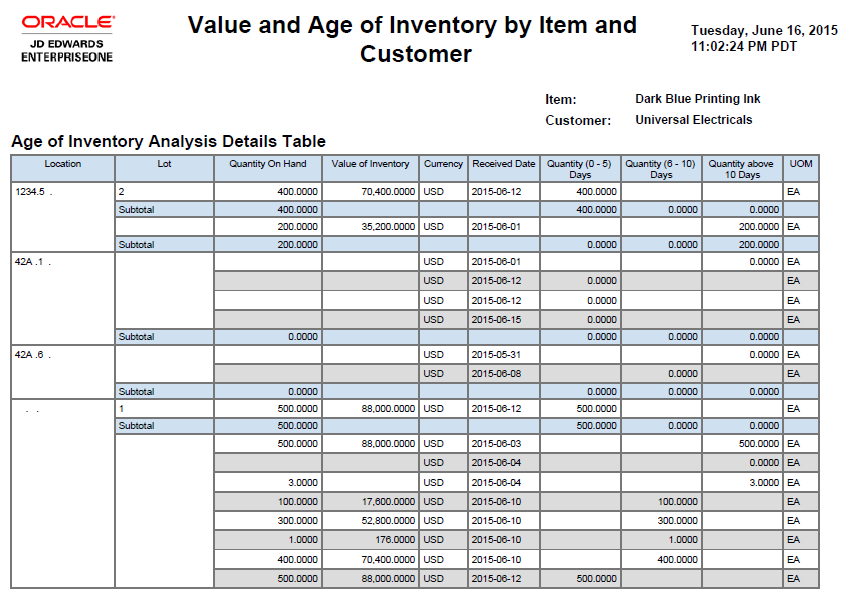
10.2.3.2 Value and Age of Inventory by Item and Customer
The Value and Age of Inventory by Item and Customer report enables you to review value and age of outbound inventory at your customer's location. The report contains the following components:
| Component | Description |
|---|---|
| Average Age of Inventory by Location (bar graph) | This graph enables you to review average age of inventory of an item at different customer locations. |
| Age of Inventory for Quantity On Hand by Location (bar graph) | This graph enables you to review age of inventory for the quantity available for consumption for an item at different customer locations. |
| Value of Inventory by Location (bar graph) | This graph enables you to review the value of inventory for an item at different customer locations. |
| Summary of Age of Inventory by Location (table) | This table enables you to review quantity available for consumption, average age of inventory and value of inventory for an item at different customer locations. |
| Age of Inventory Analysis Details Table | This table describes outbound inventory analysis and lists location, lot, quantity on hand, value of inventory, and differentiates quantity based on age of inventory. |
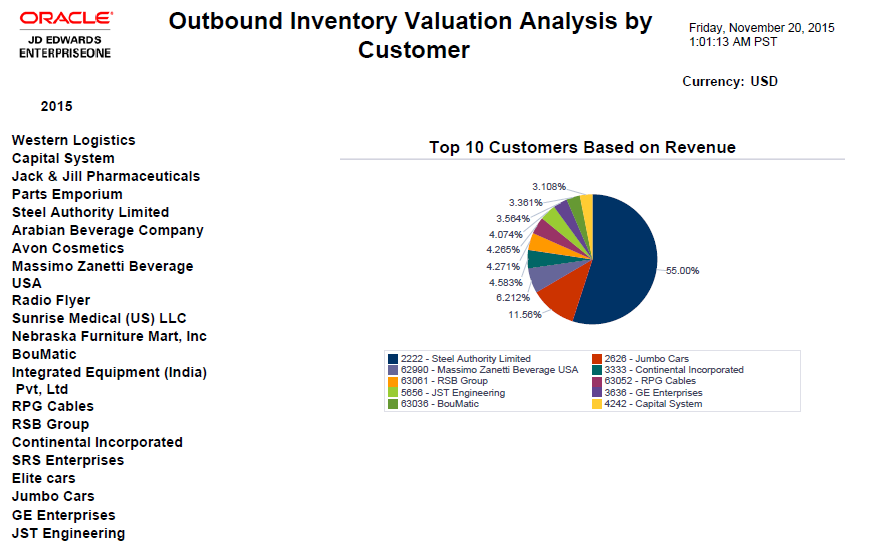
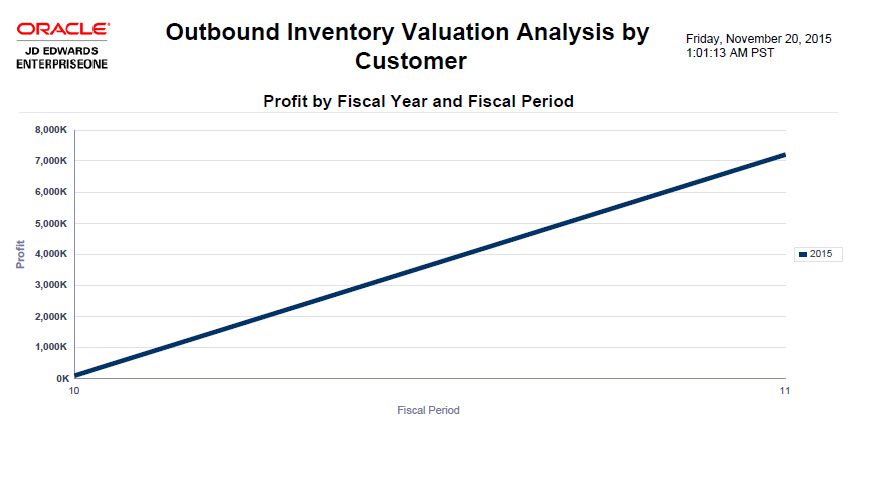
10.2.3.3 Outbound Inventory Valuation Analysis by Customer (Release 9.1 Update)
The Outbound Inventory Valuation Analysis by Customer report enables you to analyze outbound inventory sales value for different items and customers. The report contains the following components:
| Component | Description |
|---|---|
| Top 10 Customers Based on Revenue (pie chart) | This chart enables you to view your top 10 customers in terms of revenue. |
| Profit by Fiscal Year and Fiscal Period (line graph) | This graph enables you to review your profit based on fiscal year over a period of time. |
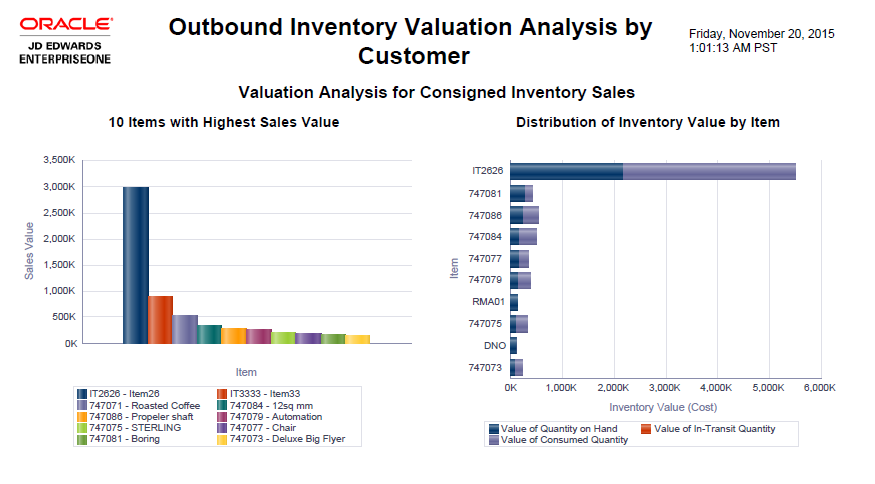
| Valuation Analysis for Consigned Inventory Sales - 10 Items with Highest Sales value (bar graph) | This graph enables you to review the 10 items with the highest sales value for consigned inventory agreements. |
| Valuation Analysis for Consigned Inventory Sales - Distribution of Inventory Value by Item (bar graph) | This graph enables you to review the distribution of Value of Quantity on Hand, Value of Consumed Quantity, and Value of In-Transit Quantity for different items. |
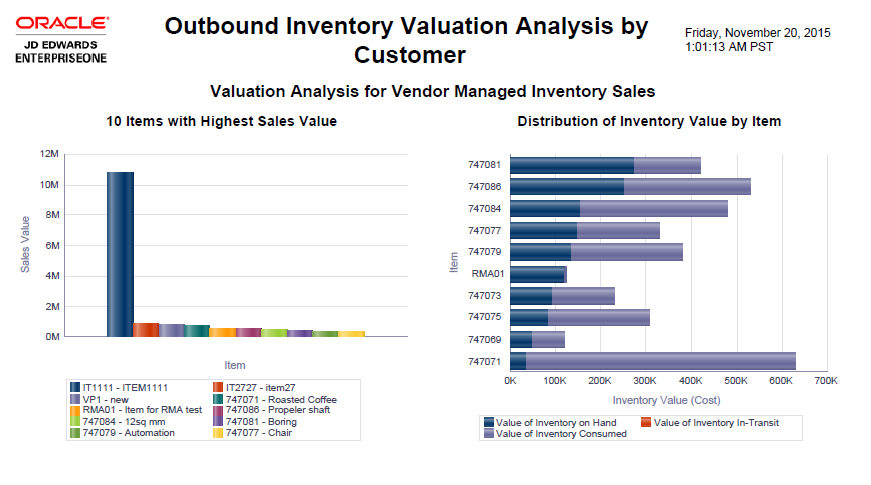
| Valuation Analysis for Vendor Managed Inventory Sales - 10 Items with Highest Sales value (bar graph) | This graph enables you to review the 10 items with the highest sales value for VMI agreements. |
| Valuation Analysis for Vendor Managed Inventory Sales - Distribution of Inventory Value by Item (bar graph) | This graph enables you to review the distribution of Value of Quantity on Hand, Value of Consumed Quantity, and Value of In-Transit Quantity for different items. |
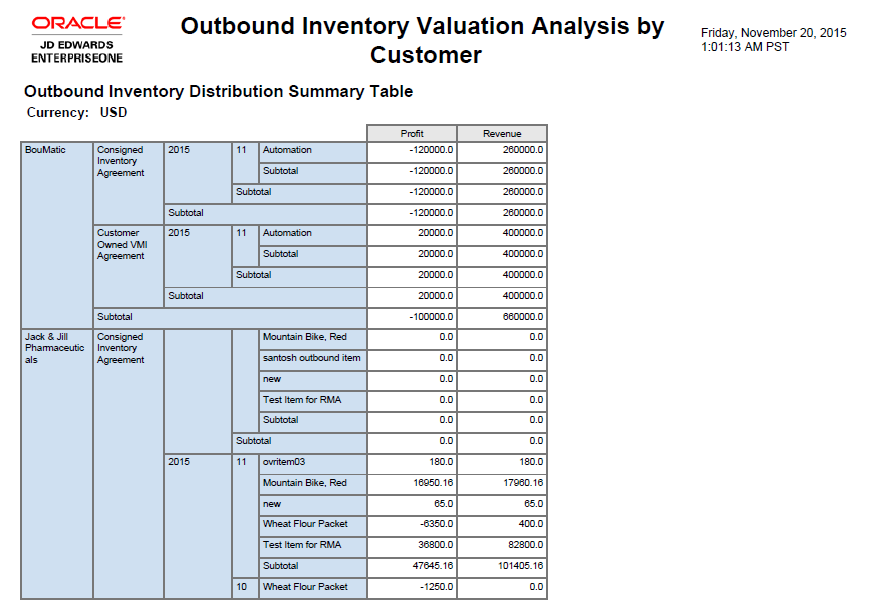
| Outbound Inventory Distribution Summary Table (table) | This table displays the profit and revenue values for different customers. |
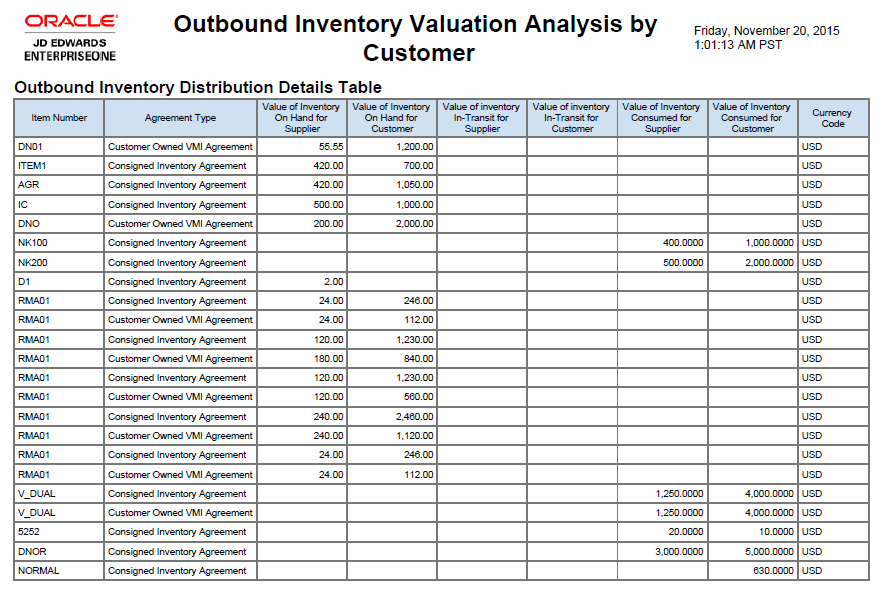
| Outbound Inventory Distribution Details Table (table) | This table provides detailed analysis of the profit and revenue values for different customers and lists item number, agreement type, value of inventory on hand, value of inventory in transit, and value of inventory consumed for supplier and customer and currency code. |
10.3 One View Outbound Inventory Consumption Inquiry (P42I272)
Access the One View Outbound Inventory Consumption Inquiry application (P42I272) on the Outbound Inventory Inquiries (G42I20) menu. Use One View Outbound Inventory Consumption Inquiry to query outbound inventory consumption information and create outbound inventory consumption inquiry reports. One View Outbound Inventory Consumption Inquiry uses the One View Outbound Inventory Consumption Inquiry business view (V42I272), which include columns from the Outbound Inventory Agreement Acknowledge table (F42I02), Outbound Inventory Agreement Transaction File table (F42I015), Outbound Inventory Agreement Master table (F42I010), Outbound Order Consumption Report File table (F42I03), Item Master table (F4101), and the Outbound Inventory Agreement Detail table (F42I011).
This application provides the ability to create and run reports to analyze consumption of outbound inventory from your customers' locations, and replenishment and billing order information.
10.3.1 Processing Options
Processing options enable you to specify the default processing for programs and reports.
10.3.1.1 Default
- Agreement Number
-
Use this processing option to specify the default agreement number that appears in the application.
- Agreement Supplement
-
Use this processing option to specify the default agreement supplement number that appears in the application.
- Item Number
-
Use this processing option to specify the default item number that appears in the application.
- Sold To
-
Use this processing option to specify the default Sold To value that appears in the application.
- Ship To
-
Use this processing option to specify the default Ship To value that appears in the application.
10.3.1.2 Process
- 1. As If Primary UOM
-
Use this processing option to specify the default As If Primary Unit Of Measure that appears in the application.
- 2. As If Secondary UOM
-
Use this processing option to specify the default As If Secondary Unit Of Measure that appears in the application.
- 3. As If Currency Code
-
Use this processing option to specify the default As If Currency Code that appears in the application.
10.3.1.3 Versions
- 1. One View Outbound Inventory Agreement Inquiry (P42I270)
-
Use this processing option to identify the version of the One View Outbound Agreement Inquiry application (P42I270) when accessed from the Form menu.
If you leave this processing option blank, the system uses version ZJDE0001.
- 2. One View Outbound Inventory Valuation Inquiry (P42I271)
-
Use this processing option to identify the version of the One View Outbound Inventory Valuation Inquiry (P42I271) program when accessed from the Form menu.
If you leave this processing option blank, the system uses version ZJDE0001.
10.3.2 Special Processing
The system extracts and displays the month and year from important dates to filter information and create reports.
For the Consumption Analysis by Customer report, the system requires a single customer to filter information and design reports for the specified customer.
For the Received Quantity, Consumption and Revenue Analysis by Item report, the system requires a single item to filter information and design reports for the specified item.
10.3.3 Reports
The reports delivered with the One View Outbound Inventory Consumption Inquiry application are:
-
Consumption Analysis by Customer
-
Received Quantity, Consumption and Revenue Analysis by Item
-
Outbound Sales Analysis (Release 9.1 Update)
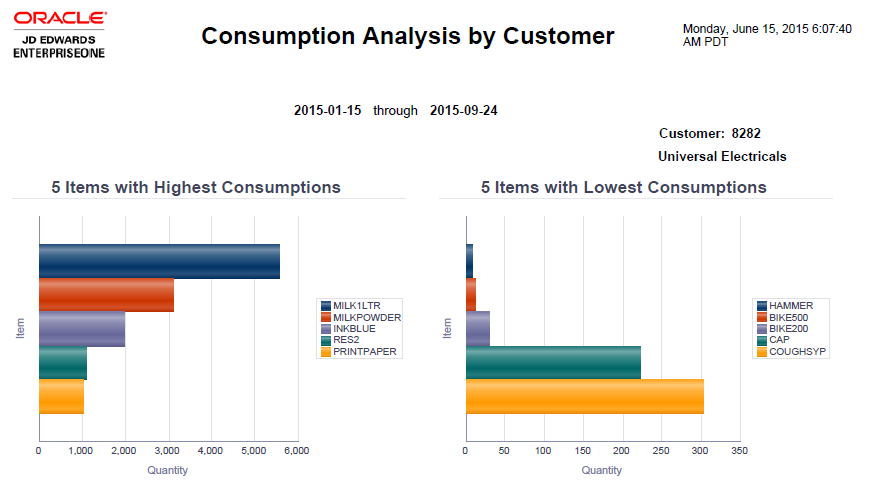
10.3.3.1 Consumption Analysis by Customer
The Consumption Analysis by Customer report enables you to review outbound inventory consumption patterns by your customers. The report contains the following components:
| Component | Description |
|---|---|
| Quantity Consumed Vs Consumption Value by Item (bar graph) | This graph enables you to review and compare quantity and value of outbound inventory consumed for different items sold to a customer. |
| 5 Items with Highest Consumptions (bar graph) | This graph enables you to review 5 items with highest consumption in terms of quantity. |
| 5 Items with Lowest Consumptions (bar graph) | This graph enables you to review 5 items with lowest consumptions in terms of quantity. |
| 5 Items with Highest Consumption Value (bar graph) | This graph enables you to review 5 items with highest consumption in terms of inventory value. |
| 5 Items with Lowest Consumption Value (bar graph) | This graph enables you to review 5 items with lowest consumption in terms of inventory value. |
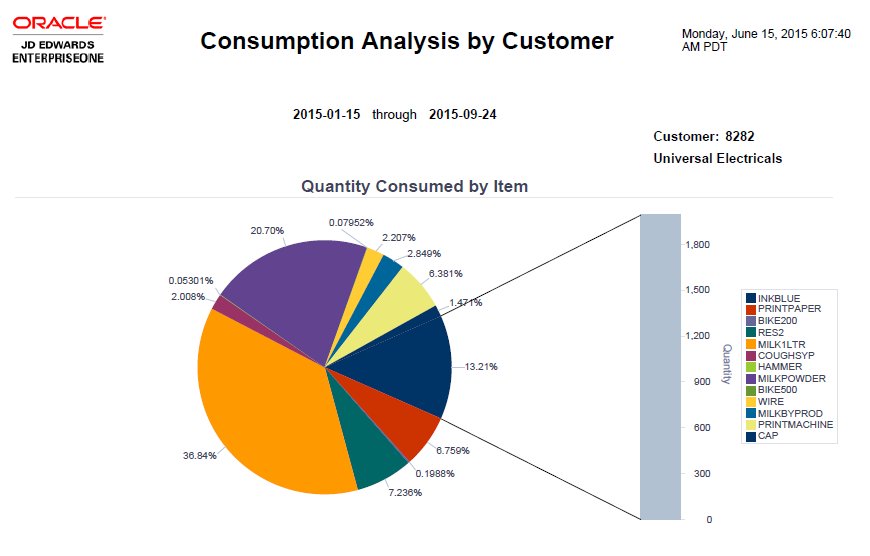
| Quantity Consumed by Item (pie chart) | This chart enables you to review the ratio of quantities of different items consumed by a customer. |
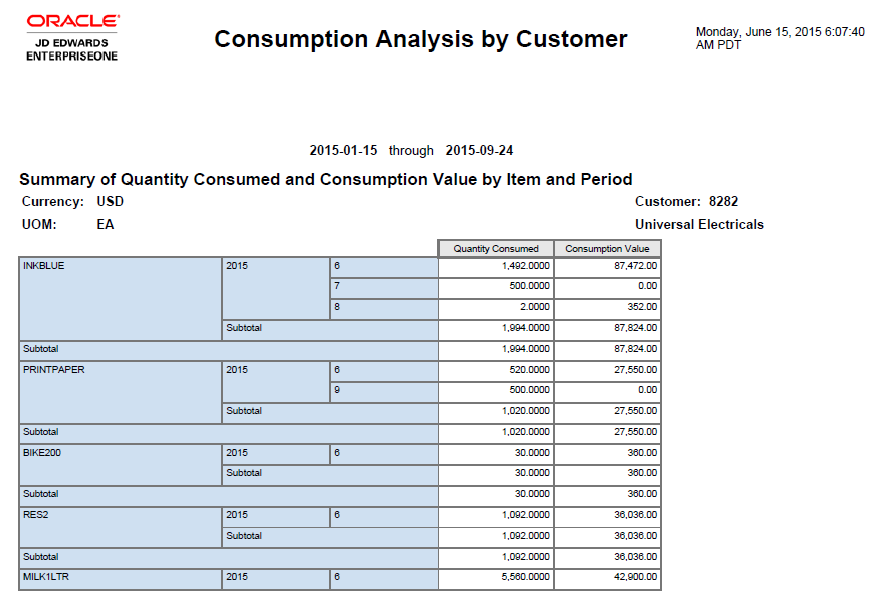
| Summary of Quantity Consumed and Consumption Value by Item and Period (table) | This table enables you to review and compare the quantity and value of outbound inventory consumed by a customer for different items. |
| Consumption Analysis Details Table (table) | This table describes consumption pattern and lists quantity consumption year, quantity consumption month, item number, quantity consumed and the value of consumed inventory. |
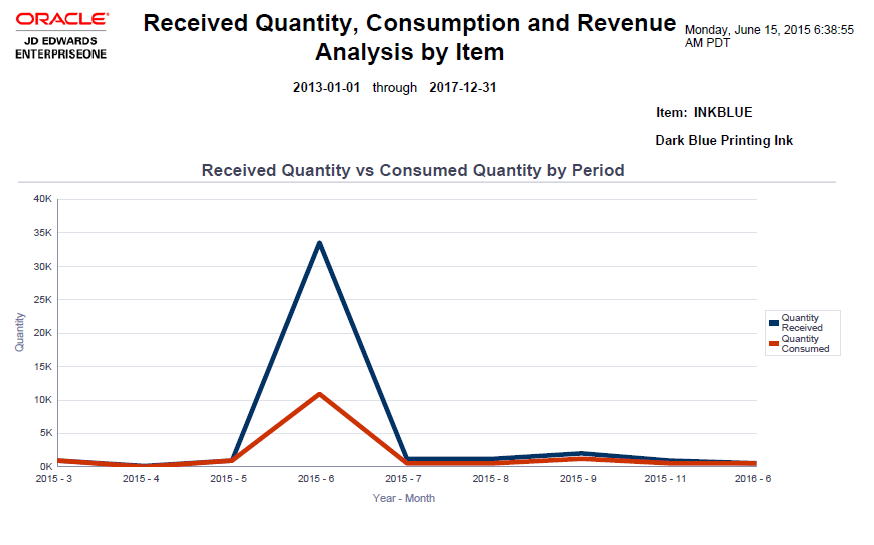
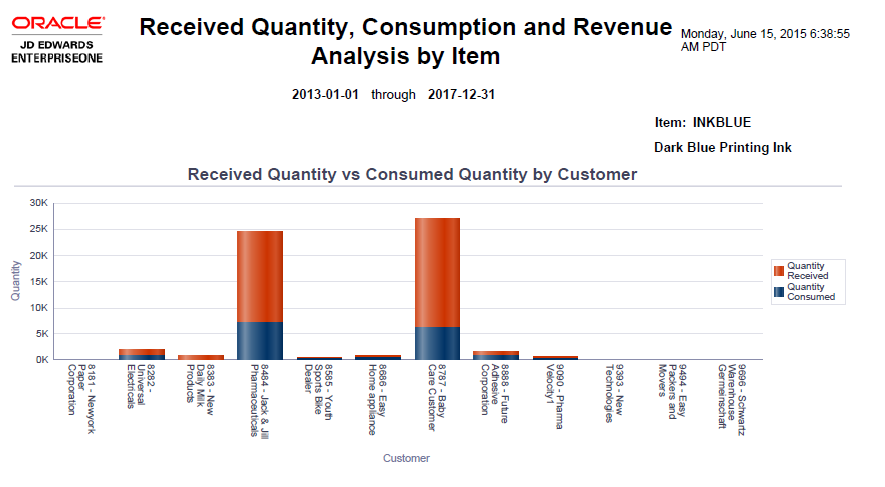
10.3.3.2 Received Quantity, Consumption and Revenue Analysis by Item
The Received Quantity, Consumption and Revenue Analysis by Item report enables you to analyze cost and revenue for different items you sell to a customer. The report contains the following components:
| Component | Description |
|---|---|
| Received Quantity vs Consumed Quantity by Period (line chart) | This chart enables you to review and compare quantity received and quantity consumed for an item over a period of time. |
| Received Quantity vs Consumed Quantity by Customer (bar graph) | This graph enables you to compare quantity of an item received and quantity consumed by different customers over a given period. |
| Cost vs Revenue by Customer (bar graph) | This graph enables you to compare and review cost incurred and revenue generated by selling an item to different customers. |
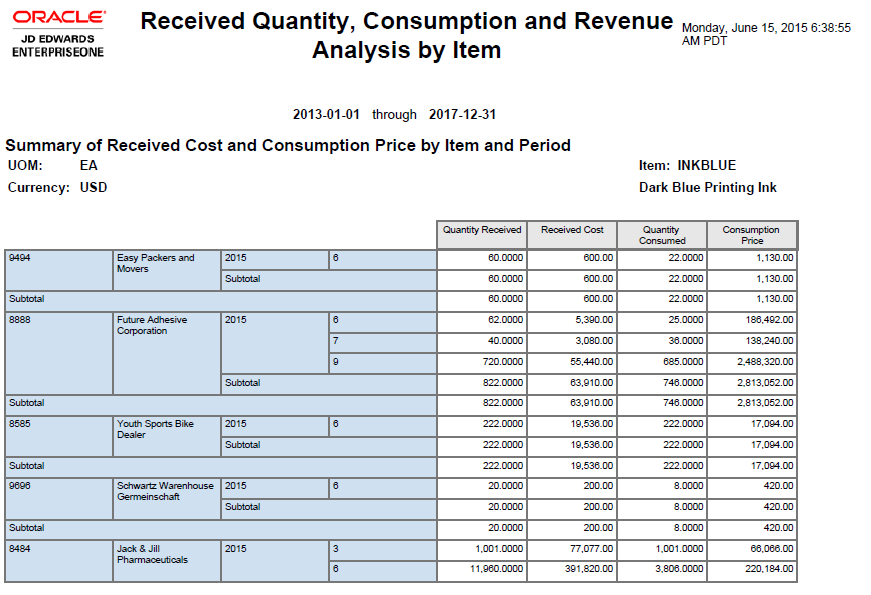
| Summary of Received Cost and Consumption Price by Item and Period (table) | This table compares the cost of outbound inventory received and the revenue generated by the sale of the outbound inventory at your customer's location. |
| Outbound Consumption Analysis Detail Table (table) | This table describes and compares consumption and shipped inventory and lists quantity consumption date, customer, item number, agreement number, quantity received, quantity consumed, quantity received cost and the value of inventory consumed. |
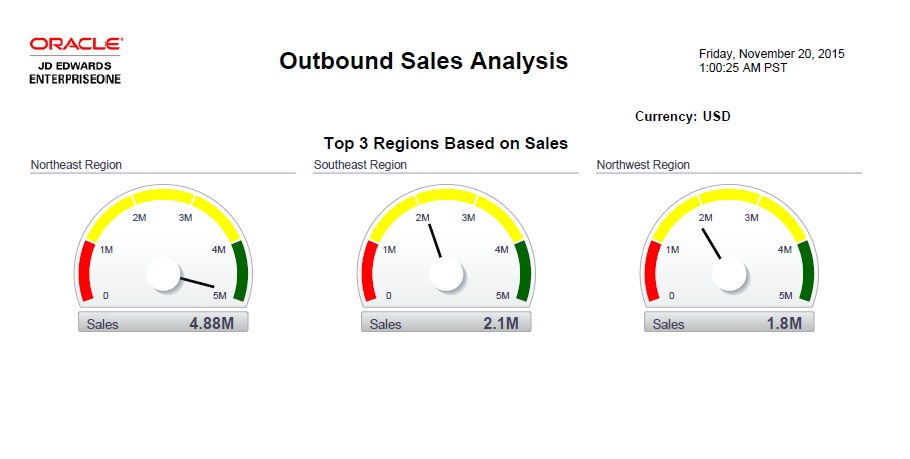
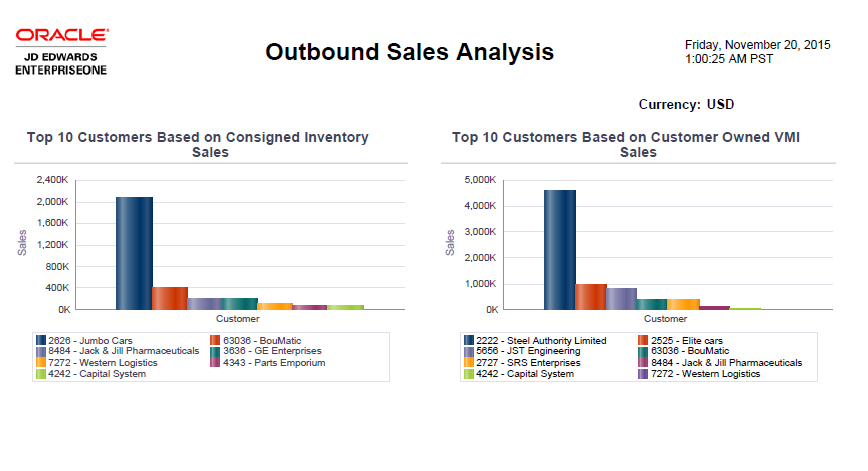
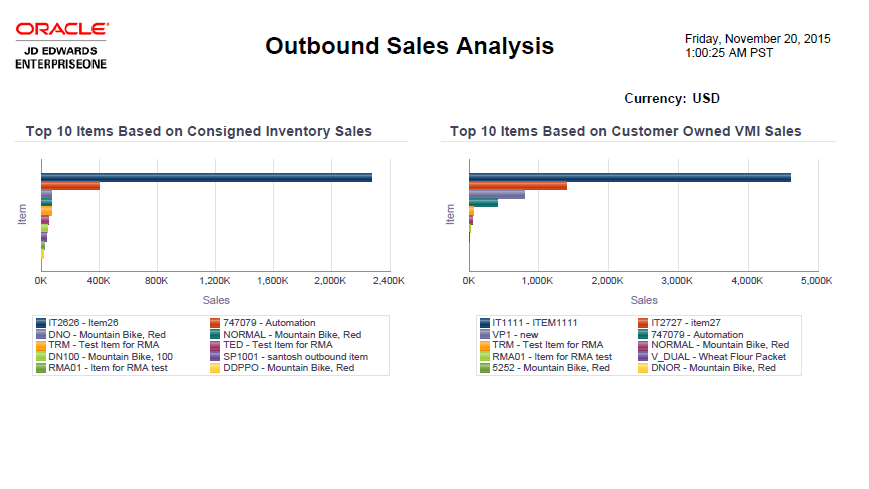
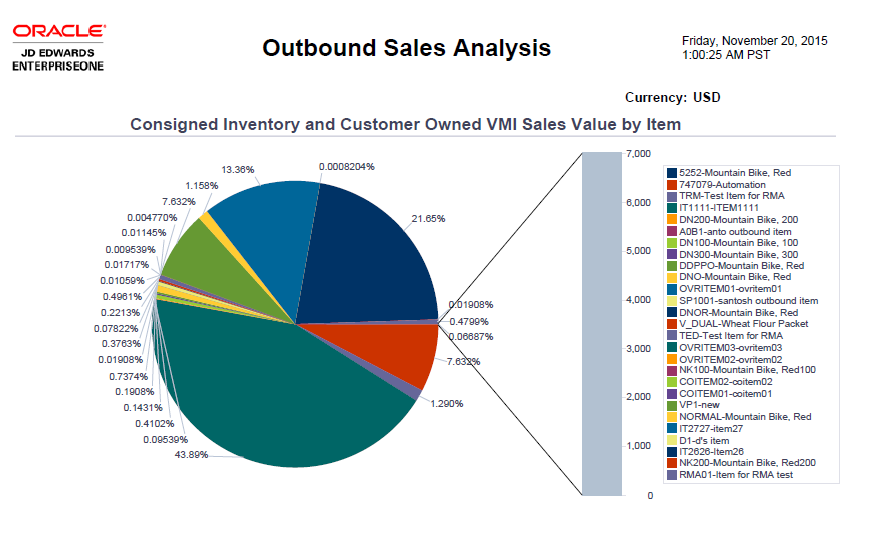
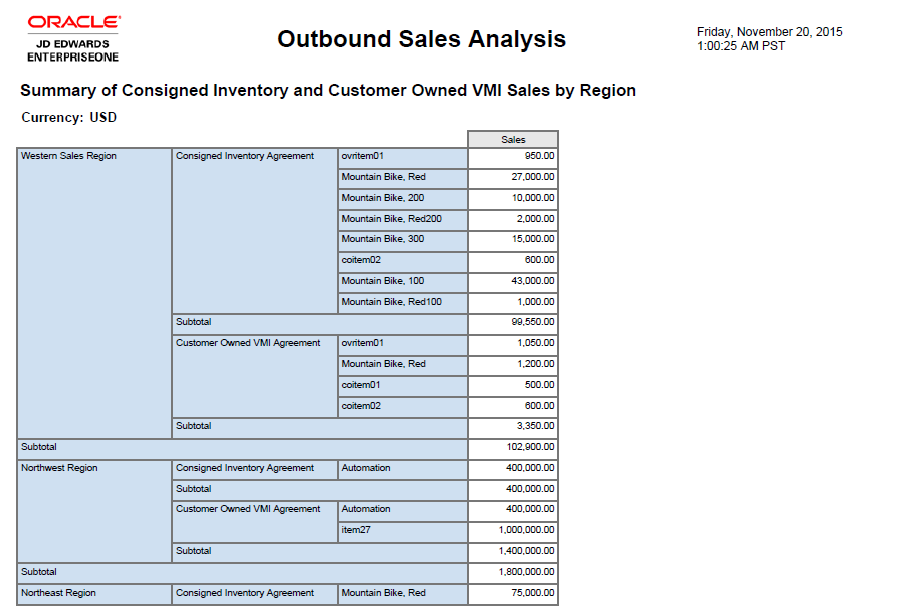
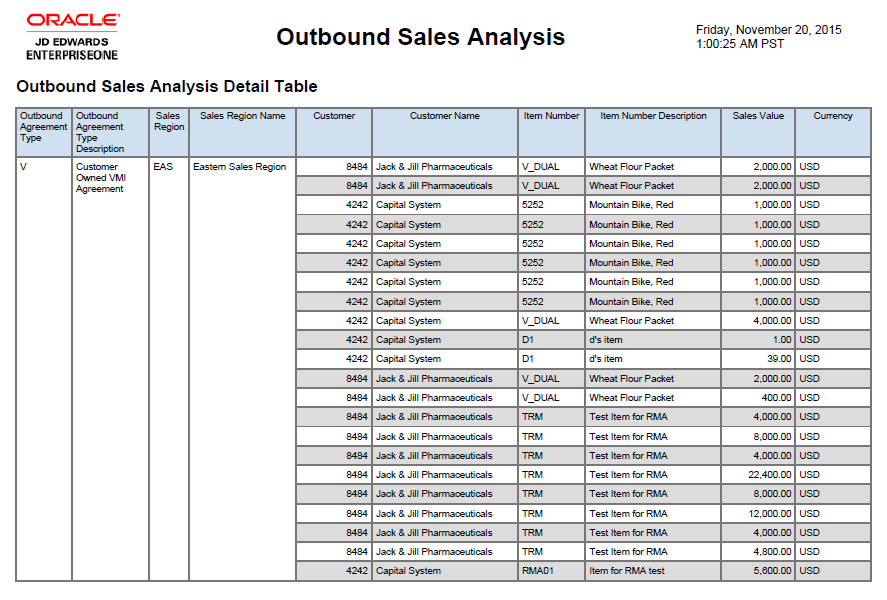
10.3.3.3 Outbound Sales Analysis (Release 9.1 Update)
The Outbound Sales Analysis report enables you to analyze sales values for consigned and customer owned vendor managed inventory transactions. The report contains the following components:
| Component | Description |
|---|---|
| Top 3 Regions Based on Sales | This chart enables you to view your top 3 regions in terms of outbound inventory sales values. |
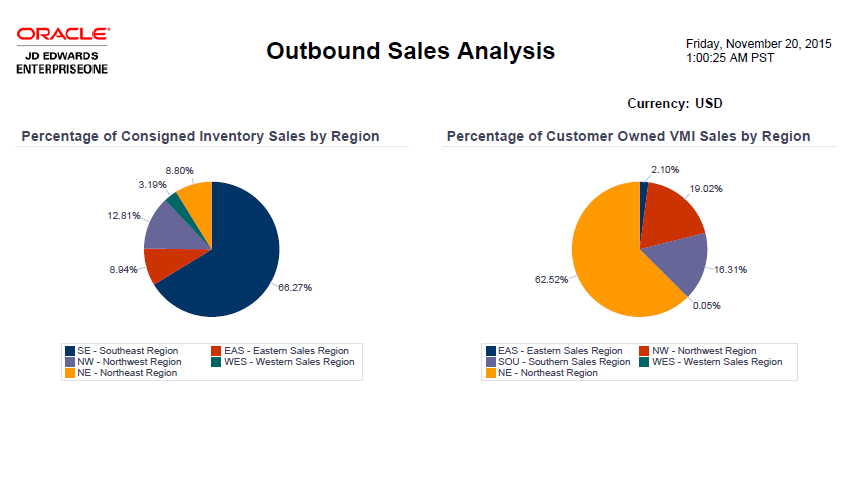
| Percentage of Consigned Inventory Sales by Region (pie chart) | This chart enables you to review the distribution of consigned inventory sales in different regions. |
| Percentage of Customer Owned VMI Sales by Region (pie chart) | This chart enables you to review the distribution of customer owned VMI sales in different regions. |
| Top 10 Customers Based on Consigned Inventory Sales (bar graph) | This graph enables you to view your top 10 customers in terms of consigned inventory sales value. |
| Top 10 Customers Based on Customer Owned VMI Sales (bar graph) | This graph enables you to view your top 10 customers in terms of customer owned VMI sales value. |
| Top 10 Items Based on Consigned Inventory Sales (bar graph) | This graph enables you to view your top 10 items in terms of consigned inventory sales value. |
| Top 10 Items Based on Customer Owned VMI Sales (bar graph) | This graph enables you to view your top 10 items in terms of customer owned VMI sales value. |
| Consigned Inventory and Customer Owned Sales Value by Item (pie chart) | This chart enables you to review the distribution of consigned inventory and customer owned VMI sales for different items. |
| Summary of Consigned Inventory and Customer Owned Sales by Region (table) | This table enables you to review consigned inventory and customer owned VMI sales values for different regions. |
| Outbound Sales Analysis Detail Table (table) | This table provides details of outbound inventory sales analysis and lists agreement type, sales region, customer name, item number, and sales value. |