PTP: Tracking Volume
This chapter covers the following topics:
Overview
This chapter describes how track sales volume, as part of the PTP business process. It includes the following sections.
To track volume, you start in the Collaborator Workbench and launch the Volume Tracking worksheet:
![]()
The Volume Tracking report is where product, territory, and account volumes are forecasted and monitored to ultimately feed volume requirements to operations. Fund planning already covered will be integrated with volume planning, because forecast volumes drive budgets in live accrual environments and drive spending for case rate allowances and other variable spending deals.
In the Volume Tracking - Detail report, you can drill down to the retailers of a territory and see the same data.
Tracking Volume for Territories
-
In My Worksheets (in Collaborator Workbench), click Volume Tracking
Or if a worksheet is currently open, click File > Open. Click Volume Tracking and then click Open.
-
If the worksheet does not show data immediately, click Data > Rerun. Or click the Run button.
-
At the top of the screen, select the territory whose volume you want to see.
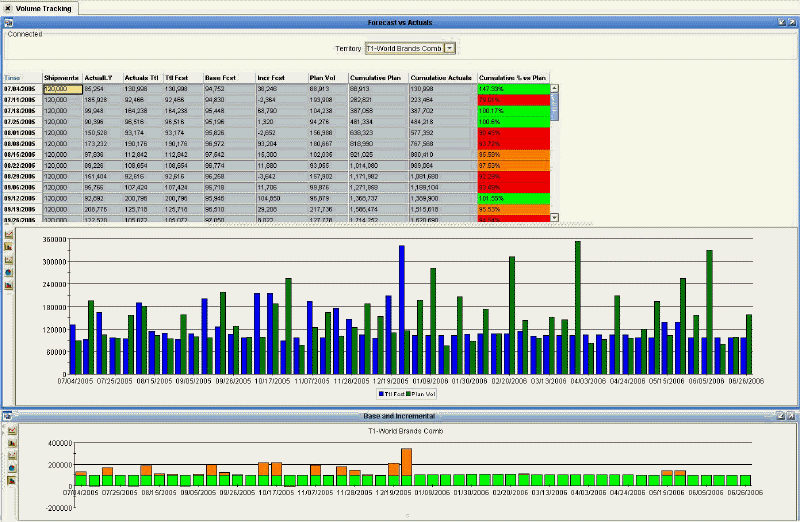
Volume Tracking Table
The table compares last year's sales to this year's plan, for the selected territory.
![]()
This table tracks the following on a weekly basis:
-
Last year's shipments
-
This year's shipments
-
The current year's base volume projection
-
The current year's incremental volume projection
-
Cumulative % versus your plan
The information here can be updated weekly to give you an up-to-date tally of how you are performing versus your plan. Numbers are highlighted in different colors to give you a quick and easy way to keep abreast of your performance:
-
Green is above plan
-
Orange is slightly below plan (95-99.99%)
-
Red is more than 5% below plan
Volume Tracking Graph
The Volume Tracking graph gives you a week-by-week look at the plan and the total forecast.
![]()
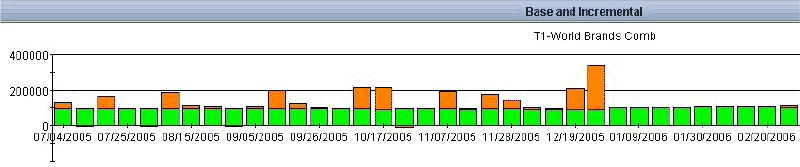
Base and Incremental Graph
The Base and Incremental graph displays the current year's base and incremental sales.
Possible Actions
In this worksheet, depending on your authorization, you can do the following:
Use File > Open to access other PTP worksheets.
Tracking Volume for Retailers
-
In My Worksheets (in Collaborator Workbench), click Volume Tracking - Detail.
Or if a worksheet is currently open, click File > Open. Click Volume Tracking - Detail and then click Open.
-
If the worksheet does not show data immediately, click Data > Rerun. Or click the Run button.
-
At the top of the screen, select the territory and then retailer whose volume you want to see.
This worksheet shows the same data as the Volume Tracking worksheet; see Tracking Volume for Territories.
Reference
Volume Tracking
This worksheet compares last year's sales to this year's plan.
Basics
| Accessing this worksheet |
|
| Levels you can select | Territory |
| Levels used in cross tabulation | None |
| Time aggregation | Weekly |
Business Data
| View | Series | Description |
|---|---|---|
| Forecast vs Actuals | Shipments | Historical shipment volume from the manufacturer to the retailers' locations |
| ActualLY | Actual demand one year ago | |
| Actuals Ttl | Total actual quantity (including both base and incremental volume) | |
| Ttl Fcst | Total volume: base forecast plus incremental forecast | |
| Base Fcst | Base volume: actuals plus forecast | |
| Incr Fcst | Incremental volume: actuals and forecast due only to planned promotions | |
| Plan Vol | The manufacturer's planned volume | |
| Cumulative Actuals | Total actuals (base plus incremental) cumulative to date | |
| Cumulative Plan | Cumulative frozen planned volume | |
| Cumulative % vs Plan | Total cumulative actuals, as a fraction of the plan | |
| Base and Incremental | Base Fcst | Base volume: actuals plus forecast |
| Incr Fcst | Incremental volume: actuals and forecast due only to planned promotions |
Volume Tracking - Detail
This worksheet compares last year's sales to this year's plan, at a lower level.
Basics
| Accessing this worksheet |
|
| Levels you can select | Territory, Retailer |
| Levels used in cross tabulation | None |
| Time aggregation | Weekly |
Business Data
Same as in the Volume Tracking worksheet.