 Part 1: Validating the Model and Starting Building the UI

Based on the view WarehouseStockLevelsView, you add a bar chart to the MDOrders tab in the OrdersAndStocks page to render, for each product of a given order, the corresponding stock level in each warehouse location. The WarehouseStockLevelsView view is linked to the OrderItemsView via the productId attribute.
-
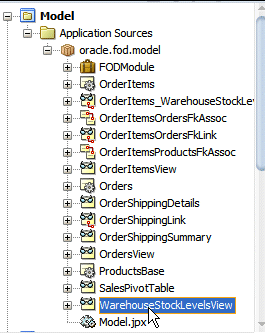
Back to JDeveloper, expand the Model | Application Sources | oracle.fod.model and double click the WarehouseStockLevelsView view to open it in the editor.
-
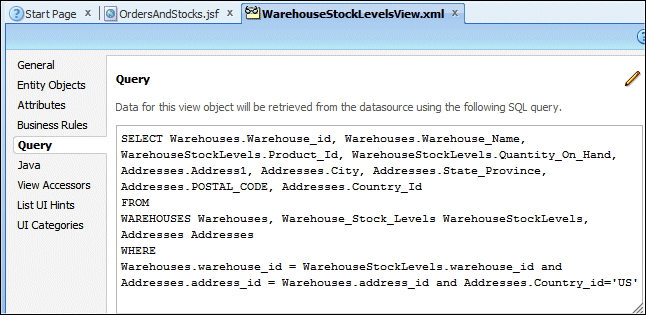
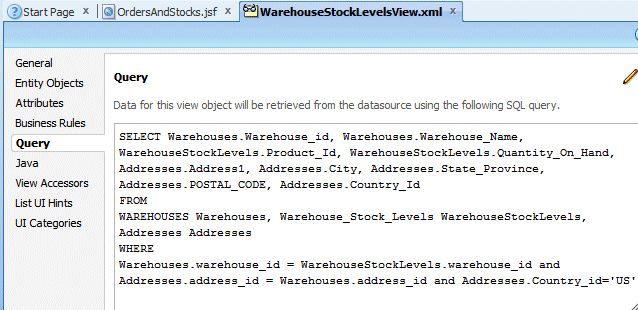
In the editor click the Query tab, to display the SQL statement. Notice that the view returns the following columns: WAREHOUSE_ID, WAREHOUSE_NAME, PRODUCT_ID, and QUANTITY_ON_HAND, for any warehouse in the US that has the product.
SELECT Warehouses.Warehouse_id, Warehouses.Warehouse_Name, WarehouseStockLevels.Product_Id, WarehouseStockLevels.Quantity_On_Hand, Addresses.Address1, Addresses.City, Addresses.State_Province, Addresses.POSTAL_CODE, Addresses.Country_Id
FROM WAREHOUSES Warehouses, Warehouse_Stock_Levels WarehouseStockLevels, Addresses Addresses
WHERE Warehouses.warehouse_id = WarehouseStockLevels.warehouse_id and Addresses.address_id = Warehouses.address_id and Addresses.Country_id='US'
-
In the editor window, click the OrdersAndStocks.jsf tab to display the page.
-
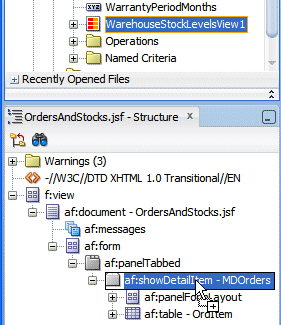
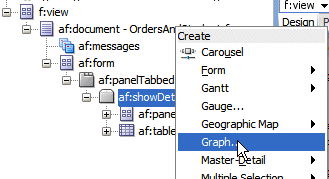
In the Data Controls panel, expand the OrdersView1 | OrderItemsView2 nodes. Select the WarehouseStockLevelsView1 node and drop it in the Structure pane within the showDetailItem - MDOrders.
-
From the Create context menu, select Graph option.
-
In the Component Gallery dialog, select the Bar one as the Category and the Bar as the Graph Type. Notice that the Quick Start Layout offers various layout in each category. Leave the default quick layout selected.
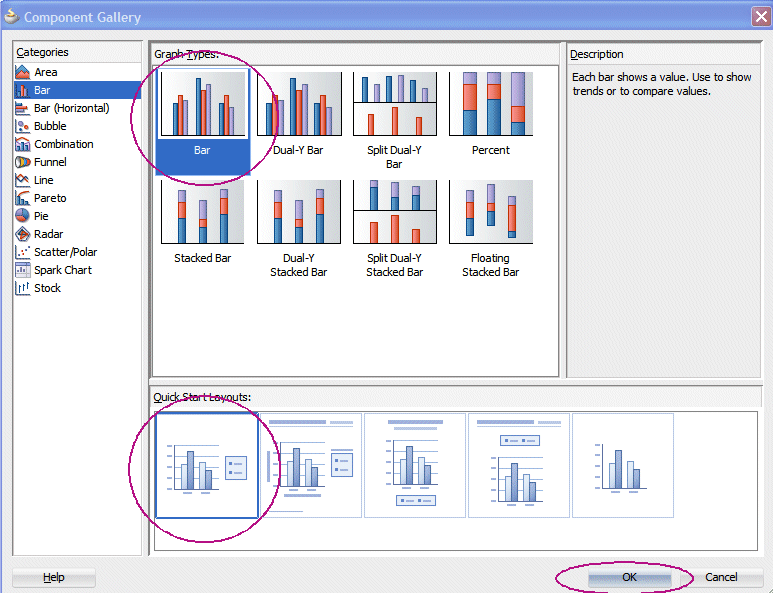
Click OK.
-
In the Create Bar Graph dialog, deselect Include Child Accessors if necessary, and then specify the following values:
- Bars : click Add and select QuantityOnHand from the Available list.
- X Axis: click Add and select WarehouseId from the drop down list.
- X Axis: click Add and select City from the drop down list.
Notice that you can also use drag and drop technique by selecting one component in the available list and dropping it into the Bars or X Axis fields.In the Attribute Labels section:
Attribute Label QuantityOnHand Quantity (type the value) WarehouseId WarehouseName ( from the drop down list) City City ( from the drop down list) 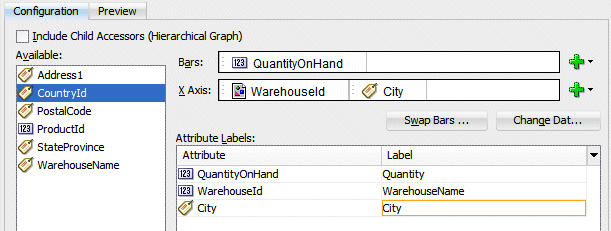
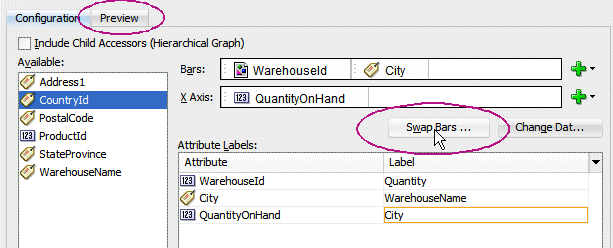
Click the Swap Bars button and then the Preview tab.
-
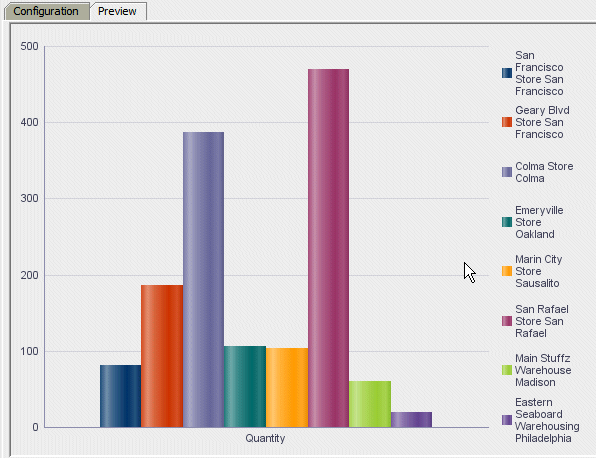
After connecting to the database a Bar chart preview displays.
Click OK.
-
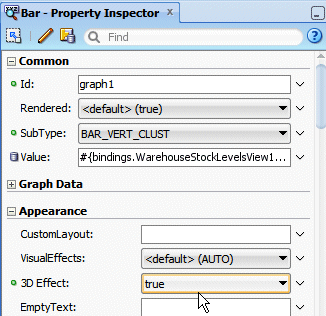
In the Property Inspector for the dvt:barGraph component, in the Appearance node, set the 3D Effect property to true.
-
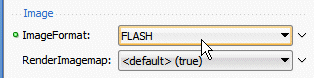
In the Image area, set the ImageFormat to Flash.
-
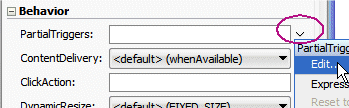
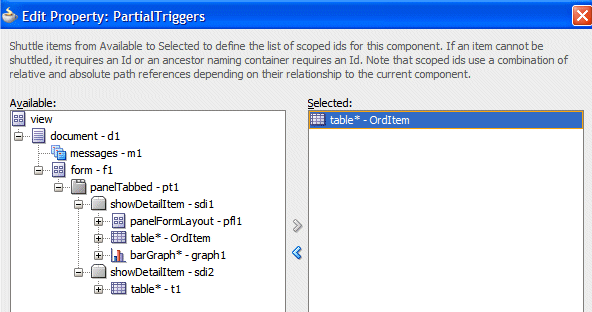
In the Behavior node, next to the PartialTriggers field, select the Edit option.
-
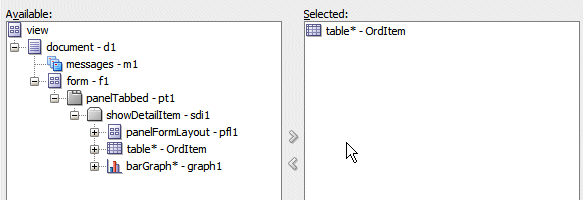
In the Edit Property dialog, shuttle table* - OrdItem to the right. This allows the Graph to become synchronized with the currently selected order item row.
Keep the window open.
-
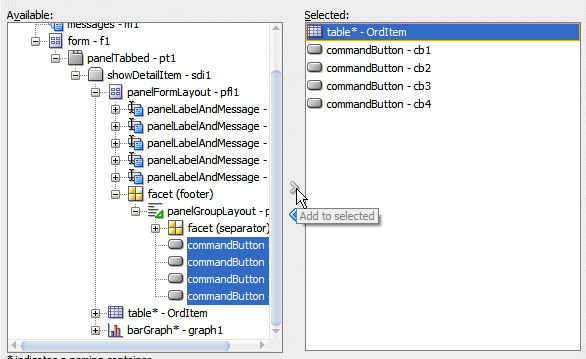
Expand the panelFormLayout | facet | panelGroupLayout nodes and shuttle all four commandButtons to the right, so that the Graph is also synchronized when you click a navigation control.
Click OK.
-
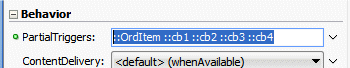
The Partial Triggers property looks now like this:
-
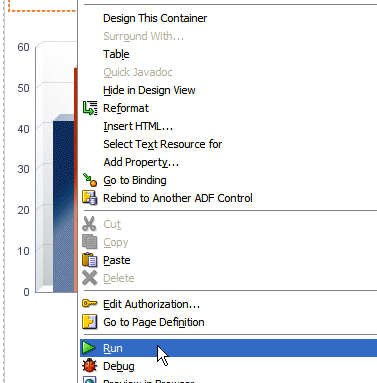
Save your work, then right-click within the page and select Run from context.
-
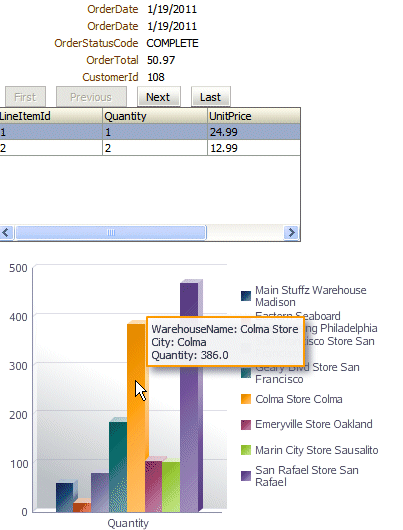
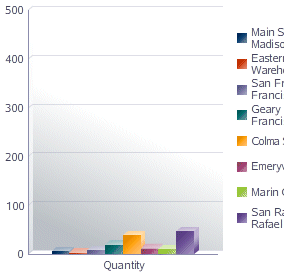
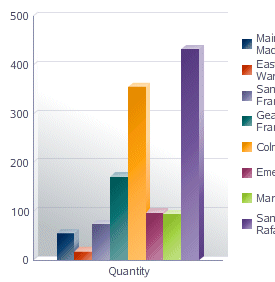
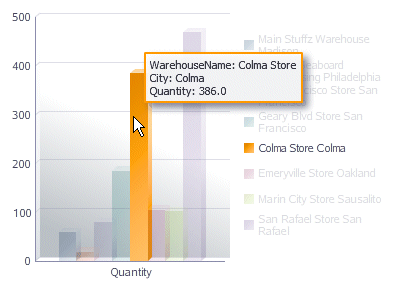
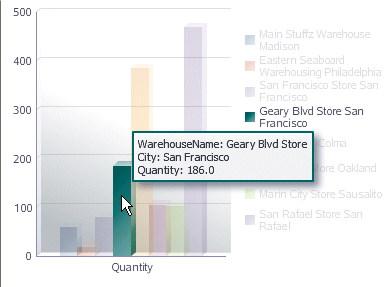
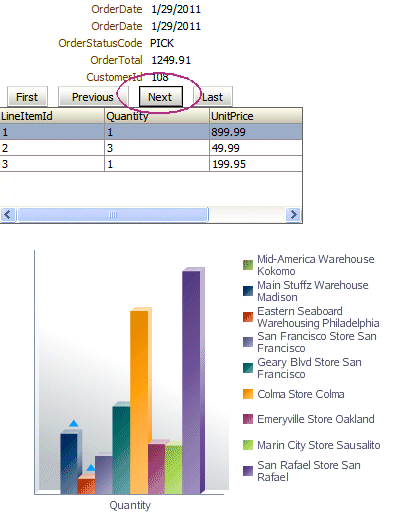
The page loads up in the Browser. Notice that for each bar, the legend on the right hand side displays the warehouse name and the city. Each bar is associated to a different color. Move the mouse over each bar to see the tooltip label (the warehouse name, city and quantity).
-
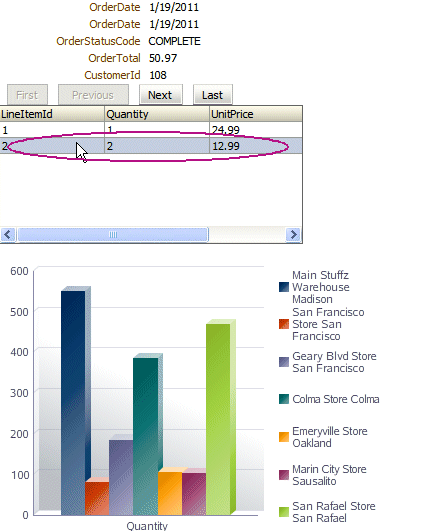
Select another row in the detail table to test the bar chart synchronization process.
-
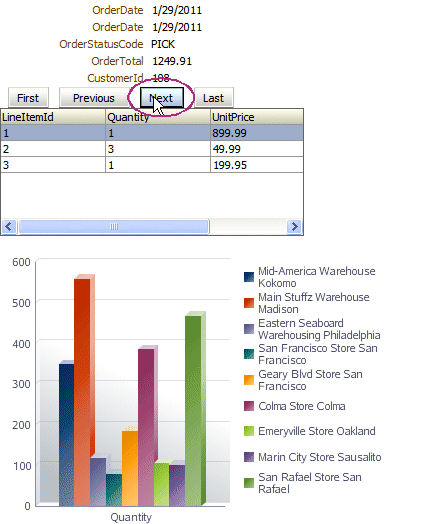
Click the Next button to test the synchronization of the bar chart when changing order.
-
Close the browser window.
In this section you enhance the bar chart by adding some animation features.
-
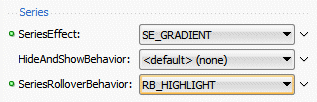
Back to JDeveloper, select the dvt:barGraph component in the Structure pane, and in the Appearance section of the Property Inspector, set the SeriesEffect to SE_GRADIENT and SeriesRolloverBehavior to RB_HIGHLIGHT.
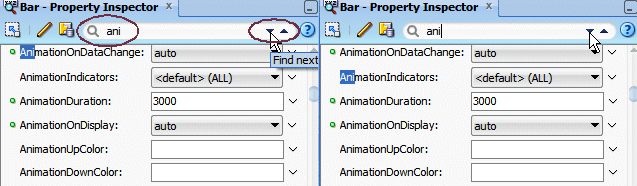
 Using the Find field to easily retrieve a property.
 Read more...
To find a specific property in the Property pane, start typing a string corresponding to the name of the property. As you type in, the first corresponding string is retrieved and highlighted. Click the Find next / Find previous buttons to navigate through the matching properties.
Read more...
To find a specific property in the Property pane, start typing a string corresponding to the name of the property. As you type in, the first corresponding string is retrieved and highlighted. Click the Find next / Find previous buttons to navigate through the matching properties.
-
In the Appearance | Animation section, set the AnimationOnDataChange to Auto, AnimationDuration to 3000 and AnimationOnDisplay to Auto.
 About animation parameters.Read more...
If animationOnDisplay is auto, then the graph will animate when it is first displayed on the page.
If AnimationOnDataChange is auto, then the graph will animate every time the data changes, which will also happen when you click on a row in the table. .
AnimationDuration indicates the duration for the animation in milliseconds. -
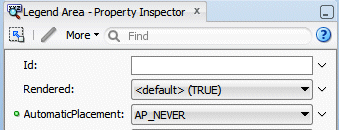
In the Structure pane, expand the dvt:barGraph, select the dvt:legend Area. Then in the Property Inspector, set the Rendered property to Default (TRUE) and the AutomaticPlacement to AP_NEVER.
-
Save you work and click the Run button
 to run the page (alternatively right-click within the page and select Run from context).
 -
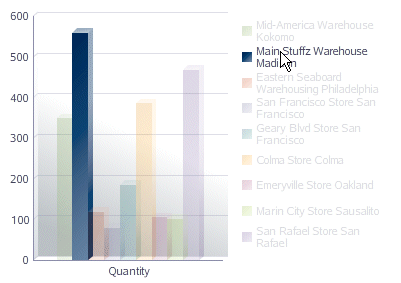
The page displays in your browser window. Notice the animation of the bars until reaching the final value position.
-
Move the mouse over a bar, notice the other bars appearing shadowed.
-
Select a different bar to change the highlighting process. Notice that the legend on the right hand side is also highlighted accordingly.
-
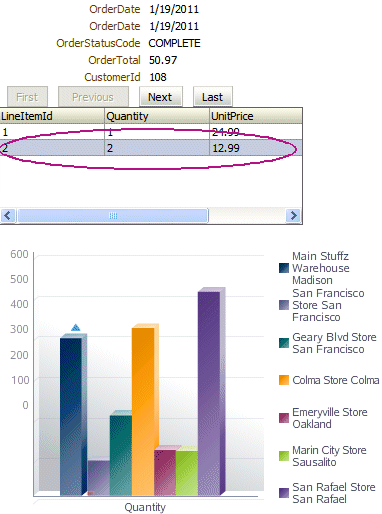
Click another row in the detail table to visualize what the stocks are for this new item. Again, notice the graph's data changes as the line item changes.
-
Click the Next button to change to a different order. The synchroziation continues.
-
You can also experiment highlighting a bar by selecting a warehouse name in the legend section.
-
Close the browser window.
Based on the view WarehouseStockLevelsView, you add a Gauge graph reflecting the stock level in each warehouse
-
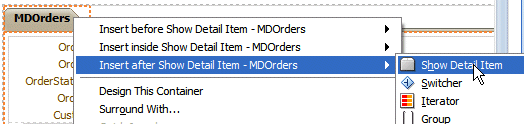
Back in JDeveloper, on the OrdersAndStocks.jsf page in the editor window, right-click within the MDOrders tab and from context select Insert after Show Detail Item --> Show Detail Item.
-
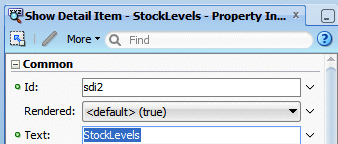
In the Property Inspector, using the Common node, set the Text to StockLevels.
-
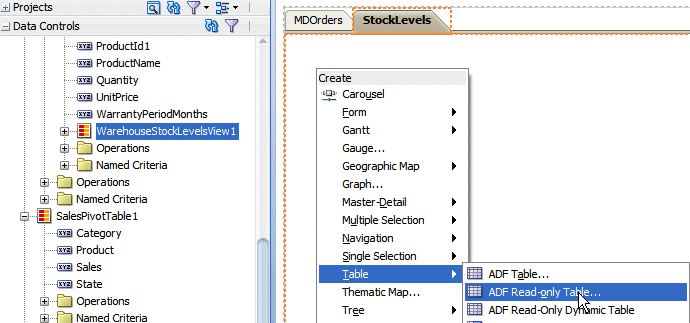
Click the StockLevels tab, then open the Data Controls accordion and select FODModuleDataControl | OrdersView1 | OrderItemsView2 | WarehouseStockLevelsView1. Drop it onto the StockLevels pane and select Table --> ADF Read-only Table.
-
In the Edit Table Column dialog, select Single Row and Enable Sorting check boxes. Delete the following attributes: WarehouseId, Address1, PostalCode.
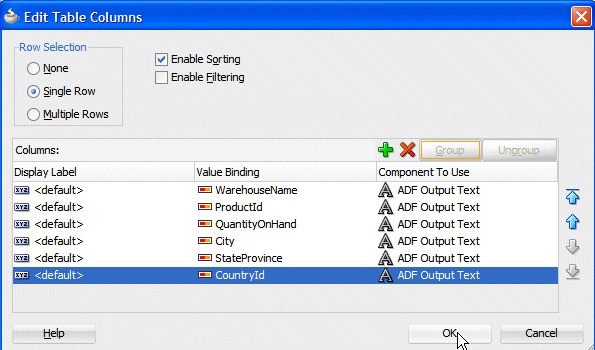
Click OK.
-
In the Property Inspector, for the table component, in the Style group, using the Layout tab
 , set the width to 600 pixels and the Height to auto.
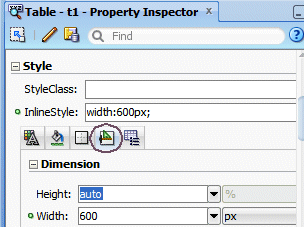
-
Using the Behavior group, click the down arrow next to the Partial Triggers field and select Edit.
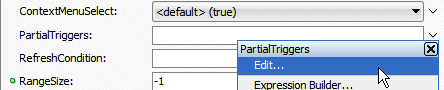
-
In the Edit Property dialog, shuttle table* - OrdItem in the Selected pane.
Click OK.
Using meaningful ids.Read more...
This is why you changed the default naming to a more meaningful one, allowing you to retrieve it easily,based on naming conventions you may adopt for your projects. -
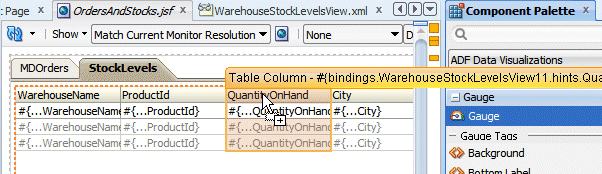
In the Component Palette, select the from the ADF Data Visualizations | Gauge library, select the Gauge component and drop it onto the QuantityOnHand column.
-
In the Create Gauge dialog, choose the Status Meter category and select the Horizontal Status Meter with Thresholds.
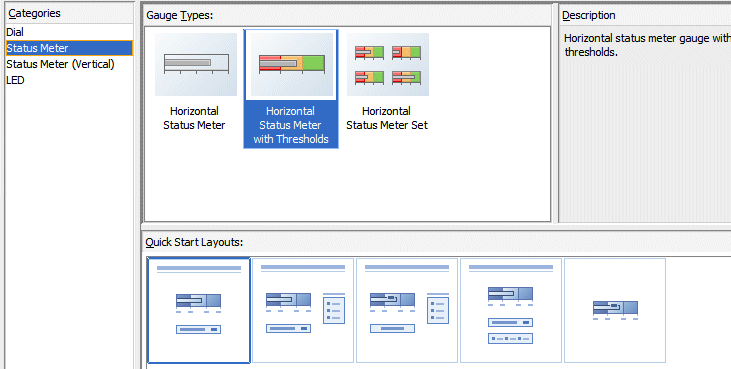
Click OK.
-
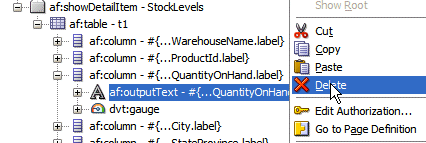
In the Structure pane, right click the outputText #{row.QuantityOnHand} and delete it.
-
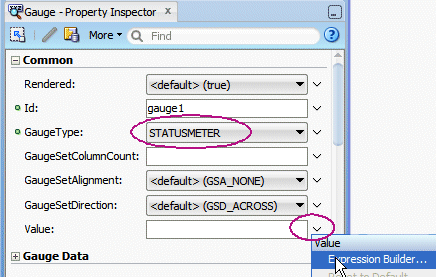
In the Structure pane, select the dvt:gauge component and in the Property Inspector, for the Common group set the Gauge type to STATUSMETER. Next to the Value field select Expression Builder from the list.
-
In the Expression Builder dialog, expand the JSP Objects | Row and double click QuantityOnHand to populate the Expression pane.
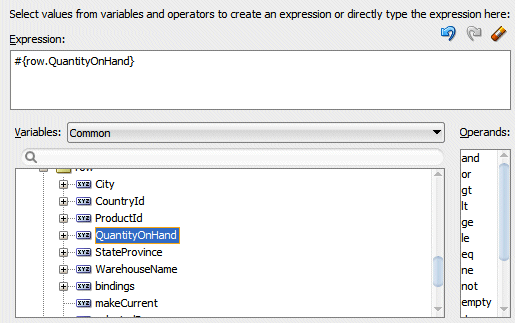
Click OK.
-
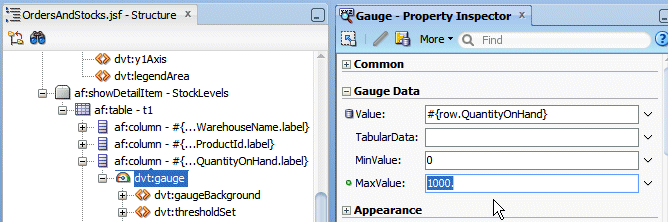
Still in the gauge component, within the Gauge Data group, type 0 for the MinValue and 1000 to the MaxValue assuming for our simple example that no stock level is ever greater that 1000 for a single product in a warehouse.
-
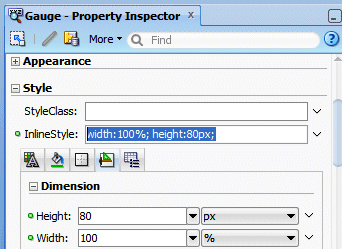
Within the Style group, type 100 Percent for the Width and 80 Pixels for the Height.
-
Select the af:column above the Gauge component in the Structure pane and in the Property Inspector, for the Appearance group set the Width to 200.
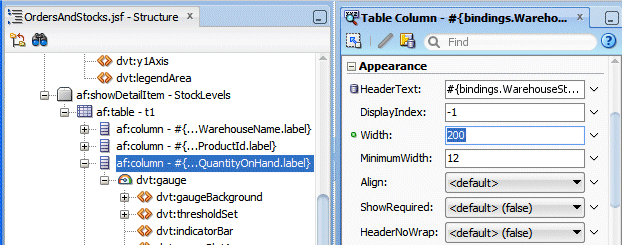
-
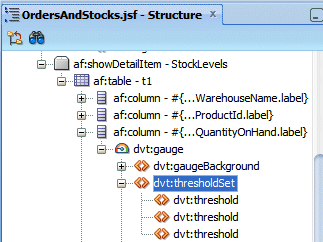
In the Structure pane expand the dvt:gauge | dvt:thresholdSet component.
 The thresholdset entry was created when choosing the Gauge type.Read more...
Notice that 3 thresholds exist inside the Threshold Set..
In the next few steps, you use the thresholds for the gauge, allowing you to specify in our example minimum and maximum stock level indicators.
-
Select the first Threshold component in the Structure pane. In the Property inspector set the id field to t00, the ThresholdMaxValue to 30, and type mini for the Text.
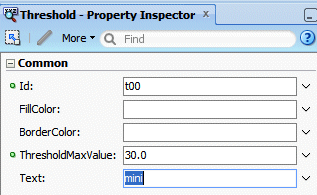 30 corresponds to the minimum stock level alert you want to set for your products.
 -
Select the second Threshold component in the Structure pane. In the Property inspector set the id field to t01, and type maxi for the Text.
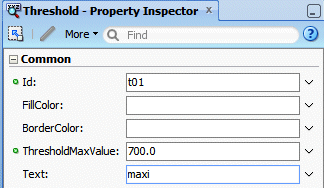 700 corresponds to the optimum stock level you want to set for your products.
 -
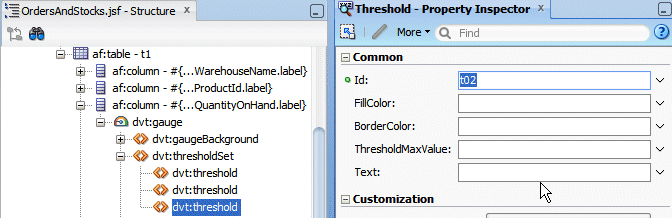
Select the the third Threshold component in the Structure pane. In the Property inspector leave the ThresholdMaxValue empty, and set the id field to t02.
-
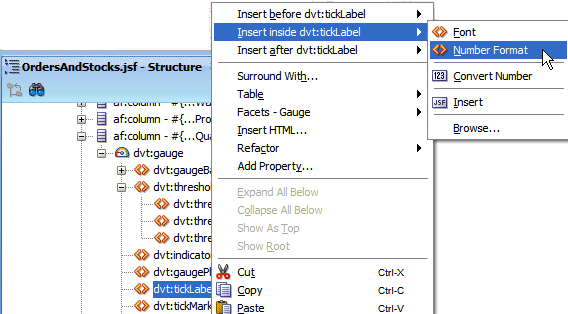
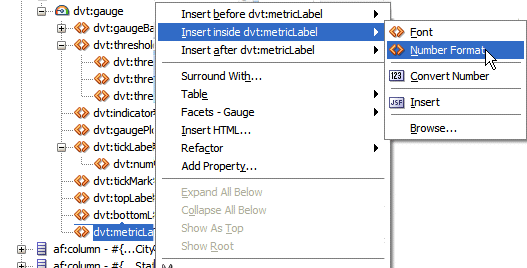
In the Structure pane right-click the tickLabel component, and select Insert inside dvt:tickLabel --> Number Format from context.
-
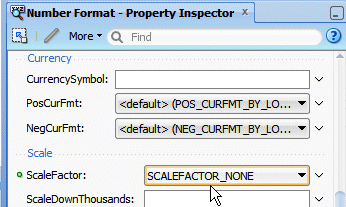
In the Property Inspector, for the Number Format tag, using the Scale group, set the ScaleFactor property to SCALEFACTOR_NONE.
-
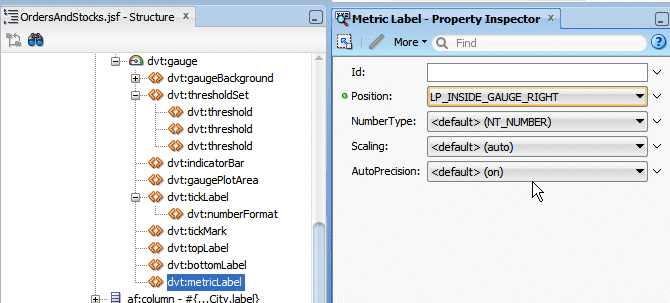
In the Structure pane select the metricLabel component. Set the Position property to LP_INSIDE_GAUGE_RIGHT.
-
In the Structure pane right click the metricLabel component, and select Insert inside dvt:metricLabel --> Number Format from context.
-
In the Property Inspector, for the Number Format tag, using the Scale group, set the ScaleFactor property to SCALEFACTOR_NONE.
-
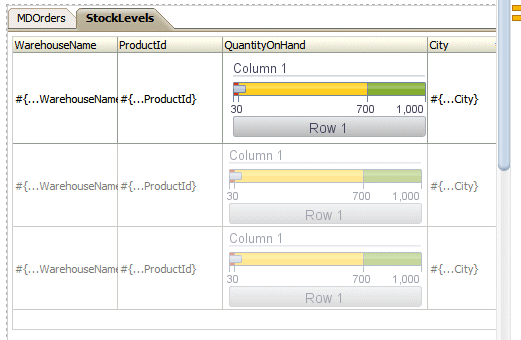
The Page should look like this:
-
Save your work and click the Run button
to run the Page. -
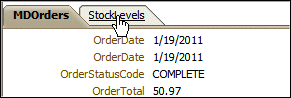
Click the StockLevels tab to display the corresponding stock levels with the Gauge.
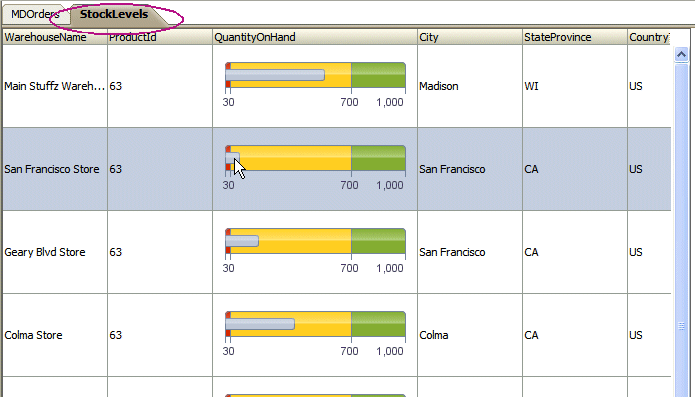 The stock level gauge shows how a product is doing in a warehouse regarding to the minimum and maximum alert levels.Read more...
The stock levels are related to the product selected in the Master Detail form.
-
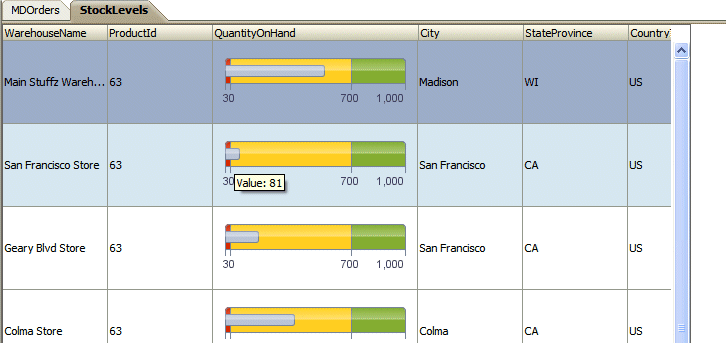
Move your mouse over a gauge to display the corresponding quantity.
-
You can experiment switching back to the MDOrders tab to select a different order and then click the StockLevels tab to display the new gauge values.
-
Close your Browser window.
You add a button to your page that exports displayed data into an Excel type file.
-
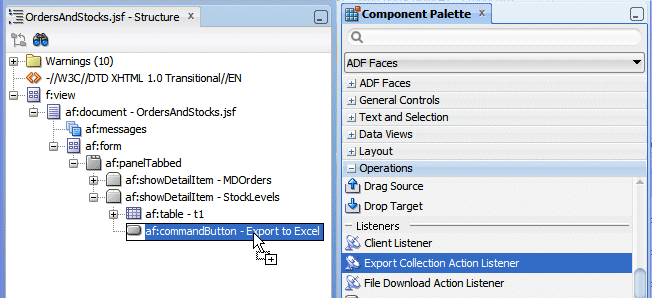
Back to the OrdersAndStocks page, add a Button and drop it onto the StockLevels component in the Structure pane.
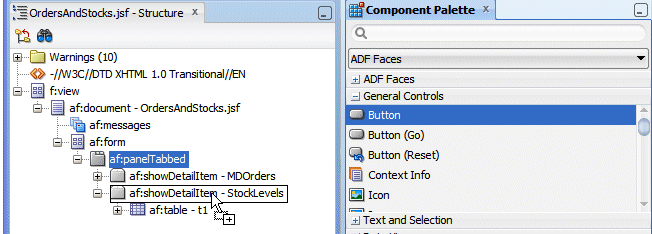
-
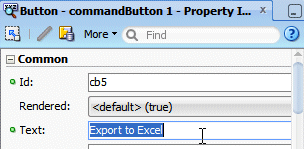
In the Property Inspector Text field, type Export to Excel.
-
From the Component Palette in the Operations library, drag and drop an Export Collection Action Listener component onto the Export to Excel button in the Structure pane.
-
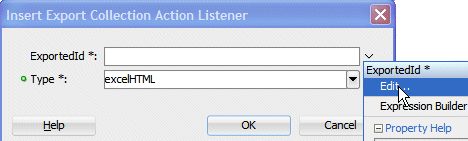
In the Insert Export Collection Action Listener dialog, next to the ExportedId field, select Edit from dropdown.
-
In the Edit Property, select table* - t1.
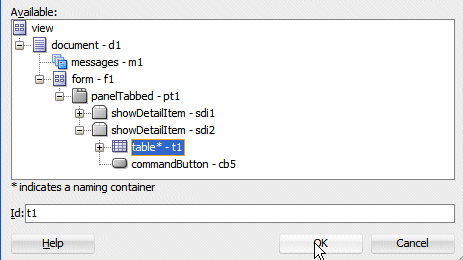
Click OK.
-
Back in the Insert Export Collection Action Listener dialog, the excelHTML should be defaulted as the type.
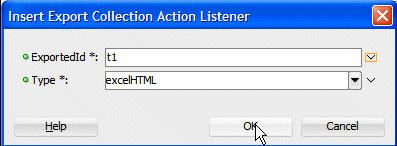
Click OK.
-
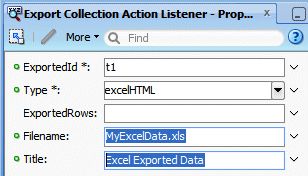
In the Property Inspector, specify MyExcelData.xls as the filename and Excel Exported Data as the title.
-
Click Save All
 icon on the JDeveloper menu bar, or select File | Save All.
 -
Click the Run button
to run the page. -
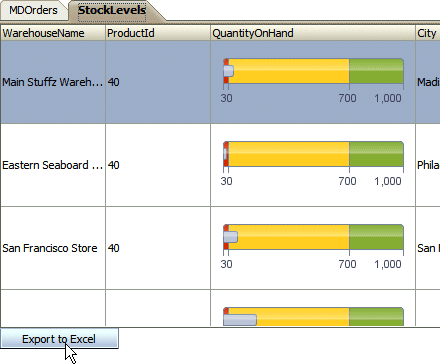
The OrdersAndStocks page opens up in the browser, click the StockLevels tab.
-
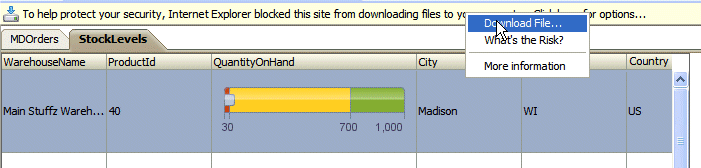
Click the Export to Excel button.
If you get a warning message about downloading files, right-click and select Download File to accept the operation.
-
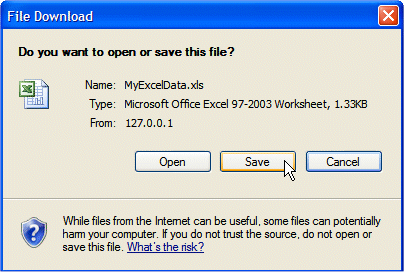
On the File Download dialog, click Save to save the file locally. (We are covering the save scenario, but you could also open the file.)
-
In the Save As dialog, choose a directory to save your file (i.e. temp). Notice that the File Name is already populated from the values specified in the Action Listener to Excel operation.
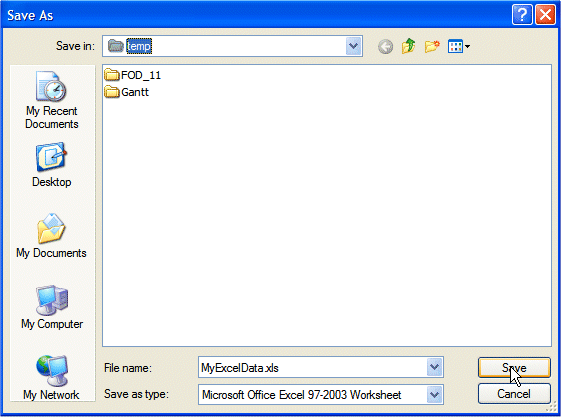
Click Save.
-
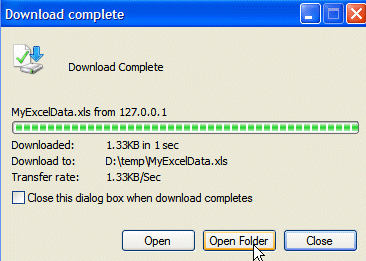
In the Download Complete dialog, click Open Folder.
-
In the opened folder, double-clik MyExcelData.xls to open the excel file.
-
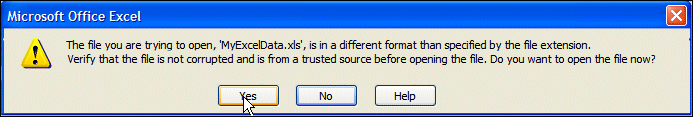
If you get an information dialog about a different format, click Yes to accept Excel to open it.
-
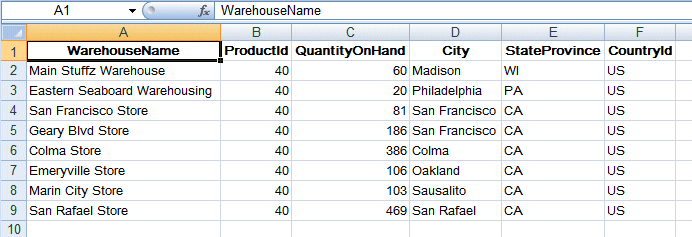
The worksheet displays the warehouse stock levels, allowing you to work in an Excel environment.
-
Close your Excel window.
-
Close your browser window.