

|
|
Web Interface Alarms Manager
|
Note - This feature may or may not be available on your system, depending on your licensing agreement.
The Web Interface Alarms Manager functions in the same manner as the Alarms Manager software, which is described in Chapter 12. However, some functions are different. This chapter describes these differences and provides additional instructions for using the Web Interface Alarms Manager. Some advanced functions, such as alarm table sorting, are not available. For additional details, see Chapter 12.
This chapter cover the following topics:
You can configure the Sun Management Center software to send an email notification if a host or agent is down. You can notify:
- Yourself only
- Several people
- All email recipients linked to the group to which the host or agent belongs
 |
To Set Up User Notification for Down Host or Agent
|
| |
1. |
In the Main Console window, select the host or group of hosts about which you want to receive notification if the host or agent is down. |
| |
|
The host information is displayed in the Contents View of the Main Console window. |
| |
2. |
Click Go to Host Details. |
| |
|
The Host Details Browser page is displayed. |
| |
|
The Host Details Alarms page is displayed. |
| |
4. |
Select Options  Modify Actions from the Options menu on the Host Details Alarms page. Modify Actions from the Options menu on the Host Details Alarms page. |
| |
|
The Alarm Actions Attribute Editor dialog is displayed (FIGURE 19-1). |

FIGURE 19-1 Attribute Editor Actions Dialog
| |
5. |
Click the Action button next to the Critical Action field or enter the email address directly in the field. |

FIGURE 19-2 Attribute Editor Alarm Actions
| |
6. |
If the Alarm Actions dialog is displayed, click the email button. |
| |
7. |
Enter the email address and username to be notified of the host down and agent down condition in the To: field. |
| |
|
To notify more than one person, use the format email username1, username2, and so on. |
| |
8. |
Enter the appropriate text in the Subject and Message fields. |
| |
9. |
Click OK to close the Attribute Editor Alarm Actions dialog. |
| |
|
The email address(es) are displayed in the Critical Action field of the Attribute Editor Actions dialog. |
| |
10. |
Click OK to accept your changes. |
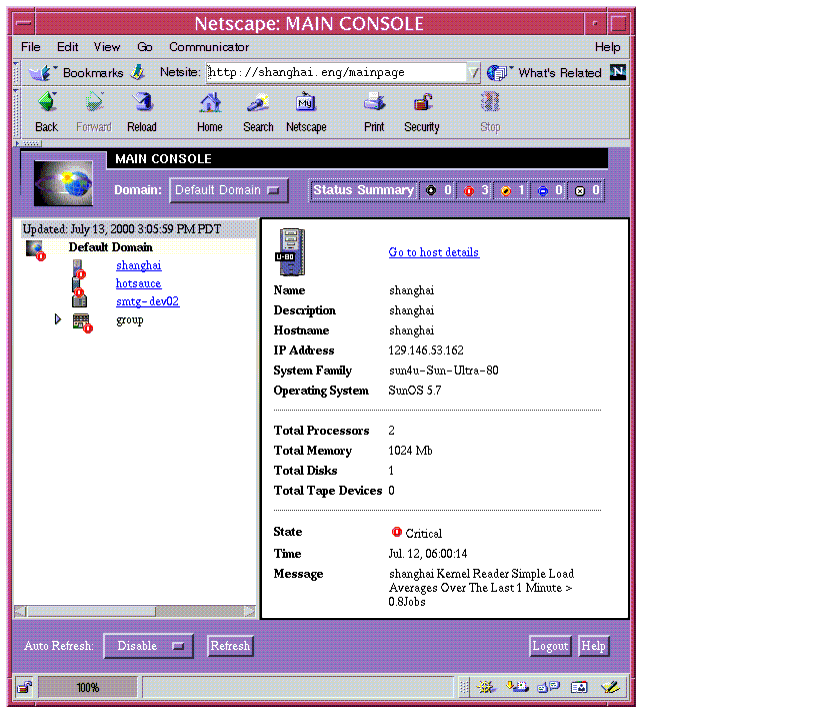
The Status Summary panel on the Main Console page displays the number of managed objects in the selected domain that have at least one unacknowledged open alarm of a specific severity. This panel is similar to the Domain Status Summary described in Chapter 12, except that the icons are not buttons so they do not display the Domain Status window.

FIGURE 19-3 Main Console Default Domain with Status Summary Panel
 |
To View the Status Summary Panel
|
| |
1. |
Go to the Sun Management Center Login Page from your Web Browser. |
| |
2. |
Log into the Sun Management Center 3.0. |
| |
|
The Sun Management Center 3.0 Main Console Default Domain is displayed. |
Note - Select Domain domainname if you want to see a Status Summary for another domain.
Alarms information is displayed in the alarms table (FIGURE 19-6) on the Host Details Alarms page. For additional details, see Chapter 12.
 |
To View Alarm Information
|
| |
1. |
With the left mouse button, click on a host icon in the Main Console window. |
| |
|
The Host Description and Status are displayed in the Contents View of the Main Console page. |

FIGURE 19-4 Main Console Contents View With "Go to Host Details" Hyperlink
| |
2. |
Click on "Go to Host Details." |
| |
|
The Host Details Browser page is displayed. |

FIGURE 19-5 Host Details Browser Page
| |
3. |
Click on the Host Details Alarms tab. |
| |
|
The Host Details Alarms page (FIGURE 19-6) is displayed. |

FIGURE 19-6 Host Details Alarms Page
Alarm Categories
The Host Detail Alarms page presents a table of different categories of detailed alarm information. Except for the first column (TABLE 19-1), the categories and information are the same as those described in TABLE 12-2 and TABLE 12-3.
TABLE 19-1 Alarm Selection Column
Category
|
Description
|
|---|
|
-
|
Selects the alarm row. You can select multiple alarm rows by holding down the Control key and clicking in this column. a check mark indicates that the column is selected.
|

FIGURE 19-7 Host Details Alarms Page Additional Alarm Information
Some of this information is always displayed in the alarms table (FIGURE 19-6). Additional information (FIGURE 19-7) is displayed on the bottom of the page when an alarm row is selected. This information is only displayed for closed and/or acknowledged alarms.
 |
To View Additional Alarm Information
|
Note - Only one alarm can be viewed at aa time.
| |
1. |
Click the first column of the alarm you want to view. |
| |
|
A check mark is displayed in the first column, |
| |
2. |
Select Options  View Additional Information on the Host Details Alarms page. View Additional Information on the Host Details Alarms page. |
| |
|
The information about the acknowledged and closed alarm is displayed at the bottom of the page. |
Alarms Table Page Navigation
The alarms table navigation information and buttons are the same as those described in TABLE 12-1.
Alarm Actions
An additional button on the Host Details Alarms page, Auto Refresh, allows you to refresh the alarms table automatically, or turn off (disable) the automatic refresh capability to allow you to edit the alarms. When Auto Refresh is enabled, all operation buttons and the selection column are disabled.
The alarms table cannot be sorted by double-clicking on the headers. Otherwise, all Alarm actions on the Host Details Alarms page function the same as those on the Alarms Details page described in Chapter 12. A confirmation request is displayed when you delete an alarm or alarms.

FIGURE 19-8 Alarm Deletion Confirmation Request


Copyright © 2000 Sun Microsystems, Inc. All Rights Reserved.


 Modify Actions from the Options menu on the Host Details Alarms page.


 View Additional Information on the Host Details Alarms page.


