Example Procedures
The following procedures provide examples of typical data property tasks.
 To Monitor Directory Size
The following example procedure uses the Directory Size Monitoring module. This module enables you to monitor the size and size change rate of a directory and its subdirectories. If this module is not loaded, see To Load a Module.
-
In the Browser Details window, double-click the Operating System icon in the hierarchy (tree) view.
The operating system modules are displayed in both the hierarchy and topology views.
-
Double-click the Directory Size Monitoring icon in the topology view, or click the expansion icon next to the Directory Size Monitoring icon in the hierarchy view.
The Directory Size Monitoring Status folder is displayed.
-
Double-click the Directory Size Monitoring Status folder in either the hierarchy or the topology view.
The Directory Monitoring property table is displayed.
-
Add a row to the table in one of the following ways:
-
Press mouse button 1 in a table row or column header, and choose New Row from the pop-up menu.
-
Select the table. Then choose New Row from the Options icon menu.
The Row Adder window is displayed.
-
-
Type the appropriate information in the text fields.
-
To add the row to the table and close the Row Adder window, click the OK button.
The added row is displayed in the topology view.
 To Add a Row to a Data Property Table
Note –
You can use the steps in this procedure to add a row to the Directory Size Monitoring, File Monitoring, File Scanning, and Process Monitoring modules.
The following example procedure uses the File Monitoring module which enables you to monitor a file's size, modification date, and rate of growth. If this module is not loaded, see To Load a Module.
-
In the Browser Details window, double-click the Operating System icon in the hierarchy (tree) view.
The operating system modules are displayed in both the hierarchy and topology views.
-
Double-click the File Monitoring icon in the topology view, or click the expansion icon next to the File Monitoring icon in the hierarchy view.
The File Monitoring Status folder is displayed.
-
Double-click the File Monitoring Status folder in either the hierarchy or the topology view.
An empty property table is displayed.
-
Add a row to the table in either of the following ways:
-
Press mouse button 3 in a table row or column header, and choose New Row from the pop-up menu.
-
Select the table. Then choose New Row from the Options icon menu.
The Row Adder window is displayed.
-
-
Type the appropriate information in the text fields.
Note –This example shows the fields for the File Monitoring module. Fields differ depending on the module that you are modifying.
-
Name is a unique name for this instance of the File Monitoring module.
The name should be a single word that might contain alphanumeric characters and an underscore (_).
-
Description is a text description for this particular instance.
-
Filename is the complete path to the file that you want to monitor.
-
-
To add the table row and close the Row Adder window, click the OK button.
The added row is displayed in the topology view.
 To Add a Printer to Be Monitored
The Print Spooler module enables you to monitor the status of the printer daemon, print queues, and other printer devices on your network. The following example procedure uses the Print Spooler module. If this module is not loaded, see To Load a Module.
-
In the Details window with the Module Browser tab selected, double-click the Local Applications icon in the hierarchy (tree) view.
The local applications modules are displayed in both the hierarchy and topology views.
-
Double-click the Print Spooler icon in either the hierarchy or the topology view.
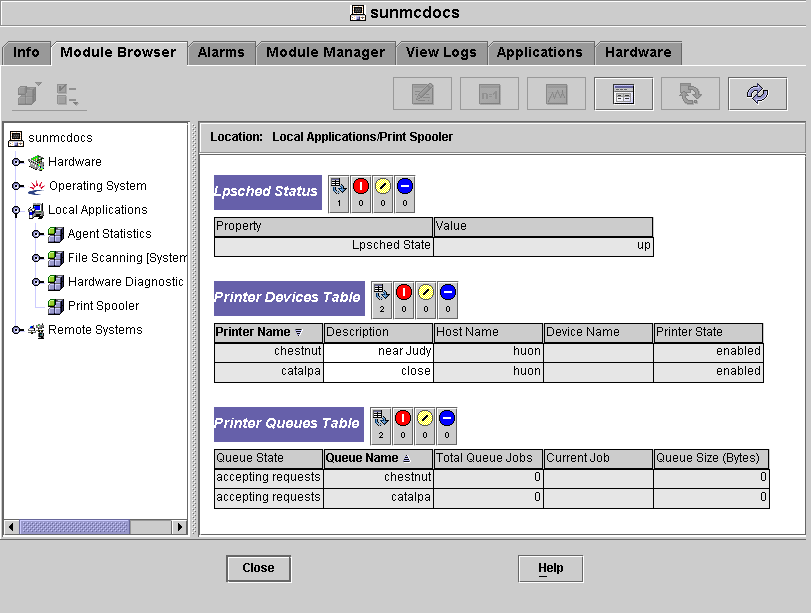
Three property tables are displayed: Lpsched Status, Printer Devices Table, and Printer Queues Table.
Figure 8–1 Print Spooler Property Tables

-
Add a printer device row to the table in either of the following ways:
-
Press mouse button 3 in the Printer Devices table row, and choose the New Row command from the pop-up menu.
-
Click the Printer Devices table, and choose New Row from the Options pop-up menu at the top left of the Details window.
The Add Row window is displayed.
-
-
Type the name of the printer and a description for the printer in the appropriate fields.
-
To add the printer to the table and close the Add Row window, click the OK button.
The added row is displayed in the topology view.
 To Probe a Property
This example procedure explains how to probe a property in the Directory Size Monitoring module. If you have not done so already, load this module by following the procedure To Load a Module.
-
In the Browser Details window, double-click the Operating System icon in the hierarchy (tree) view.
The operating system modules are displayed in both the hierarchy and topology views.
-
Double-click the Directory Size Monitoring icon in the topology view, or click the expansion icon next to the Directory Size Monitoring icon in the hierarchy view.
The Directory Monitoring Status folder is displayed.
-
Double-click the Directory Monitoring Status folder icon in either the hierarchy or the topology view.
The monitored data properties are displayed in a property table.
-
List or recursively list files in either one of the following ways:
-
Press mouse button 3 in the Directory Monitoring table row and choose the List Files or Recursively List Files command from the pop-up menu.
-
Click the Probe icon, select the appropriate command in the Probe Select dialog box, and click the OK button.
A window appears that displays the files.
-
- © 2010, Oracle Corporation and/or its affiliates
