| C H A P T E R 9 |
|
Managing the Host Using the WebGUI |
This chapter describes how to view the state of the host, and how to manage it using the WebGUI.
It contains the following sections:
1. Log in to the WebGUI as described in Section 4.2, Logging In to the WebGUI.
2. Select Remote Control => Remote Power Control.
The Server Power Control page appears.
FIGURE 9-1 Server Power Control Page
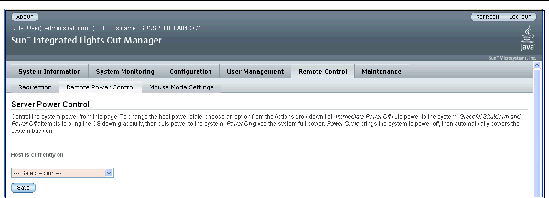
3. To change the power status of the server, select an action from the drop-down list.
4. Click OK in the confirmation dialog to implement your selection.
This section describes how to view detailed information about the Sun server replaceable components, sometimes referred to as field-replaceable units (FRUs) and customer-replaceable units (CRUs).
Depending on the component you select, information about the manufacturer, component name, serial number, and part number might be displayed.
Some components are hot-swappable, meaning that you can remove them from the system without warning or preparation.
Other components are hot-pluggable, meaning that they can be removed while the system is running, but the system must be prepared first.
Some hot-pluggable components can be prepared for removal using the Components Management page. Those components display a radio button in the left-hand column of the Component Management page (FIGURE 9-2).
Still other components require the system to be shut down before they can be removed.
|
Note - The data shown in FIGURE 9-2 and FIGURE 9-3 are examples only. The actual data you see might be different on your platform. For details, see your platform supplement. |
1. Log in to the ILOM as administrator or operator.
2. Select System Information => Components.
The Component Management page appears.
FIGURE 9-2 Sample Repleacable Component Page
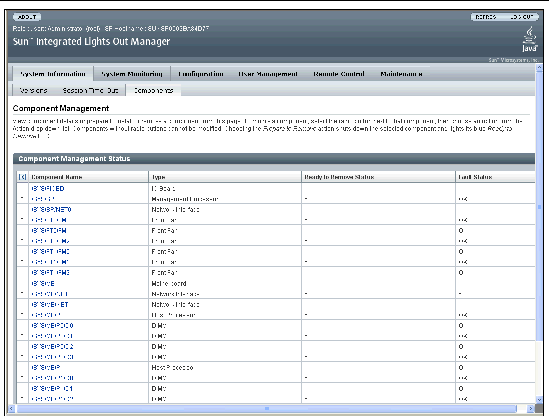
3. Click a component for detailed information about it.
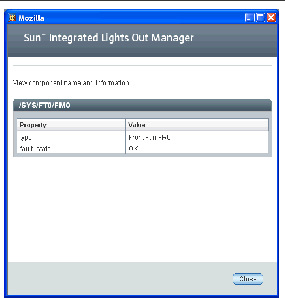
Detailed information about the selected component appears.
FIGURE 9-3 Sample Component Details View
4. To prepare a hot-pluggable component for removal, click the corresponding radio button.
|
Note - Most components are either hot-swappable (can be removed without preparation), or you must shut down the system to remove them. For these components, there is no radio button. |
The system prepares the component for removal, then displays its status in the Ready to Remove Status column.
For a detailed list of components, see your platform supplement.
This section describes how to view the temperature, voltage, and fan sensor readings.
The system is equipped with a number of sensors that measure voltages, temperatures, and other settings. ILOM polls the sensors and posts an event in the sensor event log (SEL) when they cross a threshold.
For details on individual sensors, see your platform supplement.
If an event crosses a threshold defined in the Alert Destinations view, it generates an alert, which is sent to the destination configured in Section 9.5, Managing Alerts.
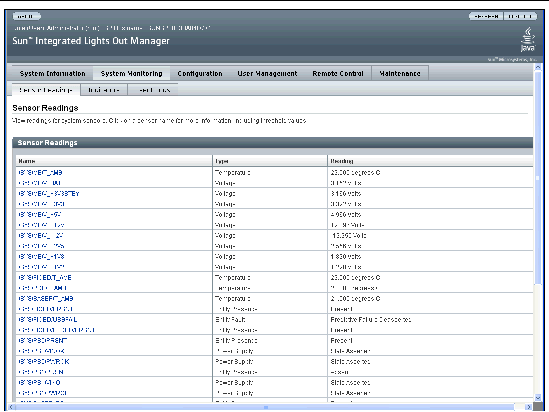
The thresholds appear in the Sensor Readings view shown in FIGURE 9-4.
1. Log in to the ILOM as administrator or operator.
2. Select System Monitoring => Sensor Readings.
The Sensor Readings page appears.
|
Note - The sensor displays in this section are examples. The sensor names, ranges, and functions might be different on your system. For details, see your platform supplement. |
|
Note - If the server is powered off, many components will appear as "no reading." To power it on, see Section 9.1, Controlling Power to the Host Server. |
FIGURE 9-4 Sample Sensor Readings Page
3. Scroll down the list to find the sensor you wish to view.
4. To see details about a particular sensor, click its name.
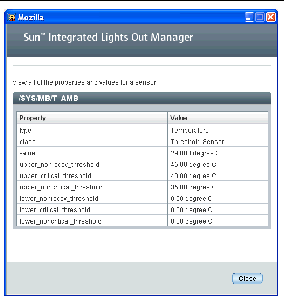
The details view appears. This view provides detailed information about the sensor, such as thresholds.
FIGURE 9-5 Sample Sensor Details View
|
Note - The sensors shown in FIGURE 9-4 and FIGURE 9-5 are examples only. The actual sensor names, ranges, and functions might be different on your platform. For details, see your platform supplement. |
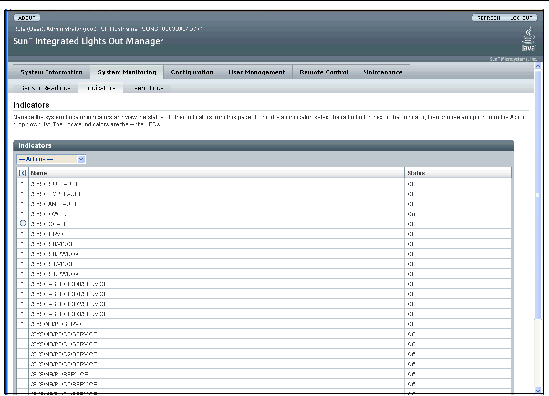
The Indicators view shows the state of the LEDs in the system.
1. Log in to the ILOM as administrator or operator.
2. Select System Monitoring => Indicators.
The Indicators display appears.
FIGURE 9-6 Sample Indicators Page
|
Note - The sensors shown in FIGURE 9-6 are examples only. The actual sensor names, ranges, and functions might be different on your platform. For details, see your platform supplement. |
3. Use the scrollbar to view the list.
4. To toggle the state of the locate LED:
a. Click the radio button next to /SYS/LOCATE.
b. Select a state from the drop-down menu.
The states are Turn LED Off or Set LED to Fast Blink.
The locate LED changes states, and the new state appears in the Status column.
This section describes how to view alert destinations and configure alert settings for the ILOM.
The alert management view allows you to map alert levels to destinations (IP addresses). For example, you can configure it so that all critical alerts are sent to one destination and all non-recoverable alerts are sent to another.
An alert is generated when a sensor crosses the specified threshold. For example, if you configure an alert for critical thresholds, the ILOM sends an IPMI trap to the specified destination when any sensor crosses the upper or lower critical (CT) threshold. A special criteria, informational, is reserved for system events that are not related to sensors.
The mapping between alert levels and sensors is:
All alerts are IPMI PET traps, as defined in the Intelligent Platform Management Interface (IPMI) v2.0. A special criteria, informational, is reserved for system events that are not related to sensors.
Each line in the alert management view is called a "rule". Each rule identifies an alert level and sends all alerts at that level to the specified IP address.
|
Note - Because there are four alert levels and 15 alert rules, you can configure the system to send the same level of alert to multiple destinations. |
Users with operator privileges can view the alert settings. Changing them requires administrator privileges.
1. Log in to the ILOM as administrator or operator
2. Select Configuration => Alert Management.
The Alert Settings page displays a list of alerts.
FIGURE 9-7 Alert Destination Page
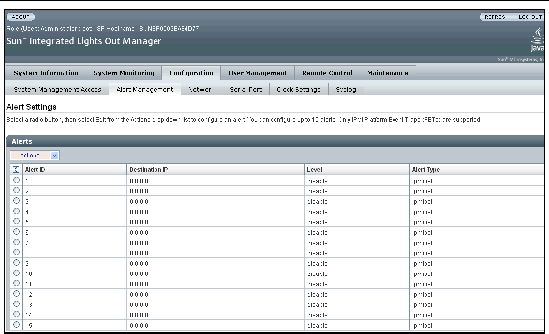
The alert table includes five columns:
Configuring an alert requires administrator privileges.
1. Select a radio button for an alert in the table.
2. Select Edit from the drop-down menu.
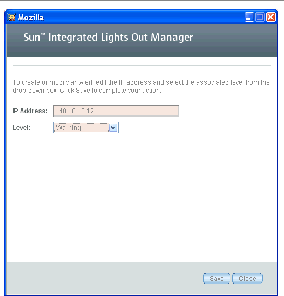
3. Type the destination IP address for the alert.
4. Select an event severity from the drop-down menu.
The modified alert appears in the Alert Destinations table.
This section describes how to view and clear the system event log (SEL).
The system event log accumulates various events, including administration changes to the ILOM, software events, and warnings and alerts. It also accumulates events from the IPMI log.
1. Log in to the ILOM as administrator or operator.
2. Select System Monitoring => Event Logs.
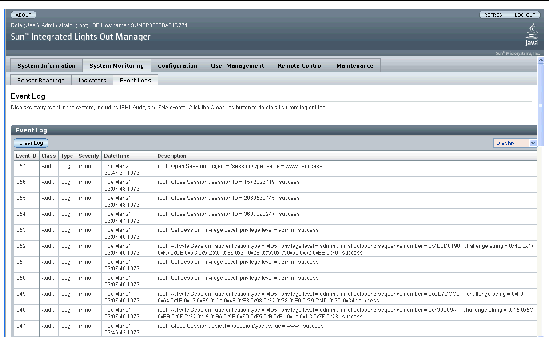
The System Event Logs page appears.
FIGURE 9-9 System Event Log Page
3. Use the Display drop-down menu to determine how many events to display.
Selecting a larger number might cause the WebGUI to respond more slowly.
The WebGUI displays the most recent events first. To see later events, select a larger number.
4. Use the scrollbar to scroll through the list.
The fields in the Event Log table are described in TABLE 9-3.
5. To clear the event log, click Clear Event Log.
A confirmation dialog box appears.
6. Click OK to clear all entries in the log.
The SEL time stamps are related to the ILOM clock settings. If the clock settings change, the change is reflected in the time stamps.
When the ILOM reboots, the ILOM clock is set to Thu Jan 1 00:00:00 UTC 1970. The ILOM reboots as a result of the following:
After an ILOM reboot, the ILOM clock is changed by the following:
To set the ILOM clock, see Section 6.3, Setting the ILOM Clock.
This section describes how to view the ILOM hardware and firmware revisions, as well as the Intelligent Platform Management Interface (IPMI) version.
1. Log in to the ILOM as administrator or operator.
2. Select System Information => Versions.
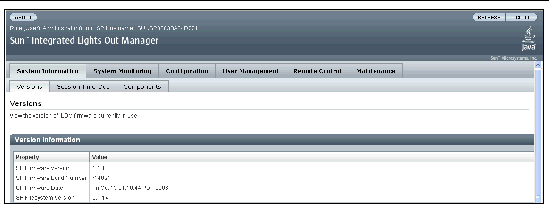
The Version Information page appears (see FIGURE 9-10). This page displays the ILOM hardware and software revisions.
FIGURE 9-10 Version Information Page
Copyright © 2007, Sun Microsystems, Inc. All Rights Reserved.