| Sun ONE Application Server 7 Performance Tuning Guide |
Chapter 4
Tuning Sun ONE Application ServerThis chapter describes some ways to tune the Sun ONE Application Server for optimum performance. It is separated into the following sections:
HTTP Server TuningMonitoring and tuning the HTTP server instances that handle client requests are important parts of ensuring peak Sun ONE Application Server performance. This section covers the following topics related to HTTP Server Tuning:
Enabling Statistics with stats-xml
Users must enable statistics with stats-xml when they wish to use existing monitoring tools like perfdump or create similar customized tools.
To enable the statistics using stats-xml, follow these steps:
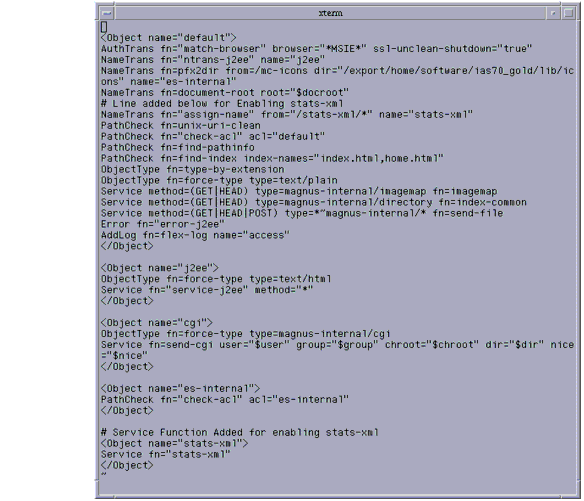
- Under the default object in obj.conf, add the following line:
NameTrans fn="assign-name" from="/stats-xml/*" name="stats-xml"
- Add the following Service function to obj.conf:
<Object name="stats-xml">
Service fn="stats-xml"
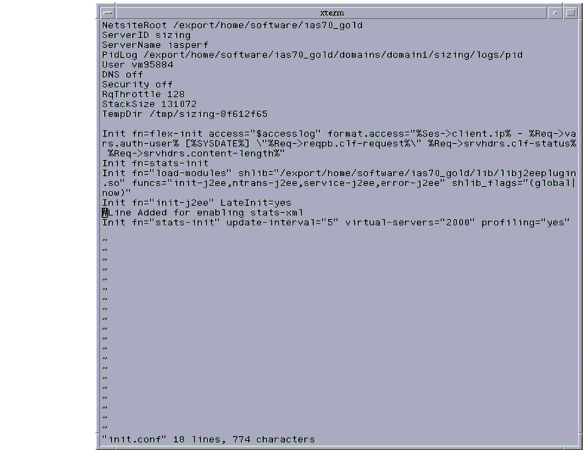
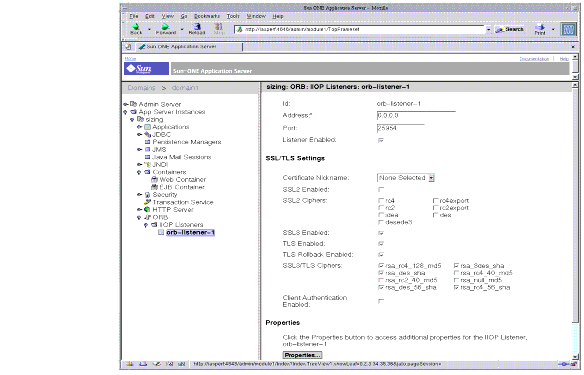
</Object>The following figure shows a sample init.conf which has stats-init Server Application Function (SAF) included.
Figure 4-1 statsxml-obj in <instancename>-obj.conf
- Add the stats-init Server Application Function (SAF) to init.conf
The above example shows you can also designate the following:
- update-interval. The period in seconds between statistics updates. A higher setting (less frequent) will be better for performance. The minimum value is 1; the default value is 5.
- virtual-servers. The maximum number of virtual servers for which you track statistics. This number should be set equal to or higher than the number of virtual servers configured. Smaller numbers result in lower memory usage. The minimum value is 1; the default is 1000.
- profiling. Enable NSAPI performance profiling. The default is "no" which results in slightly better server performance.
For more information on editing the configuration files, see the Sun ONE Application Server NSAPI Programmer's Guide.
Monitoring Current Activity Using the perfdump Utility
The perfdump utility is an SAF built into Sun ONE Application Server. It collects various pieces of performance data from the Application Server internal statistics and displays them in ASCII text. The perfdump utility allows you to monitor a greater variety of statistics.
Installing the perfdump Utility
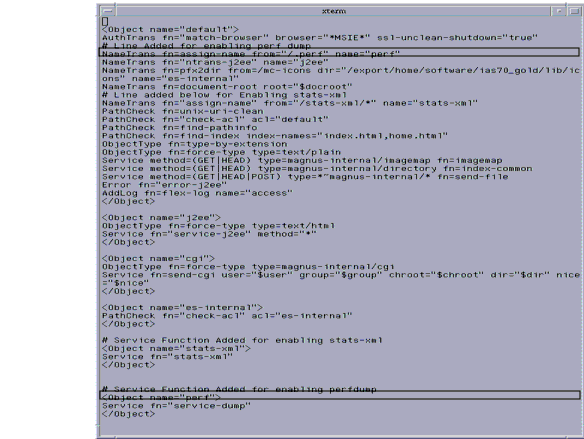
The following figure provides a sample of the <instancename>-obj.conf file with the perfdump utility configured.
Figure 4-3 Sample <instance-name>-obj.conf file with perfdump Configured
To install perfdump, you need to make the following modifications in <instancename>-obj.conf file:
- Add the following object to your <instancename>-obj.conf file after the default object:
<Object name="perf">
Service fn="service-dump"
</Object>- Add the following to the default object:
NameTrans fn=assign-name from="/.perf" name="perf"
- If not already enabled, enable stats-xml.
If you need to enable stats-xml, see “Enabling Statistics with stats-xml”.
- Restart your server software.
- Access perfdump by entering this URL:
http://yourhost/.perf
- You can request the perfdump statistics and specify how frequently (in seconds) the browser should automatically refresh. This example sets the refresh to every 5 seconds:
http://yourhost/.perf?refresh=5
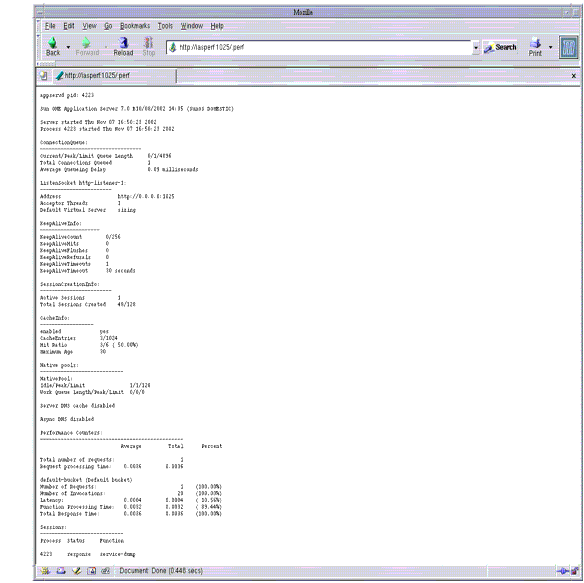
The following figure shows a sample perfdump output.
Figure 4-4 Sample perfdump Output
For more information on editing the configuration files, see the Sun ONE Application Server Developer’s Guide to NSAPI.
Using Statistics to Tune Your Server
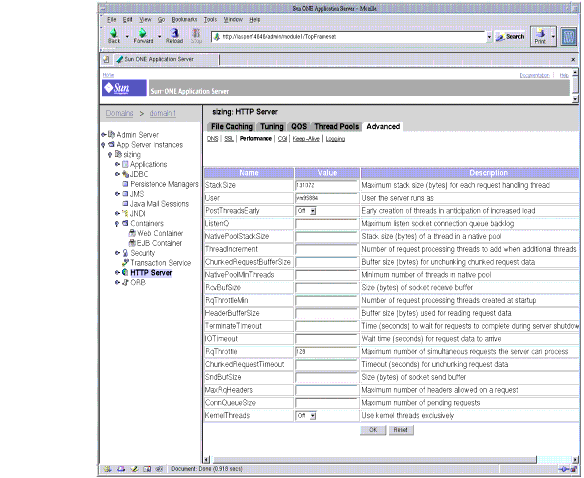
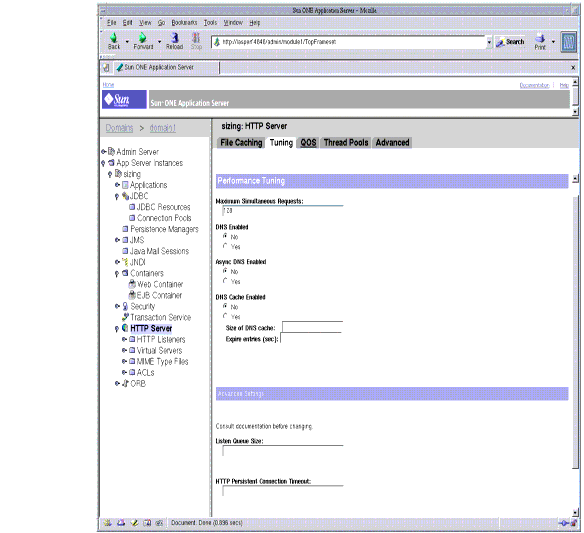
This section describes the information available through the perfdump utility and discusses how to tune some parameters to improve your server's performance. The default tuning parameters are appropriate for all sites except those with very high volume. The only parameters that large sites may regularly need to change are RqThrottle, MaxKeepAliveConnections, and KeepAliveTimeout, which can be tuned by using the web-based Administration interface or by directly editing the <instancename>-obj.conf file. The following figure shows the Administration interface for tuning the HTTP Server.
Figure 4-5 Performance Tuning the Server using the Administration Interface
The perfdump utility monitors statistics in the following categories:
Connection Queue Information
Connection queue information shows the number of sessions in the queue, and the average delay before the connection is accepted.
Following is an example of how these statistics are displayed in perfdump:
ConnectionQueue:
---------------------------------
Current/peak/limit queue length 0/48/5000
Total connections queued 3753
Average queueing delay 0.0013 seconds
Current /peak /limit
Current/peak/limit queue length shows, in order:
Tuning
If the peak queue length is close to the limit, you may wish to increase the maximum connection queue size to avoid dropping connections under heavy load.
You can increase the connection queue size by:
- Setting or changing the value of ConnQueueSize from the web-based Administration interface. Follow the path http-server-Advanced-performance.
- Editing the ConnQueueSize directive in init.conf.
Total Connections Queued
Total connections queued is the total number of times a connection has been queued. This includes newly accepted connections and connections from the keep-alive system.
This is a gathered statistic and is not tunable.
Average Queuing Delay
Average queueing delay is the average amount of time a connection spends in the connection queue. This represents the delay between when a request connection is accepted by the server, and a request processing thread (also known as a session) begins servicing the request.
This is a gathered statistic and is not tunable.
HTTP Listener Information
The HTTP listener information includes the IP address, port number, number of acceptor threads, and the default virtual server for the HTTP listener. For tuning purposes, the most important field in the HTTP listener information is the number of acceptor threads.
You can have many listeners enabled for virtual servers, but you will at least have one (usually http://0.0.0.0:80) enabled for your default server instance.
Http listeners1:
------------------------
Address http://0.0.0.0:1890
Acceptor threads 1
Default virtual server test
Tuning
You can create and configure HTTP listeners through the web-based Administration interface. For more information, see Sun ONE Application Server Administration Guide.
If you have created multiple HTTP Listeners, perfdump displays them all.
Set the TCP/IP listen queue size for all HTTP Listeners by:
Address
This field contains the base address that this listener is listening on. It contains the IP address and the port number.
If your HTTP listener listens on all IP addresses for the machine, the IP part of the address is 0.0.0.0.
Tuning
This setting is tunable when you edit a listen socket. If you specify an IP address other than 0.0.0.0, the server will make one less system call per connection. Specify an IP address other than 0.0.0.0 for the best possible performance.
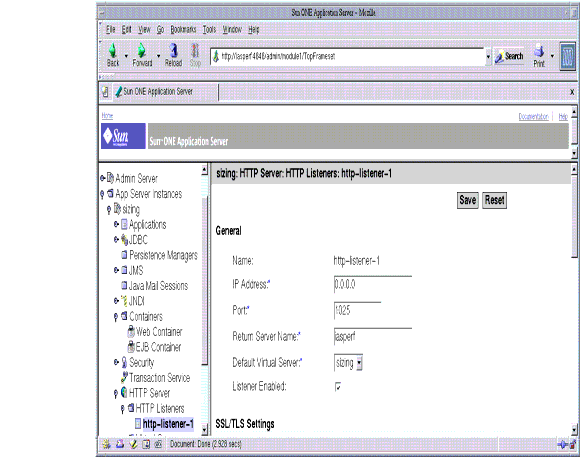
The following figure shows the Administration interface for the HTTP Listener.
Figure 4-6 Tuning the HTTP Listener using the Administration Interface
Acceptor Threads
Acceptor threads are threads that wait for connections. The threads accept connections and put them in a queue where they are then picked up by worker threads. Ideally, you want to have enough acceptor threads so that there is always one available when a user needs one, but few enough so that they do not put too much of a burden on the system. A good rule is to have one acceptor thread per CPU on your system. You can increase this value to about double the number of CPUs if you find indications of TCP/IP listen queue overruns.
Tuning
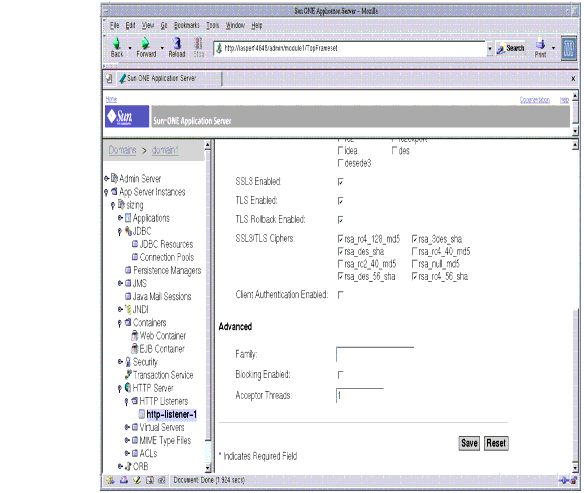
You can tune the number of acceptor threads by selecting the HTTP listener node and changing the number of acceptor threads on the right hand side of the Advanced category.
The following figure shows the Administration interface for the acceptor threads.
Figure 4-7 Tuning the Acceptor Threads using the Administration Interface
Default Virtual Server
Software virtual servers work using the HTTP 1.1 Host header. If the end user's browser does not send the host header, or if the server cannot find the virtual server specified by the Host header, Sun ONE Application Server handles the request using a default virtual server. Also, for hardware virtual servers, if the application server cannot find the virtual server corresponding to the IP address, it displays the default virtual server. You can configure the default virtual server to send an error message or serve pages from a special document root.
Tuning
You can specify a default virtual server for an individual listen socket and the server instance. If a given HTTP listener does not have a default virtual server, the server instance's default virtual server is used.
You can specify a default virtual server for a listen socket using the web-based Administration interface. You can set or change the default virtual server information using the Edit HTTP Listener page on the Preferences Tab of the web-based Administration interface for the HTTP server. The settings for the default virtual server are on the Connection Group Settings page that appears when you click Groups.
Keep-Alive/Persistent Connection Information
This section provides statistics about the server's HTTP-level keep-alive system.
The following example shows the keep-alive statistics displayed by perfdump:
KeepAliveInfo:
--------------------
KeepAliveCount 1/256
KeepAliveHits 4
KeepAliveFlushes 1
KeepAliveTimeout 30 seconds
Both HTTP 1.0 and HTTP 1.1 support the ability to send multiple requests across a single HTTP session. A web server can receive hundreds of new HTTP requests per second. If every request was allowed to keep the connection open indefinitely, the server could become overloaded with connections. On Unix/Linux systems, this could easily lead to a file table overflow.
To deal with this problem, the server maintains a "Maximum number of ‘waiting’ keep-alive connections" counter. A ‘waiting’ keep-alive connection has fully completed processing the previous request, and is waiting for a new request to arrive on the same connection. If the server has more than the maximum waiting connections open when a new connection waits for a keep-alive request, the server closes the oldest connection. This algorithm keeps an upper bound on the number of open waiting keep-alive connections that the server can maintain.
Sun ONE Application Server does not always honor a keep-alive request from a client. The following conditions cause the server to close a connection even if the client has requested a keep-alive connection:
- KeepAliveTimeout is set to 0.
- MaxKeepAliveConnections count is exceeded.
- Dynamic content, such as a CGI, does not have an HTTP content-length header set. This applies only to HTTP 1.0 requests. If the request is HTTP 1.1, the server honors keep-alive requests even if the content-length is not set. The server can use chuncked encoding for these requests if the client can handle them (indicated by the request header transfer-encoding:chunked). For more information regarding chuncked encoding, see the Sun ONE Application Server Developer’s Guide to NSAPI.
- Request is not HTTP GET or HEAD.
- The request was determined to be bad. For example, if the client sends only headers with no content.
KeepAliveThreads
You can configure the number of threads used in the keep-alive system by:
KeepAliveCount
This setting has two numbers:
Tuning
You can tune the maximum number of sessions the server allows to wait at one time before closing the oldest connection by:
KeepAliveHits
The number of times a request was successfully received from a connection that had been kept alive.
This setting is not tunable.
KeepAliveFlushes
The number of times the server had to close a connection because the KeepAliveCount exceeded the MaxKeepAliveConnections.
This setting is not tunable.
KeepAliveTimeout
Specifies the number of seconds the server allows a client connection to remain open with no activity. A web client may keep a connection to the server open so that multiple requests to one server can be serviced by a single network connection. Since a given server can handle a finite number of open connections, a high number of open connections will prevent new clients from connecting.
Tuning
You can change KeepAliveTimeout by:
KeepAliveQueryMeanTime
This parameter determines the intervals between the polling of Connections being handled by the KeepAlive Subsytem. If this parameter is set to a value N milliseconds, the Response time seen by a client which has requested persistent connections will have an overhead ranging from 0 to N milliseconds. This value is set by default to 1 millisecond (if unspecified in init.conf). This value works well if you expect a concurrent load of no more than about 300 KeepAlive connections. The default value can severely affect the scalability with higher concurrent loads. It is suggested that this be appropriately increased for higher connection load.
Tuning
You can change KeepAliveQueryMeanTime by editing the KeepAliveQueryMeanTime parameter in init.conf.
UseNativePoll
For Unix /Linux users, this parameter should be enabled for maximum performance.
To enable native poll for your keep-alive system from the web-based Administration interface, follow these steps:
- Select the HTTPServer node for the server instance that needs to have this option turned on.
- Select the Advanced Tab on the right hand side of the pane.
- Select the Keep alive page tab.
- Use the drop-down list to set UseNativePoll to ON.
- Click OK.
- Select the server instance tab from the tree view.
- Select Apply Changes.
- Restart the instance to cause your changes to take effect.
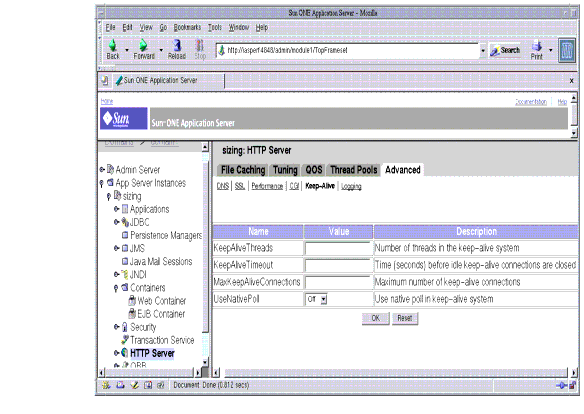
The following figure shows how to configure the keep-alive subsystem.
Figure 4-8 Tuning the Keep-Alive/Persistent Connections using the Administration Interface
Session Creation Information
Session creation statistics are only displayed in perfdump. Following is an example of SessionCreationInfo displayed in perfdump:
SessionCreationInfo:
------------------------
Active Sessions 1
Total Sessions Created 48/512
Active Sessions shows the number of sessions (request processing threads) currently servicing requests.
Total Sessions Created shows both the number of sessions that have been created and the maximum number of sessions allowed.
Reaching the maximum number of configured threads is not necessarily undesirable. It is not necessary to automatically increase the number of threads in the server. Reaching this limit means that the server needed this many threads at peak load. As long as it was able to serve requests in a timely manner, the server is adequately tuned. However, at this point connections will queue up in the connection queue, potentially overflowing it. If you check your perfdump output on a regular basis and notice that total sessions created is often near the RqThrottle maximum, you should consider increasing your thread limits.
Tuning
You can increase your thread limits by:
Cache Information
The Cache information section provides statistics on how your file cache is being used. The file cache caches static content so that the server handles requests for static content quickly.
Following is an example of how the cache statistics are displayed in perfdump:
CacheInfo:
------------------
enabled yes
CacheEntries 5/1024
Hit Ratio 93/190 ( 48.95%)
Maximum age 30
enabled
If the cache is disabled, the rest of this section is not displayed.
Tuning
The cache is enabled by default. You can disable it by:
CacheEntries
The number of current cache entries and the maximum number of cache entries are both displayed. A single cache entry represents a single URI.
Tuning
You can set the maximum number of cached entries by:
Hit Ratio (CacheHits / CacheLookups)
The hit ratio gives you the number of file cache hits versus cache lookups. Numbers approaching 100% indicate the file cache is operating effectively, while numbers approaching 0% could indicate that the file cache is not serving many requests.
This setting is not tunable.
Maximum Age
The maximum age displays the maximum age of a valid cache entry. This parameter controls how long cached information is used after a file has been cached. An entry older than the maximum age is replaced by a new entry for the same file.
Tuning
If your web site's content changes infrequently, you may want to increase this value for improved performance. You can set the maximum age by:
- Entering or changing the value in the Maximum Age field of the File Cache Configuration page in the web-based Admin Console for the HTTP server node and selecting the File Caching Tab.
- Editing the MaxAge parameter in the nsfc.conf file. For more information, see the Sun ONE Application Server Developer’s Guide to NSAPI.
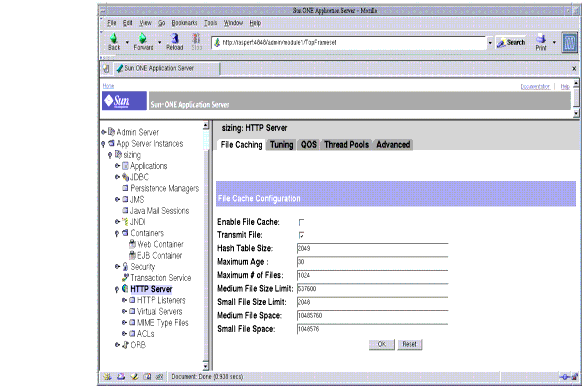
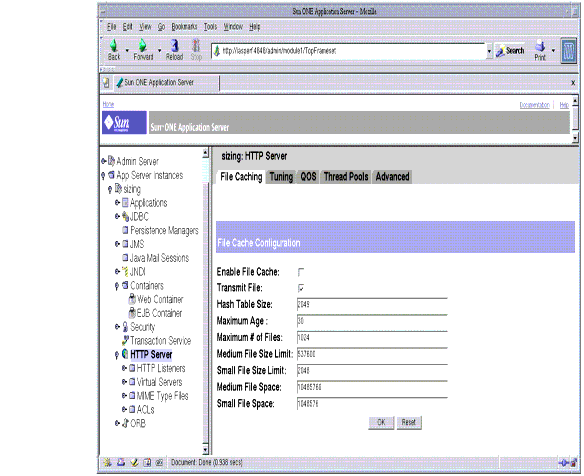
The following figure shows the Administration interface for configuring the file cache system.
Figure 4-9 Tuning the File Cache Information using the Administration Interface
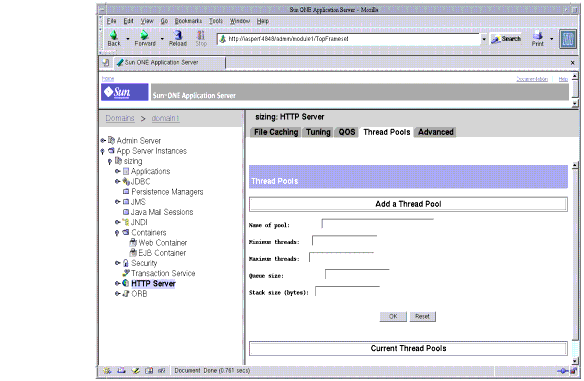
Thread Pools
The following figure shows Administration interface for configuring the thread pools.
Figure 4-10 Tuning the Thread Pools using the Administration Interface
Three types of thread pools can be configured through the web-based Administration interface:
Thread Pools (Unix /Linux only)
Since threads on Unix/Linux are always operating system (OS)-scheduled, as opposed to user-scheduled, Unix/Linux users do not need to use native thread pools. Therefore, this option is not offered in a Unix/Linux user interface. However, you can edit the OS-scheduled thread pools and add new thread pools, if needed, using the web-based Administration interface.
Native Thread Pools (NT only)
On NT, the native thread pool (NativePool) is used internally by the server to execute NSAPI functions that require a native thread for execution.
Native pools:
----------------------------
NativePool:
Idle/Peak/Limit 1/1/128
Work queue length/Peak/Limit 0/0/0
Windows NT users can edit their native thread pool settings using the web-based Administration interface.
Sun ONE Application Server uses NSPR, which is an underlying portability layer providing access to the host OS services. This layer provides abstractions for threads that are not always the same as those for the OS-provided threads. These non-native threads have lower scheduling overhead, so their use improves performance. However, these threads are sensitive to blocking calls to the OS, such as I/O calls. To make it easier to write NSAPI extensions that can make use of blocking calls, the server keeps a pool of threads that safely support blocking calls. This usually means it is a native OS thread. During request processing, any NSAPI function that is not marked as being safe for execution on a non-native thread is scheduled for execution on one of the threads in the native thread pool.
If you have written your own NSAPI plug-ins such as NameTrans, Service, or PathCheck functions, these execute by default on a thread from the native thread pool. If your plug-in makes use of the NSAPI functions for I/O exclusively or does not use the NSAPI I/O functions at all, then it can execute on a non-native thread. For this to happen, the function must be loaded with a NativeThread="no" option, indicating that it does not require a native thread.
To do this, add the following to the "load-modules" Init line in the init.conf file:
Init funcs="pcheck_uri_clean_fixed_init" shlib="C:/Netscape/p186244/P186244.dll" fn="load-modules" NativeThread="no"
The NativeThread flag affects all functions in the funcslist, so if you have more than one function in a library, but only some of them use native threads, use separate Init lines.
Generic Thread Pools (NT only)
On NT, you can set up additional thread pools using the web-based Admin Console. Use thread pools to put a limit on the maximum number of requests answered by a service function at any moment. Additional thread pools are a way to run thread-unsafe plug-ins. By defining a pool with a maximum number of threads set to 1, only one request is allowed into the specified service function.
Idle/Peak/Limit
Idle indicates the number of threads that are currently idle. Peak indicates the peak number in the pool. Limit indicates the maximum number of native threads allowed in the thread pool, and is determined by the setting of NativePoolMaxThreads.
Tuning
You can modify the NativePoolMaxThreads by:
Work Queue Length /Peak /Limit
These numbers refer to a queue of server requests that are waiting for the use of a native thread from the pool. The Work Queue Length is the current number of requests waiting for a native thread.
Peak is the highest number of requests that were ever queued up simultaneously for the use of a native thread since the server was started. This value can be viewed as the maximum concurrency for requests requiring a native thread.
Limit is the maximum number of requests that can be queued at one time to wait for a native thread, and is determined by the setting of NativePoolQueueSize.
Tuning
You can modify the NativePoolQueueSize by:
NativePoolStackSize (NT only)
The NativePoolStackSize determines the stack size in bytes of each thread in the native (kernel) thread pool.
Tuning
You can modify the NativePoolStackSize by:
NativePoolQueueSize (NT only)
The NativePoolQueueSize determines the number of threads that can wait in the queue for the thread pool. If all threads in the pool are busy, the next request-handling thread that needs to use a thread in the native pool must wait in the queue. If the queue is full, the next request-handling thread that tries to get in the queue is rejected, and a busy response is returned to the client. It is then free to handle another incoming request instead of being tied up waiting in the queue.
Setting The NativePoolQueueSize lower than the RqThrottle value causes the server to execute a busy function instead of the intended NSAPI function whenever the number of requests waiting for service by pool threads exceeds this value. The default returns a "503 Service Unavailable" response and logs a message if LogVerbose is enabled. Setting The NativePoolQueueSize higher than RqThrottle causes the server to reject connections before a busy function can execute.
This value represents the maximum number of concurrent requests for service which require a native thread. If your system is unable to fulfill requests due to load, letting more requests queue up increases the latency for requests and could result in all available request threads waiting for a native thread. In general, set this value to be high enough to avoid rejecting requests by anticipating the maximum number of concurrent users who would execute requests requiring a native thread.
The difference between this value and RqThrottle is the number of requests reserved for non-native thread requests, such as static HTML and image files. Keeping a reserve and rejecting requests ensures that your server continues to fill requests for static files, which prevents it from becoming unresponsive during periods of very heavy dynamic content load. If your server consistently rejects connections, this value is either set too low, or your server hardware is overloaded.
Tuning
You can modify the NativePoolQueueSize by:
NativePoolMaxThreads (NT only)
NativePoolMaxThreads determine the maximum number of threads in the native (kernel) thread pool.
A higher value allows more requests to execute concurrently, but has more overhead due to context switching, so "bigger is not always better." Typically, you will not need to increase this number, but if you are not saturating your CPU and you are seeing requests queue up, you should increase this number.
Tuning
You can modify the NativePoolMaxThreads by editing the NativePoolMaxThreads parameter in init.conf.
NativePoolMinThreads (NT only)
Determines the minimum number of threads in the native (kernel) thread pool.
Tuning
You can modify the NativePoolMinThreads by:
DNS Cache Information
The DNS cache caches IP addresses and DNS names. Your server's DNS cache is disabled by default. In the DNS Statistics for Process ID All page under Monitor in the web-based Administration interface the following statistics are displayed:
enabled
If the DNS cache is disabled, the rest of this section is not displayed.
Tuning
By default, the DNS cache is off. You can enable DNS caching by:
CacheEntries (CurrentCacheEntries / MaxCacheEntries)
The number of current cache entries and the maximum number of cache entries. A single cache entry represents a single IP address or DNS name lookup. The cache should be as large as the maximum number of clients that will access your web site concurrently. Note that setting the cache size too high will waste memory and degrade performance.
Tuning
You can set the maximum size of the DNS cache by:
HitRatio (CacheHits / CacheLookups)
The hit ratio displays the number of cache hits versus the number of cache lookups.
This setting is not tunable.
Note
If you turn off DNS lookups on your server, host name restrictions will not work and hostnames will not appear in your log files. Instead, you'll see IP addresses.
Caching DNS Entries
You can also specify whether to cache the DNS entries. If you enable the DNS cache, the server can store hostname information after receiving it. If the server needs information about the client in the future, the information is cached and available without further querying. You can specify the size of the DNS cache and an expiration time for DNS cache entries. The DNS cache can contain 32 to 32768 entries; the default value is 1024. Values for the time it takes for a cache entry to expire can range from 1 second to 1 year specified in seconds; the default value is 1200 seconds (20 minutes).
Limit DNS Lookups to Asynchronous
It is recommended that you do not use DNS lookups in server processes because they are so resource-intensive. If you must include DNS lookups, be sure to make them asynchronous.
enabled
If asynchronous DNS is disabled, the rest of this section will not be displayed.
Tuning
You can enable asynchronous DNS by:
NameLookups
The number of name lookups (DNS name to IP address) that have been done since the server was started.
This setting is not tunable.
AddrLookups
The number of address loops (IP address to DNS name) that have been done since the server was started.
This setting is not tunable.
LookupsInProgress
The current number of lookups in progress.
This setting is not tunable.
The following figure shows the Administration interface for configuring the DNS cache information.
Figure 4-11 Tuning the DNS Cache Information using the Administration Interface
Busy Functions
The default busy function returns a "503 Service Unavailable" response and logs a message if LogVerbose is enabled. You may wish to modify this behavior for your application. To better troubleshoot performance problems, it is useful to specify your own busy functions for any NSAPI function in the <instancename>-obj.conf file by including a service function in the configuration file in this format:
busy="<my-busy-function>"
For example, you could use this sample service function:
Service fn="send-cgi" busy="service-toobusy"
This allows different responses if the server becomes too busy in the course of processing a request that includes a number of types (such as Service, AddLog, and PathCheck). Note that your busy function will apply to all functions that require a native thread to execute when the default thread type is non-native.
To use your own busy function instead of the default busy function for the entire server, you can write an NSAPI init function that includes a func_insert call as shown below:
extern "C" NSAPI_PUBLIC int my_custom_busy_function(pblock *pb, Session *sn, Request *rq);
my_init(pblock *pb, Session *, Request *)
{
func_insert("service-toobusy", my_custom_busy_function);
}
Busy functions are never executed on a pool thread, so you must be careful to avoid using function calls that could cause the thread to block.
Using Performance Buckets
Performance buckets allow you to define buckets, and link them to various server functions. Every time one of these functions is invoked, the server collects statistical data and adds it to the bucket. For example, send-cgi and NSServletService are functions used to serve the CGI and Java servlet requests respectively. You can either define two buckets to maintain separate counters for CGI and servlet requests, or create one bucket that counts requests for both types of dynamic content. The cost of collecting this information is little and impact on the server performance is usually negligible. The following information is stored in a bucket:
- Name of the bucket. This name is used for associating the bucket with a function.
- Description. A description of the functions associated with the bucket.
- Number of requests for this function. The total number of requests that caused this function to be called.
- Number of times the function was invoked. This number may not coincide with the number of requests for the function because some functions may be executed more than once for a single request.
- Function latency or the dispatch time. The time taken by the server to invoke the function.
- Function time. The time spent in the function itself.
The default-bucket is pre-defined by the server. It records statistics for the functions not associated with any user defined bucket.
Configuration
You must specify all the configuration information for performance buckets in the init.conf and <instancename>-obj.conf files. Only the default bucket is automatically enabled.
The following examples show how to define new buckets in init.conf:
Init fn="define-perf-bucket" name="acl-bucket" description="ACL bucket"
Init fn="define-perf-bucket" name="file-bucket" description="Non-cached responses"
Init fn="define-perf-bucket" name="cgi-bucket" description="CGI Stats"
The prior example creates three buckets: acl-bucket, file-bucket, and cgi-bucket. To associate these buckets with functions, add bucket=bucket-name to the obj.conf function for which you wish to measure performance. For example:
PathCheck fn="check-acl" acl="default" bucket="acl-bucket"
...
Service method="(GET|HEAD|POST)" type="*~magnus-internal/*" fn="send-file" bucket="file-bucket"
...
<Object name="cgi">
ObjectType fn="force-type" type="magnus-internal/cgi"
Service fn="send-cgi" bucket="cgi-bucket"
</Object>Performance Report
The performance buckets information is located in the last section of the report that perfdump returns.
For more information, see “Enabling Statistics with stats-xml” and “Using Performance Buckets”.
The report contains the following information:
- Average, Total, and Percent columns give data for each requested statistic.
- Request Processing Time is the total time required by the server to process all the requests it has received so far.
- Number of Requests is the total number of requests for the function.
- Number of Invocations is the total number of times that the function was invoked. This differs from the number of requests in that a function can be called multiple times while processing one request. The percentage column for this row is calculated in reference to the total number of invocations for all the buckets.
- Latency is the time, in seconds, that the Sun ONE Application Server takes to prepare for calling the function.
- Function Processing Time is the time, in seconds, that the Sun ONE Application Server spent inside the function. The percentage of Function Processing Time and Total Response Time is calculated with reference to the total Request processing time.
- Total Response Time is the sum, in seconds, of Function Processing Time and Latency.
The following is an example of the performance bucket information available through perfdump:
Performance Counters:
------------------------------------------------
Average Total Percent
Total number of requests: 474851
Request processing time: 0.0010 485.3198
Default Bucket (default-bucket)
Number of Requests: 597 ( 0.13%)
Number of Invocations: 9554 ( 1.97%)
Latency: 0.0000 0.1526 ( 0.03%)
Function Processing Time: 0.0256 245.0459 ( 50.49%)
Total Response Time: 0.0257 245.1985 ( 50.52%)
Configuring the File Cache
The Sun ONE Application Server uses a file cache to serve static information faster. The file cache contains information about files and static file content. The file cache also caches information that is used to speed up processing of server-parsed HTML.
The file cache is turned on by default. The file cache settings are contained in a file called nsfc.conf. You can use the web-based Administration interface to change the file cache settings.
The following figure shows the Administration interface for configuring the file cache settings.
Figure 4-12 Tuning the File Caching using the Administration Interface
To configure the file cache:
- Select the File Caching tab of the HTTP server.
- Check Enable File Cache, if not already selected.
- Choose whether or not to transmit files.
When you enable Transmit File, the server caches open file descriptors for files in the file cache, rather than the file contents. PR_TransmitFile is used to send the file contents to a client. When Transmit File is enabled, the distinction normally made by the file cache between small, medium, and large files no longer applies since only the open file descriptor is being cached. By default, Transmit File is enabled on NT, and not enabled on Unix. On Unix, enable Transmit File for platforms that have native OS support for PR_TransmitFile, which currently includes HP-UX and AIX. It is not recommended for other Unix/Linux platforms.
- Enter a size for the hash table.
The default size is twice the maximum number of files plus 1. For example, if your maximum number of files is set to 1024, the default hash table size is 2049.
- Enter a maximum age in seconds for a valid cache entry.
By default, this is set to 30.
This setting controls how long cached information will continue to be used once a file has been cached. An entry older than MaxAge is replaced by a new entry for the same file, if the same file is referenced through the cache.
Set the maximum age based on whether the content is updated (existing files are modified) on a regular schedule or not. For example, if content is updated four times a day at regular intervals, you could set the maximum age to 21600 seconds (6 hours). Otherwise, consider setting the maximum age to the longest time you are willing to serve the previous version of a content file after the file has been modified.
- Enter the Maximum Number of Files to be cached.
By default, this is set to 1024.
- (Unix /Linux only) Enter medium and small file size limits in bytes.
By default, the Medium File Size Limit is set to 525000 (525 KB).
By default, Small File Size Limit is set to 2048.
The cache treats small, medium, and large files differently. The contents of medium files are cached by mapping the file into virtual memory (Unix/Linux platforms). The contents of "small" files are cached by allocating heap space and reading the file into it. The contents of "large" files (larger than "medium") are not cached, although information about large files is cached.
The advantage of distinguishing between small files and medium files is to avoid wasting part of many pages of virtual memory when there are lots of small files. So the Small File Size Limit is typically a slightly lower value than the VM page size.
- (Unix /Linux only) Set the medium and small file space.
The medium file space is the size in bytes of the virtual memory used to map all medium sized files. By default, this is set to 10000000 (10MB).
The small file space is the size of heap space in bytes used for the cache, including heap space used to cache small files. By default, this is set to 1MB for Unix/Linux.
- Click OK.
- Click Apply.
- Select Apply Changes to restart your server.
Using the nocache Parameter
You can use the parameter nocache for the Service function send-file to specify that files in a certain directory not be cached. For example, if you have a set of files that changes too rapidly for caching to be useful, you can put them in a directory and instruct the server not to cache files in that directory by editing the <instancename>-obj.conf file.
For example:
<Object name=default>
...
NameTrans fn="pfx2dir" from="/myurl" dir="/export/mydir" name="myname"
...
Service method=(GET|HEAD|POST) type=*~magnus-internal/* fn=send-file
...
</Object>
<Object name="myname">
Service method=(GET|HEAD) type=*~magnus-internal/* fn=send-file nocache=""
</Object>
In the above example, the server does not cache static files from /export/mydir/ when requested by the URL prefix /myurl.
File Cache Dynamic Control and Monitoring
You can add an object to <instancename>-obj.conf to dynamically monitor and control the nsfc.conf file cache while the server is running. To do this:
Add a NameTrans directive to the default object:
NameTrans fn="assign-name" from="/nsfc" name="nsfc"
Add an nsfc object definition:
<Object name="nsfc">
Service fn=service-nsfc-dump
</Object>This enables the file cache control and monitoring function (nsfc-dump) to be accessed via the URI, "/nsfc." By changing the "from" parameter in the NameTrans directive, a different URI can be used.
The following is an example of the information you receive when you access the URI:
Sun ONE Application Server File Cache Status (pid 7960)
The file cache is enabled.
Cache resource utilization
Number of cached file entries = 1039 (112 bytes each, 116368 total bytes)
Heap space used for cache = 237641/1204228 bytes
Mapped memory used for medium file contents = 5742797/10485760 bytes
Number of cache lookup hits = 435877/720427 ( 60.50 %)
Number of hits/misses on cached file info = 212125/128556
Number of hits/misses on cached file content = 19426/502284
Number of outdated cache entries deleted = 0
Number of cache entry replacements = 127405
Total number of cache entries deleted = 127407
Number of busy deleted cache entries = 17
Parameter settings
HitOrder: false
CacheFileInfo: true
CacheFileContent: true
TransmitFile: false
MaxAge: 30 seconds
MaxFiles: 1024 files
SmallFileSizeLimit: 2048 bytes
MediumFileSizeLimit: 537600 bytes
CopyFiles: false
Directory for temporary files: /tmp/netscape/https-axilla.mcom.com
Hash table size: 2049 buckets
You can include a query string when you access the "/nsfc" URI. The following values are recognized:
If you choose the ?list option, the file listing includes the file name, a set of flags, the current number of references to the cache entry, the size of the file, and an internal file ID value. The flags are as follows:
- C - File contents are cached.
- D - Cache entry is marked for delete.
- E - PR_GetFileInfo() returned an error for this file.
- I - File information (size, modify date, etc.) is cached.
- M - File contents are mapped into virtual memory.
- O - File descriptor is cached (when TransmitFile is set to true).
- P - File has associated private data (should appear on shtml files).
- T - Cache entry has a temporary file.
- W - Cache entry is locked for write access.
For sites with scheduled updates to content, consider shutting down the cache while the content is being updated, and starting it again after the update is complete. Although performance will slow down, the server operates normally when the cache is off.
Tuning the ACL User Cache
The ACL user cache is ON by default. Because of the default size of the cache (200 entries), the ACL user cache can be a bottleneck, or can simply not serve its purpose on a site with heavy traffic. On a busy site, more than 200 users can hit ACL-protected resources in less time than the lifetime of the cache entries. When this situation occurs, the Sun ONE Application Server has to query the LDAP server more often to validate users, which impacts performance.
This bottleneck can be avoided by increasing the size of the ACL cache with the ACLUserCacheSize directive in init.conf. Note that increasing the cache size will use more resources; the larger you make the cache the more RAM you'll need to hold it.
There can also be a potential (but much harder to hit) bottleneck with the number of groups stored in a cache entry (by default four). If a user belongs to five groups and hits five ACLs that check for these different groups within the ACL cache lifetime, an additional cache entry is created to hold the additional group entry. When there are two cache entries, the entry with the original group information is ignored.
While it would be extremely unusual to hit this possible performance problem, the number of groups cached in a single ACL cache entry can be tuned with the ACLGroupCacheSize directive.
ACL User Cache Directives
To adjust the ACL user cache values you will need to manually add the following directives to your init.conf file:
ACLCacheLifetime
Set this directive to a number that determines the number of seconds before the cache entries expire. Each time an entry in the cache is referenced, its age is calculated and checked against ACLCacheLifetime. The entry is not used if its age is greater than or equal to the ACLCacheLifetime. The default value is 120 seconds. If this value is set to 0, the cache is turned off. If you use a large number for this value, you may need to restart the Sun ONE Application Server when you make changes to the LDAP entries. For example, if this value is set to 120 seconds, the Sun ONE Application Server might be out of sync with the LDAP server for as long as two minutes. If your LDAP is not likely to change often, use a large number.
ACLUserCacheSize
Set this directive to a number that determines the size of the User Cache (default is 200).
ACLGroupCacheSize
Set this directive to a number that determines how many group IDs can be cached for a single UID/cache entry (default is 4).
Verifying ACL User Cache Settings
With LogVerbose you can verify that the ACL user cache settings are being used. When LogVerbose is running, you should expect to see these messages in your error log when the server starts:
User authentication cache entries expire in ### seconds.
User authentication cache holds ### users.
Up to ### groups are cached for each cached user.
Tuning
You can turn LogVerbose ONby editing the LogVerbose parameter in init.conf.
Caution
Do not turn on LogVerbose on a production server. Doing so degrades performance and increases the size of your error logs.
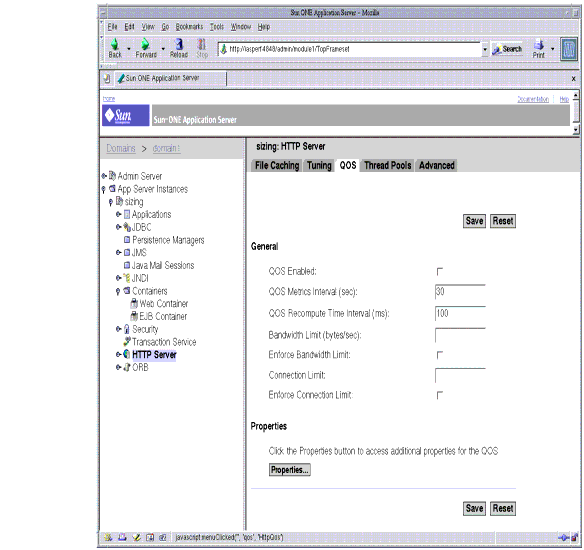
Using Quality of Service
The quality of service features let you limit the amount of bandwidth and number of connections for a server instance, class of virtual servers, or individual virtual server. You can set these performance limits, track them, and optionally enforce them.
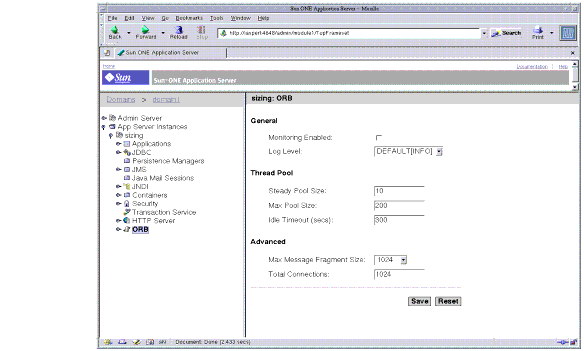
The following figure shows the Administration interface for configuring the Quality of Service.
Figure 4-13 Tuning the Quality of Service using the Administration Interface
For more information, see “Using Quality of Service” in the Sun ONE Application Server Administrator's Guide.
Threads, Processes, and Connections
In the Sun ONE Application Server, acceptor threads on an HTTP Listener accept connections and put them onto a connection queue. Session threads then pick up connections from the queue and service the requests. More session threads are posted if required at the end of the request. The policy for adding new threads is based on the connection queue state:
- Each time a new connection is returned, the number of connections waiting in the queue (the backlog of connections) is compared to the number of session threads already created. If it is greater than the number of threads, more threads are scheduled to be added the next time a request completes.
- The previous backlog is tracked, so that another ThreadIncrement number of threads are scheduled to be added of the following are true:
- The process of adding new session threads is strictly limited by the RqThrottle value.
- To avoid creating too many threads when the backlog increases suddenly (such as the startup of benchmark loads), the decision whether more threads are needed is made only once every 16 or 32 times a connection is made based on how many session threads already exist.
The following directives affect the number and timeout of threads, processes, and connections can be tuned in the web-based Admin Console or init.conf:
For more information about these directives, see the Sun ONE Application Server Developer’s Guide to NSAPI.
HTTP listener Acceptor Threads
You can specify how many threads you want in accept mode on a listen socket at any time. It is a good practice to set this to less than or equal to the number of CPUs in your system.
Tuning
You can set the number of HTTP listener acceptor threads by:
Maximum Simultaneous Requests
The RqThrottle parameter in the init.conf file specifies the maximum number of simultaneous transactions the web server can handle. The default value is 128. Changes to this value can be used to throttle the server, minimizing latencies for the transactions that are performed. The RqThrottle value acts across multiple virtual servers, but does not attempt to load-balance.
To compute the number of simultaneous requests, the server counts the number of active requests, adding one to the number when a new request arrives, subtracting one when it finishes the request. When a new request arrives, the server checks to see if it is already processing the maximum number of requests. If it has reached the limit, it defers processing new requests until the number of active requests drops below the maximum amount.
In theory, you could set the maximum simultaneous requests to 1 and still have a functional server. Setting this value to 1 would mean that the server could only handle one request at a time, but since HTTP requests for static files and generally have a very short duration (response time can be as low as 5 milliseconds), processing one request at a time would still allow you to process up to 200 requests per second.
However, in actuality, Internet clients frequently connect to the server and then do not complete their requests. In these cases, the server waits 30 seconds or more for the data before timing out. You can define this timeout period using the AcceptTimeOut directive in init.conf. The default value is 30 seconds. Also, some sites do heavyweight transactions that take minutes to complete. Both of these factors add to the maximum simultaneous requests that are required. If your site is processing many requests that take many seconds, you may need to increase the number of maximum simultaneous requests. For more information on AcceptTimeOut, see AcceptTimeOut Information.
Suitable RqThrottle values range from 100-500, depending on the load.
RqThrottleMin is the minimum number of threads the server initiates upon start-up. The default value is 48. RqThrottle represents a hard limit for the maximum number of active threads that can run simultaneously, which can become a bottleneck for performance. The default value is 128.
Tuning
You can tune the number of simultaneous requests by:
Improving Java Performance
There are a number of ways you can improve Java performance on Sun ONE Application Server. These include:
Using an Alternate Thread Library
On Solaris 8 and above, using an alternate thread library such as libthread or /usr/lib/lwp, gives optimal performance. This libthread is enabled by default.
Using Pre-compiled JSPs
Compiling JSPs is a resource intensive and time-consuming process. You will improve performance if you pre-compile your JSPs before installing them into your server.
Configuring Class Reloading
The configuration for flag for dynamic reloading should be disabled for better performance. This can be accomplished by editing the server.xml and setting dynamic-reload-enabled="false"
Miscellaneous init.conf Directives
The following sections discuss init.conf directives you can use to configure your server to function more effectively:
AcceptTimeOut Information
Use AcceptTimeOut to specify the number of seconds the server waits between accepting a connection to a client and receiving information from it. The default setting is 30 seconds. Under most circumstances you should not have to change this setting. By setting it to less than the default 30 seconds, you can free up threads sooner. However, you may also disconnect users with slower connections.
Tuning
You can set the AcceptTimeOut by:
CGIStub Processes (Unix/Linux)
You can adjust the CGIStub parameters on Unix/Linux systems. In Sun ONE Application Server, the CGI engine creates CGIStub processes as needed. On systems that serve a large load and rely heavily on CGI-generated content, it is possible for the CGIStub processes to consume all system resources. If this is happening on your server, the CGIStub processes can be tuned to restrict how many new CGIStub processes can be spawned, their timeout value, and the minimum number of CGIStub processes that will be running at any given moment.
Note
If you have an init-cgi function in the init.conf file and you are running in multi-process mode, you must add LateInit = yes to the init-cgi line.
The four directives and their defaults that can be tuned to control CGI stubs are:
MinCGIStubs controls the number of processes that are started by default. The first CGIStub process is not started until a CGI program has been accessed. The default value is 2. If you have an init-cgi directive in the init.conf file, the minimum number of CGIStub processes are spawned at startup.
MaxCGIStubs controls the maximum number of CGIStub processes the server can spawn. This specifies the maximum concurrent CGIStub processes in execution, not the maximum number of pending requests. The default value shown should be adequate for most systems. Setting this too high may actually reduce throughput. The default value is 10.
CGIStubIdleTimeout causes the server to kill any CGIStub processes that have been idle for the number of seconds set by this directive. Once the number of processes is at MinCGIStubs it does not kill any more processes. The default is 45.
CGIExpirationTimeout limits the maximum time in seconds that CGI processes can run.
Tuning
You can configure all of the directives for CGI Stub processes by:
Buffer Size
You can specify the size of the send buffer (SndBufSize) and the receiving buffer (RcvBufSize) at the server's sockets. For more information regarding these buffers, see your Unix/Linux documentation.
Tuning
You can set the buffer size by:
Miscellaneous obj.conf Parameters
You can use some obj.conf function parameters to improve your server's performance. In addition to the ones listed below, see “Using the nocache Parameter” for additional information.
For more information on using obj.conf, see the Sun ONE Application Server Developer’s Guide to NSAPI.
find-pathinfo-forward
The parameter find-pathinfo-forward for the PathCheck function find-pathinfo and the NameTrans functions pfx2dir and assign-name can help you improve your performance. This parameter instructs the server to search forward for PATH_INFO in the path after ntrans-base, instead of backward from the end of path in the server function find-pathinfo.
Note
The server ignores the find-pathinfo-forward parameter if the ntrans-base parameter is not set in rq->vars when the server function find-pathinfo is called. By default, ntrans-base is set.
For example:
NameTrans fn="pfx2dir" find-pathinfo-forward="" from="/cgi-bin" dir="/export/home/cgi-bin" name="cgi"
NameTrans fn="assign-name" from="/perf" find-pathinfo-forward="" name="perf"
This feature can improve performance for certain URLs by doing fewer stats in the server function find-pathinfo. On Windows NT, you can also use this feature to prevent the server from changing "\" to "/" when using the PathCheck server function find-pathinfo.
nostat
You can specify the parameter nostat in the NameTrans function assign-name to prevent the server from doing a stat on a specified URL whenever possible. Use the following syntax:
nostat=virtual-path
For example:
<Object name=default>
NameTrans fn="assign-name" from="/nsfc" nostat="/nsfc" name="nsfc"
</Object>
<Object name=nsfc>
Service fn=service-nsfc-dump
</Object>
In the above example, the server does not stat for path /ntrans-base/nsfc and /ntrans-base/nsfc/* if ntrans-base is set. If ntrans-base is not set, the server does not stat for URLs /nsfc and /nsfc/*. By default ntrans-base is set. The example assumes the default PathCheck server functions are used.
When you use nostat= virtual-path in the assign-nameNameTrans, the server assumes that stat on the specified virtual-path will fail. Therefore, use nostat only when the path of the virtual-path does not exist on the system, for example, in NSAPI plug-in URLs. Using nostat on those URLs improves performance by avoiding unnecessary stats on those URLs.
Scaling Your Server
This section examines subsystems of your server and makes some recommendations for optimal performance:
Processors
On Solaris and Windows NT, Sun ONE Application Server transparently takes advantage of multiple CPUs. In general, the effectiveness of multiple CPUs varies with the operating system and the workload. Dynamic content performance improves as more processors are added to the system. Because static content involves mostly IO, and more primary memory means more caching of the content (assuming the server is tuned to take advantage of the memory) more time is spent in IO rather than any busy CPU activity. Our study of dynamic content performance on a four-CPU machine indicate a 40-60% increase for NSAPI and about 50-80% increase for servlets., by doubling the number of CPUs.
Memory
Sun ONE Application Server requires a minimum of 256 MB RAM on Solaris and Windows. These values apply to the application server running on a system that is not running Sun ONE Studio. Please refer to the Sun ONE Application Server Installation Guide on the Sun Microsystems documentation web site.
Disk Space
You need to have enough disk space for your OS, document tree, and log files. In most cases 2GB total is sufficient.
Put the OS, swap/paging file, Sun ONE Application Server logs, and document tree each on separate hard drives. Thus, if your log files fill up the log drive, your OS will not suffer. Also, you'll be able to tell whether, for example, the OS paging file is causing drive activity.
Your OS vendor may have specific recommendations for how much swap or paging space you should allocate. Based on our testing, Sun ONE Application Server performs best with swap space equal to RAM, plus enough to map the document tree.
Networking
For an Internet site, decide how many peak concurrent users you need the server to handle, and multiply that number of users by the average request size on your site. Your average request may include multiple documents. If you're not sure, try using your home page and all its associated sub-frames and graphics.
Next decide how long the average user will be willing to wait for a document, at peak utilization. Divide by that number of seconds. That's the WAN bandwidth your server needs.
For example, to support a peak of 50 users with an average document size of 24kB, and transferring each document in an average of 5 seconds, we need 240 KBs (1920 kbit/s). So our site needs two T1 lines (each 1544 kbit/s). This also allows some overhead for growth.
Your server's network interface card should support more than the WAN it's connected to. For example, if you have up to three T1 lines, you can get by with a 10BaseT interface. Up to a T3 line (45 Mbit/s), you can use 100BaseT. But if you have more than 50 Mbit/s of WAN bandwidth, consider configuring multiple 100BaseT interfaces, or look at Gigabit Ethernet technology.
For an intranet site, your network is unlikely to be a bottleneck. However, you can use the same calculations as above to decide.
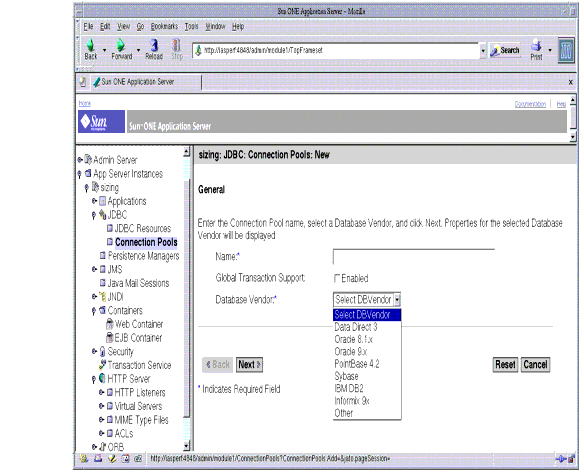
Connection Pool TuningThis section advises how users can tune their JDBC Connection Pools.
For database intensive applications, the JDBC Connection Pools managed by the Sun ONE Application Server can be tuned for optimum performance. These connection pools maintain numerous live physical database connections that can be reused in order reduce the overhead of opening and closing database connections.
JDBC Resources are defined as <jdbc-resource> elements in the Sun ONE Application Server configuration file server.xml and are configured to point to a <jdbc-connection-pool> . J2EE applications use JDBC Resources to obtain connections that are maintained by the JDBC Connection Pool. More than one JDBC Resource is allowed to point to the same JDBC Connection Pool. In such a case, the physical connection pool is shared by all the resources.
JDBC Connection Pools can be defined and configured by using the web-based Admin Console or by editing the jdbc-connection-pool element in the server.xml file. Though each defined pool is instantiated at server start-up, the pool is only populated with physical connections when accessed for the first time.
The following are the attributes that can be specified for a JDBC connection pool:
JDBC Connection Pool Tuning
The following performance tuning practices are recommended for JDBC Connection Pools:
- Use the default isolation level provided by the driver rather than calling the setTransactionIsolationLevel(); unless you are certain that your application behaves correctly and performs better at a different isolation level.
- Set the idle time out to 0 seconds. This directive ensures that the connections which are idle will not be removed at all. This ensures that there is normally no penalty in creating new connections and disables the idle monitor thread. However, there is a risk that the connection unused for too long is reset by the database server.
- When sizing connection pools, keep the following pros and cons in mind:
Table 4-2 Connection Pool Sizing Pros and Cons
Connection pool
Pros
Cons
Small Connection pool
Large Connection pool
- Set the max-wait-time-in-millis to 0. This essentially blocks the client thread until a connection becomes available. Also, this allows the server to alleviate the task of tracking the elapsed wait time for each request and increases performance.
- As previously noted, avoid modifying the transaction-isolation-level. If that is not possible, consider setting the is-isolation-level-guaranteed flag to false and make sure applications do not programmatically alter the connections' isolation level.
The following figure shows the Administration interface for configuring the connection pools.
Figure 4-14 Tuning the JDBC Connection Pools using the Administration Interface
JSP and Servlet TuningThis section advises how users can tune JSP and Servlet applications by following several coding practices and checking several relevant Sun ONE Application Server configuration settings.
Suggested Coding Practices for JSP's and Servlets
The following coding practices are recommended for JSP and Servlet applications:
- Do not store large objects as HttpSession variables
- Use javax.servlet.http.HttpSession.invalidate() to release HTTP Sessions when they are no longer needed.
- Use the JSP directive <%page session="false"%> to prevent HTTP Sessions from being automatically created when they are not necessary.
- Minimize Java synchronization in Servlets.
- Don't use the single thread model for Servlets.
- Use the servlet's init() method to perform expensive one time initialization.
- Avoid the use of System.out.println() calls.
Configuration Settings that Affect JSP/Servlet Performance
The following configuration settings will improve performance. It is important to remember that they are intended for production environments as some of the settings make developing JSP and Servlets impractical.
- In the server CLASSPATH setting, avoid excessive directories to improve class loading time. Package application related classes into JAR files.
- HTTP settings - connections, keep-alive subsystem settings: the response times are dependent on how the keep-alive subsystem and the HTTP server is tuned in general. Please refer to the section on HTTP Server Tuning. for more information.
- Set the recompile reload interval to -1 to prevent JSP recompilation.
- Use mtmalloc for SSL. Functions in this library provide a collection of malloc routines that provide concurrent access to heap space. Obtain the patch from http://www.sunsolve for libmtmalloc. Edit the startserv script, located in /bin/startserv, for the server instance in question and prepend the location of the so file to LD_LIBRARY_PATH.
- JSP Servlet caching configuration. For more information, see the Sun ONE Application Server 7 Developer’s Guide to Web Applications specifically, the chapter titled Using Servlets subsection on Caching Features.
- Deploy applications that do not contain EJB's as a WAR file rather than an EAR file.
- The security manager is expensive. This is because all the calls to the required resources will have to go through a doPrivileged() method call. This also involves checking the resource in question with the server.policy file. If there is an option where having server.policy doesn't make sense for the application, and under the assumption that no malicious code will be run on the server, then the user can disable the server.policy by commenting out the line in server.xml.
For example, you can comment out the server.policy as follows:
<!-- jvm-options> -Djava.security.policy=/export/home/software/ias70_gold3/domains /domain1/server1/config/server.policy
</jvm-options -->
Performance Tuning for EJBsThe Sun ONE Application Server's high performance EJB Container provides various tunables, with default values, that can be modified in the server.xml configuration file, and in each bean's descriptors. The values in server.xml apply to all EJBs unless they are also specified in the bean's deployment descriptors. Properties set in a bean's descriptors always override any settings in the server.xml. For a detailed description of <ejb-container> element in the server.xml file, see the Sun ONE Application Server Configuration File Reference.
Some properties that are in the EJB 2.0 deployment descriptor are also a good source of tuning. The default settings for the <ejb-container> element in the server.xml file are set for a single processor computer system. A user may want to change the default settings in order to derive the desired behavior from the container. The desired effects after tuning are for:
- Speed: Response times can be decreased effectively by caching as many beans in the EJB caches as possible. This saves several CPU-intensive operations (as explained below). However, one can have only finite memory as a resource, as the caches become large, house-keeping for these caches (including garbage collection) takes longer.
- Memory consumption: Beans in the pools or caches consume memory from the Java Virtual Machine heap. Exceedingly large pools and caches are detrimental to performance due to longer and frequent garbage collection cycles.
- Functional properties: (such as user timeout, commit options, security and transaction options, etc.) - Most of these properties are related to the functionality and configuration of the application in the J2EE server. It is not recommended to compromise functionality for performance, though some suggestions will be made to help make choices in case such a situation arises.
Performance Tuning the EJB Container
The EJB specification formally defines the life cycle of various types of beans. This document assumes that you are familiar with bean lifecycle events. Active beans in the container process requests and are cached or pooled for better performance. Tuning the cache and pool properties is a significant part of tuning for performance
Depending on the type of a bean, some of the suggested tuning tips may not apply to a particular container.
Guide to Using Tunables
The following table illustrates the cache and bean tunables for each type of EJB.
EJB Descriptor Properties
The following properties are available to tune for each bean in EJB Container:
- steady-pool-size: steady-pool-size specifies the initial and minimum number of beans that must be maintained in the pool. Valid values are from 0 to MAX_INTEGER. This value is specified at the server instance level. The bean specific counterpart to this is also the same. Note that for all the variables below, if there is a setting specified at the bean level (in the sun-ejb-jar.xml), the values specified at the bean level are used.
- pool-resize-quantity: pool-resize-quantity specifies the number of beans to be created or deleted when the pool is being serviced by the server. Valid values are from 0 to MAX_INTEGER and subject to maximum size limit). Default is 16. The corresponding attribute in the sun-ejb-jar.xml is resize-quantity.
- max-pool-size: max-pool-size specifies the maximum pool size. Valid values are from 0 to MAX_INTEGER. Default is 64. A value of 0 means that the size of the pool is unbounded. The potential implication is that the JVM heap will be filled with objects in the pool. The corresponding attribute in the sun-ejb-jar.xml is max-pool-size in the <bean-pool> element.
- max-wait-time-in-millis (deprecated)
- pool-idle-timeout-in-seconds: pool-idle-timeout-in-seconds specifies the maximum time that a stateless session bean, entity bean, or message-driven bean is allowed to be idle in the pool. After this time, the bean is destroyed if the bean in case is a stateless session bean or a message driver bean. This is a hint to server. Default value for pool-idle-timeout-in-seconds is 600 seconds. The corresponding attribute in the sun-ejb-jar.xml is pool-idle-timeout-in-seconds in the <bean-pool> element.
- cache-resize-quantity: cache-resize-quantity specifies the number of beans to be created or deleted when the cache is being serviced by the server. Valid values are from 0 to MAX_INTEGER and subject to maximum size limit. Default is 16. The corresponding attribute in the sun-ejb-jar.xml is resize-quantity in the <bean-cache> element.
- max-cache-size: max-cache-size defines the maximum number of beans in the cache. Should be greater than 1. Default is 512. Avalue of 0 indicates the cache is unbounded. The size of the cache, in this case, is governed by cache-idle-timeout-in-seconds and cache-resize-quantity. The corresponding attribute in the sun-ejb-jar.xml is max-cache-size in the <bean-cache> element.
- cache-idle-timeout-in-seconds: cache-idle-timeout-in-seconds specifies the maximum time that a stateful session bean or entity bean is allowed to be idle in the cache. After this time, the bean is passivated to backup store. Default value for cache-idle-timeout-in-seconds is 600 seconds. The corresponding attribute in the sun-ejb-jar.xml is cache-idle-timeout-in-seconds in the <bean-cache> element.
- is-cache-overflow-allowed (deprecated)
- removal-timeout-in-seconds: The amount of time that a stateful session bean remains passivated (i.e. idle in the backup store) is controlled by removal-timeout-in-seconds parameter. Note that if a bean was not accessed beyond removal-timeout-in-seconds, then it will be removed from the backup store and hence will not be accessible to the client. The Default value for removal-timeout-in-seconds is 60min. The corresponding attribute in the sun-ejb-jar.xml is removal-timeout-in-seconds in the <bean-cache> element.
- victim-selection-policy: victim-selection-policy specifies the algorithm to use to pick victims to be removed from the stateful session bean cache. Possible values are FIFO | LRU | NRU. Default is NRU, which is actually pseudo-random selection policy. The corresponding attribute in the sun-ejb-jar.xml is victim-selection-policy in the <bean-cache> element.
- commit-option: values are either "B", or "C". Default is "B". These reflect commit-options for transactions as per the EJB specification.
- refresh-period-in-seconds: (for BMP/ Read Only Beans only) refresh-period-in-seconds specifies the rate at which the read-only-bean must be refreshed from the data source. 0 (never refreshed) and positive (refreshed at specified intervals). Default is 600 seconds.
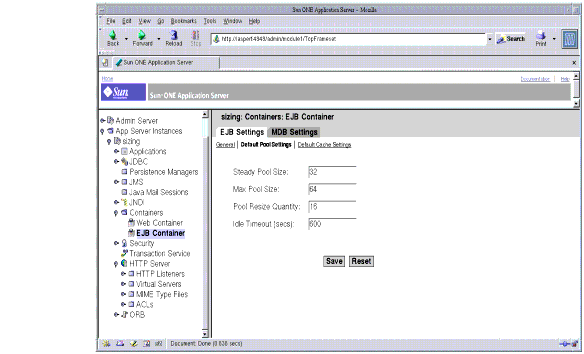
Tuning the EJB Pool
A bean in the pool represents the pooled state in the EJB lifecycle. This means that the bean does not have an identity. The advantage of having beans in the pool is that the time to create a bean may be saved for a request. The container has mechanisms that create pool objects in the background, to save the time of bean creation on the request path.
Set the steady-pool-size to a number that is indicative of a moderately loaded system. It is recommended that steady-pool-size be greater than 0, as it ensures that there is always a pooled instance to process an incoming request.
Set the max-pool-size to be representative of the anticipated high load of the system. An excessively large pool wastes memory and can slow down the system. A very small pool is also inefficient due to contention.
A good rule to remember when changing the <max-pool-size> is to also re-calibrate the <pool-resize-quantity>. This quantity is the number of beans that will be reclaimed by the periodic cleaner. An increase in the max size should mean an appropriate increase in the resize quantity to maintain a good equilibrium.
Another important tunable is the <pool-idle-timeout-in-seconds> value. In case there are more beans in the pool than the <steady-pool-size>, the pool will be drained back to <steady-pool-size> in steps of <pool-resize-quantity>, every <pool-idle-timeout-in-seconds> seconds. If the resize quantity is too small and the idle timeout large, the user would not see the pool draining back to steady size quick enough; this should be expected or corrected.
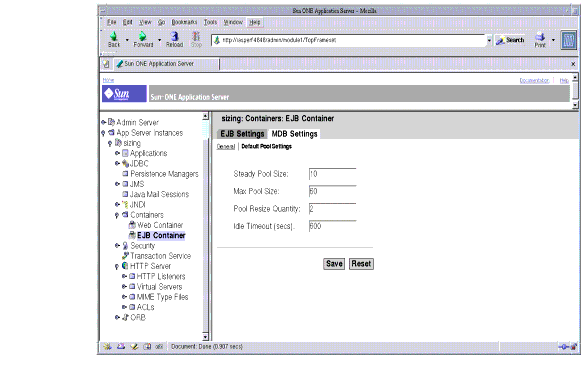
The following figure shows the Administration interface for tuning the EJB pool for the server instance.
Figure 4-15 Tuning the EJB Pool using the Administration Interface
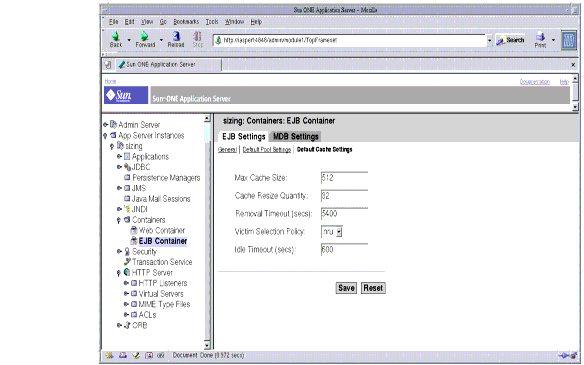
Tuning the EJB Cache
A bean in the cache represents the ready state in the EJB lifecycle. This means that the bean has an identity (e.g. primary key or session ID) associated with it. Beans moving out of the cache have to be passivated or destroyed according to the EJB lifecycle. Once passivated, a bean has to be activated to come back into the cache. Entity beans are generally stored in databases and use some form of query language semantics to load and store data. Session beans have to be serialized when storing them upon passivation onto the disk or a database; and similarly have to be deserialized upon activation.
Any incoming request using these 'ready' beans from the cache avoids the overheads of creation, setting identity, and potentially, activation. So, theoretically, it is good to cache as many beans as possible. However, there are downsides to caching extensively:
The periodic cleaner will remove all beans in the cache that have reached the <cache-idle-timeout-in-seconds>.
The following figure shows the Administration interface for tuning the EJB cache for the container as a whole.
Figure 4-16 Tuning the EJB Cache using the Administration Interface
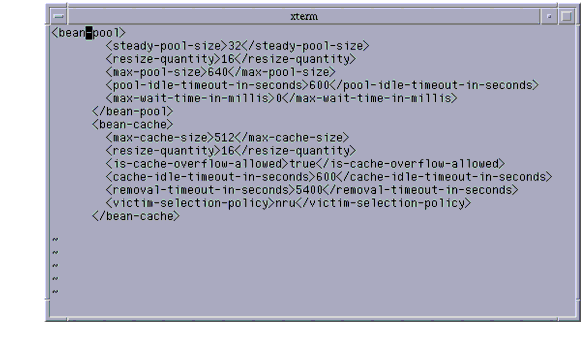
Performance Considerations for Various Types of EJBsThe following figure shows an example of possible bean descriptors for an individual bean pool and cache.
Figure 4-17 Bean Descriptors for Individual
The following are performance related discussions of various bean types:
- Entity beans: Depending on the usage of a particular entity bean, one should tune max-cache-size so that beans that are used less (e.g. an order that is created and never used after the transaction is over) are cached less, and beans that are used frequently (e.g. an item in the inventory that gets referenced very often), are cached more in numbers. Please see the section titled Commit Options for other ways of tuning the entity container.
- Stateful session beans: In case a stateful bean represents a user, a healthy max-cache-size of beans could be the expected number of concurrent users on the application server process. If this value is too low (in relation to the steady load of users), beans would be frequently passivated and activated, causing a negative impact on the response times, due to CPU intensive serialization and deserialization as well as disk I/O. Another important variable for tuning is cache-idle-timeout-in-seconds where at periodic intervals of cache-idle-timeout-in-seconds, all the beans in the cache that have not been accessed for more than cache-idle-timeout-in-seconds time, are passivated. Similar to an HttpSession inactivity/ idle timeout, the bean is removed after it has not been accessed for removal-timeout-in-seconds. Passivated beans are stored on disk in serialized form. A large number of passivated beans could not only mean many files on the disk system, but also slower response time as the session state has to be deserialized before the invocation.
- Stateless session beans: There is no state associated with stateless session beans and they are more readily pooled than entity or the stateful session beans. Appropriate values for steady-pool-size, pool-resize-quantity and max-pool-size are the best tunables for these type of beans. Set the steady-pool-size to greater than zero if you want to pre-populate the pool. This way, when the container comes up, it creates a pool with steady-pool-size number of beans. By pre-populating the pool you can avoid the object creation time during method invocations. Setting the steady-pool size to a very large value may cause unwanted memory growth and may result in large GC times. pool-resize-quantity determines the rate of growth as well as the rate of decay of the pool. Setting it to a small value will be better as the decay will behave like an exponential decay. Setting a small max-pool-size may cause excessive object destruction (and as a result excessive object creation) as instances will be destroyed from the pool if the current pool size exceeds max-pool-size.
- Read only entity beans: If you have a regular BMP bean that never updates the database, try using a read-only bean in its place. By default, a read-only bean will work correctly only if the database row(s) represented by this bean are not being changed in the background. In the Sun ONE application server, read-only beans are supported only for bean managed persistence (BMP). A read-only bean never updates the database (i.e., ejbStore is never called). Consequently, there is a significant performance gain between a BMP bean and a read-only bean. If a read-only bean's method is accessed with a transaction (because the method descriptor in ejb-jar.xml is TX_REQUIRED or TX_REQUIRES_NEW), the ejbLoad() is always called. You may want to access a read-only bean method with a transaction if you want the cached data to always be in sync with the database. Its the non-transactional accesses where read-only beans perform at their best by avoiding the overhead of ejbLoad(). An important tunable to consider in this case is refresh-period-in-seconds. The current implementation of the container for these beans is a pull-cache, i.e. if for any beans instance, more than refresh-period-in-seconds time has passed, a user access to this bean instance will first invoke a ejbLoad() on the bean before executing any business methods. Tune this time to an appropriate value, typically in minutes, where you anticipate the data to change. A good example is when hosting a stock quote with 5 minute periods, i.e. 300 seconds set as the refresh-period-in-seconds.
- Message driven beans: The container of these beans is a bit different than the ones for the entity and session beans. In the MDB container of the current version of the application server, session and threads are attached with the beans in the MDB pool. This is a good pattern to pool the threads for executing message driven requests in the container. Thus the bean pool should be given an appropriate value, considering all the parameters of the server (taking other applications into perspective). e.g. values greater than 500 will be inappropriate.
The following figure shows the Administration interface for tuning the pool for message driven beans.
Figure 4-18 Configuring Message Driven Bean Container using the Administration Interface
Related Considerations
Here are related considerations to keep in mind when using EJB’s.
An EJB can have remote and local interfaces. Remote clients which are not co-located in the same application server instance use the remote interface to access the bean. Calls to the remote interface are more expensive as it involves argument marshalling, transportation of the marshalled data over the network and unmarshaling and dispatch at the receiving end. Local clients which are co-located in the same application server instance can use the local interface of a bean if provided. Using the local interface is more efficient as it does not involve any argument marshalling, transportation and unmarshalling. The arguments are passed by reference and this means that the passed objects are shareable by the caller and callee (hence they need to be implemented appropriately so that they are shareable). If a bean is written to be used only by co-located clients then it makes sense to just provide the local interface for the bean and have the clients use the local interface. If on the other hand the bean is to be written in a location independent manner then both the remote and local interface can be provided so that remote clients use the remote interface and local clients can use the local interface for efficiency.
- The application predates EJB 2.0 specification and was written without any local interfaces.
- There are bean to bean calls and the client beans are written without making any co-location assumptions about the called beans.
For these cases Sun ONE Application Server 7.0 provides a pass-by-reference option which can be used to indicate that when making calls to the remote interface of the bean a co-located client can pass arguments by reference. By default Sun ONE Application Server uses pass-by-value semantics for calling the remote interface of a bean even if it is co-located. This can be quite expensive as pass-by-value semantics involves making copies of the argument before passing them. The pass-by-reference option can be specified at the entire application level or on a per bean basis. If if is specified at the application level then pass-by-reference semantics is used when passing arguments to the remote interface of all beans in the application. If this option is specified at a bean level then calls to the remote interface of the specified bean use the pass-by-reference semantics. Please refer to Sun ONE Application Server EJB Developers guide and Sun ONE Application Server Developers guide for more details about the pass-by-reference flag.
Commit Options
Commit option controls the action taken by the container on a bean when the transaction that the bean participated completes. Commit option has no effect on the bean code (the bean developer need not worry about the commit options). Commit option, however, has a significant impact on performance.
Sun ONE Application Server supports commit option B and commit option C.
Before we explain when to use the various commit options, let us describe what the container does when these commit options are used.
In Commit option B, when a transaction completes, the bean is kept in the cache and retains its identity. This means that the next invocation for the same primary key can use the instance that is in the cache. Of course, the bean's ejbLoad will be called before the method invocation to sync up with the database.
In case of Commit option C, when a transaction completes, the bean's ejbPassivate() method is called, then the bean is disassociated from its primary key and then it is returned to the free pool.This means that the next invocation for the same primary key will have to grab a free bean from the pool, set the PrimaryKey on this instance, and then call ejbActivate on the instance. Again, the bean's ejbLoad will be called before the method invocation to sync up with the database.
It is clear that Commit Option B avoids ejbAcivate and ejbPassivate calls. So, in most cases commit option-B should perform better than commit option-C since it avoids ejbActivate, ejbPassivate and some overhead in acquiring and releasing objects back to pool. However, there are some cases where commit option-C can do better. If the beans in the cache are very rarely reused and if beans are constantly added to the cache, then it makes no sense to cache beans.
Commit option C does exactly that. When commit option C is used, the container puts beans back into the pool (instead of caching the instance) after method invocation or on transaction completion. This way instances are reused better and the number of live objects in the VM is reduced resulting in smaller GC cycle.
How would you decide whether to use Commit option B or commit option C? First take a look at the cache-hits value using the monitoring command for the bean. If the cache-hits are very high compared to cache-misses, then commit-B option is an appropriate choice. You may still have to change the max-cache-size and cache-resize-quantity to get the best result. If the cache hits are too low and cache misses are very high, then the application is not reusing the bean instances and hence increasing the cache size (using max-cache-size) will not help (assuming that the access pattern remains the same). In this case you may want to use commit option-C. If there is no great difference between cache-hits and cache-misses then you may have to tune max-cache-size, and probably cache-idle-timeout-in-seconds.
The following figure shows the commit option settings.
Figure 4-19 Commit Option Settings
At any given instance of time, if monitoring is enabled for ejb-container, the statistics for the individual beans can be examined and analyzed based on the bean pool and cache settings can be tuned. The pool settings are valid for stateless session and entity beans while the cache settings are valid for stateful session and entity beans. The configuration for the container can be done at the server instance level, via setting the properties in the server.xml file. These values can be overwritten by specifying the values for the individual beans in the sun-ejb-jar.xml. For a description of the tunables below, please refer to the EJB Descriptor Properties. section.
The settings that can be specified at the server instance level are:
The settings for the pool that can be specified at the bean level are:
The settings for cache that can be specified at the bean level are:
The monitoring command below gives the Bean Cache statistics for a stateful session bean. The following is a sample of the monitoring output:
$./asadmin get --user admin --password netscape --host e4800-241-a --port 4848 -m specjcmp.application.SPECjAppServer.ejb-module.supplier_jar.statefu l-session-bean.BuyerSes.bean-cache.*
resize-quantity = -1
cache-misses = 0
idle-timeout-in-seconds = 0
num-passivations = 0
cache-hits = 59
num-passivation-errors = 0
total-beans-in-cache = 59
num-expired-sessions-removed = 0
max-beans-in-cache = 4096
num-passivation-success = 0
The monitoring command below gives the bean pool statistics for a Entity bean:
$./asadmin get --user admin --password netscape --host e4800-241-a --port 4848 -m specjcmp.application.SPECjAppServer.ejb-module.supplier_jar.statefu l-entity-bean.ItemEnt.bean-pool.*
idle-timeout-in-seconds = 0
steady-pool-size = 0
total-beans-destroyed = 0
num-threads-waiting = 0
num-beans-in-pool = 54
max-pool-size = 2147483647
pool-resize-quantity = 0
total-beans-created = 255
The monitoring command below gives the bean pool statistics for a stateless bean.
$./asadmin get --user admin --password netscape --host e4800-241-a --port 4848 -m test.application.testEjbMon.ejb-module.slsb.stateless-session-bean. slsb.bean-pool.*
idle-timeout-in-seconds = 200
steady-pool-size = 32
total-beans-destroyed = 12
num-threads-waiting = 0
num-beans-in-pool = 4
max-pool-size = 1024
pool-resize-quantity = 12
total-beans-created = 42
Tuning the bean involves charting out the behavior of the cache and pool for the bean in question over a period of time. Some of the observations that can be made are:
If too many GCs are happening and the pool size is growing, but the cache hit rate is small, then the pool-idle-timeout-in-seconds can be reduced to destroy the instances.
ORB TuningThe Sun ONE Application Server includes a high performance and scalable CORBA ORB (Object Request Broker). The ORB is the foundation of the EJB Container on the server. Most of the functionality of the ORB is utilized when exercising Enterprise Java Beans via:
When a connection is made from a server instance to another server instance ORB, the first instance starts and acts as a client-side ORB. SSL over IIOP uses an optimized transport that is one of the fastest, and utilizes native implementations of cryptography algorithms to deliver high performance.
How a Client Connects to the ORB
A rich client Java program performs a new initialContext() call which creates a client side ORB instance. This in turn creates a socket connection to the Sun ONE Application Server IIOP port. The reader thread is started on the server ORB to service IIOP requests from this client. Using the initialContext, the client code does a lookup of an EJB deployed on the server. An IOR which is a remote reference to the deployed EJB on the server is returned to the client. Using this object reference, the client code invokes remote methods on the EJB.
InitialContext lookup for the bean and the method invocations translate the marshalling application request data in Java into IIOP message(s) that are sent on the socket connection that was created earlier on to the server ORB. The server then creates a response and sends it back on the same connection. This data in the response is then unmarshalled by the client ORB and given back to the client code for processing. The Client ORB shuts down and closes the connection when the rich client application exits.
Performance Tuning the ORB
A user may want to change the default setting, as well as add some non-standard options in order to derive certain behavior from the configuration such as high performance and scalability. The main components of the ORB that can be tuned are:
Response time can be decreased by leveraging load-balancing, multiple shared connections, finely tuned server thread pool and message fragment size. Scalability can be achieved by using multiple ORB servers and load balancing between them from the client, and tuning the number of connection between the client and the server(s).
ORB Tunables
The following sets of tunables are available on the ORB:
- Inter-ORB Communication Infrastructure: The infrastructure allows for tuning the message size, load balancing (in cases of heavy load), better throughput, and high performance.
- Server ORB Thread Pool: The ORB thread pool facilitates quick and simultaneous job execution through configuration-controlled multi-threading. Pooling threads mean that one can avoid overheads such as thread creation, thread stack allocation, associated GC, etc. In some cases, excessive thread creation and removal can lead to OutOfMemoryError, which the thread pool prevents, by providing thresholds.
The ORB thread pool contains a task queue and a pool of threads. Tasks or jobs are inserted into the task queue and free threads pick tasks from this queue for execution. It is not advisable to always size a thread pool size such that the task queue is always empty. It is normal for an intense application to have 1:10 ratio of 'current task queue size': max-thread-pool-size at any time. The thread pool has capability to shrink to the steady size if current size is larger and when max-thread-pool-size > steady-thread-pool-size is the configured setting. The steady-thread-pool-size should be set to the average number of threads needed at a steady (RMI/ IIOP) load.
In the current Application Server version, the ORB thread pool is used in two main activities:
Thus even when one is not using ORB for remote-calls (i.e. via RMI/ IIOP), the thread pool should be sized so that cleaning-up activity of the EJB pools and caches can be facilitated.
ORB Properties
The properties for tuning the ORBcan be managed using the Administration interface.
Figure 4-20 Tuning the ORB Properties using the Administration Interface
The following standard properties are available to tune on the ORB:
- message-fragment-size: CORBA GIOPv1.2 messages (15.4.9) larger than this size in bytes will be fragmented. All sizes should be multiples of 8. In GIOP v1.2, a Request, Reply, LocateRequest and LocateReply message can be broken into multiple fragments. The first message is a regular Request or Reply message with more fragments bit in the flags field set to true. When inter-ORB messages are mostly larger than the default size (1024 bytes), one can increase this size to decrease latencies on the network due to fragmentation.
- steady-thread-pool-size: The minimum number of threads in the ORB thread pool, should be close to the active number of thread needed to work on requests (and EJB cleanup) at server's steady state (i.e. in steady load conditions).
- max-thread-pool-size: The maximum number of threads in the ORB thread pool.
- idle-thread-timeout-in-seconds: Timeout when an idle thread is removed from pool. Allows shrinking of the thread pool.
- max-connections: Maximum number of incoming connections at any time, on all listeners. Protects the server state by allowing finite number of connections. This value equals also the the maximum number of threads that will be actively reading from the connection.
- iiop-listener: Property to add a listener (SSL/ HTTP) to the ORB, specifying the listener host and port. An enabled ORB listener translates to a thread actively listening on the server socket for incoming connection connect requests.
The following figure shows the Administration interface for the IIOP listener.
Figure 4-21 Tuning the ORB Listener using the Administration Interface
Non-standard ORB Properties and Functionality
The following values are specified as -D arguments when launching the client program:
Controlling connections between client and server ORB
When using the default JDK ORB on the client, a connection is established from the client ORB to the application server ORB every time an initial context is created. One may wish to pool or share these connections when they are opened from the same process by adding to the configuration on the client ORB -
-Djava.naming.factory.initial=com.sun.appserv.naming.S1ASCtxFactory
Using multiple connections for better throughput
When using the Sun One context factory, (com.sun.appserv.naming.S1ASCtxFactory) an important tunable is to specify the number of connections to open to the server from the client ORB (default is 1). This feature is seen to produce better throughput to and from the server for network intense application traffic. The configuration changes are specified on the client ORB(s) by adding the following jvm-options:
-Djava.naming.factory.initial=com.sun.appserv.naming.S1ASCtxFactory
-Dcom.sun.appserv.iiop.orbconnections=[number]
Load balancing on server-side using configured DNS
One or multiple client ORBs can balance the load by utilizing a specially configured DNS. This DNS is configured such that it internally contains a list for a given host-name, so that every time an nslookup call is made, it iterates on the list of IP-addresses, giving intrinsic load balancing feature. The user can also use the connection pool specified in section 2.3.2 to specify the number of connections to use. The configuration changes are specified on the client ORBs by adding the following jvm-options:
-Djava.naming.factory.initial=com.sun.appserv.naming.S1ASCtxFactory
-Djava.naming.provider.url.pkgs=com.sun.enterprise.naming
-Djava.naming.provider.url=iiop://${SERVER_HOST}:${ORB_PORT}
Load-balancing on server-side using client configured server instances
One or multiple client ORBs can balance the load by a simple round-robin scheme on multiple ORB listeners (or multiple distinct ORB processes). This configuration is recommended in B2B scenarios, where there are controlled number of clients generating load on the server(s) via the RMI/ IIOP path. The user can also use the connection pool specified in section 2.3.2 to specify the number of connections to use. The configuration changes are specified on the client ORBs by adding the following jvm-options:
-Djava.naming.factory.initial= com.sun.appserv.naming.S1ASCtxFactory
-Djava.naming.provider.url.pkgs=com.sun.enterprise.naming 5.
-Dcom.sun.appserv.iiop.loadbalancingpolicy=roundrobin,host1:port1,h ost2:port2,... ,host[n]:port[n]
High performance CORBA Util Delegate class
When using JDK-bundled ORB or Sun ONE Application Server ORB, users can benefit from a high performance CORBA Util Delegate implementation, that can be used by adding to the configuration (server.xml)
<jvm-options>-Djavax.rmi.CORBA.UtilClass=com.iplanet.ias.util.orbut il.IasUtilDelegate</jvm-options>
An important consideration when tuning the client ORB for load-balancing and connections, is to consider the number of connections opened on the server ORB. It is always advisable to start from a lower number of connections and grow upwards to observe any performance benefits. A connection to the server translated to an ORB thread reading actively from the connection (these threads are not pooled, but exist currently for the lifetime of the connection).
Guide to using Tunables
The following table helps you identify the ORB modules and Server tunables involved in tuning your application.
Thread Pool Sizing
After examining the number of inbound and outbound connections as explained above, users can tune the size of the thread pool appropriately. This can affect performance and response times to a large degree.
The size computation should take into account the number of client requests to be processed concurrently, the resource (number of cpus/memory) available on the machine and the response times required for processing the client requests. Setting the size to a very small value can affect the ability of the server to process requests concurrently thus affecting the response times of requests as they will be sitting longer in the task queue waiting for a worker thread to process it. On the other hand having a large number of worker threads to service requests can also be detrimental because more system resources are used up because of the large number of threads, which- increases concurrency. This can mean that threads take longer to acquire shared structures in the EJB container, thus affecting response times The Worker thread pool is also used for the EJB containers house keeping activity such as trimming the pools and caches. This activity needs to be accounted for also when determining the size.
Having too many ORB worker threads is detrimental for performance since the server has to maintain all these threads. The idle threads are destroyed after the idle-thread-time-out-in-seconds. Below is a snipet from the server.xml. This includes the section for iiop-service.
<iiop-service>
<orb message-fragment-size=1024
steady-thread-pool-size=10
max-thread-pool-size=200
idle-thread-timeout-in-seconds=300
max-connections=1024
monitoring-enabled=false />
<iiop-listener id=orb-listener-1 address=0.0.0.0 port=3700 enabled=true>
</ioop-listener>
Related ConsiderationsPlease refer to the Performance Tuning the EJB Container section for Pass-by-value vs Pass-by-reference semantics considerations.
Examining IIOP Messages
It is sometimes useful to examine the contents of the IIOP messages being passed by the Sun ONE Application Server. The option -Dcom.sun.CORBA.ORBDebug=giop can be passed as jvm-options in server.xml to get dumps of the messages. The dumps are produced in server.log. The same option can also be used on the client ORB.
A sample output is as follows:
[29/Aug/2002:22:41:43] INFO (27179): CORE3282: stdout: ++++++++++++++++++++++++++++++
[29/Aug/2002:22:41:43] INFO (27179): CORE3282: stdout: Message(Thread[ORB Client-side Reader, conn to 192.18.80.118:1050,5,main]):
createFromStream: type is 4 <
[29/Aug/2002:22:41:43] INFO (27179): CORE3282: stdout: MessageBase(Thread[ORB Client-side Reader, conn to 192.18.80.118:1050,5,main]): Message GIOP version: 1.2
[29/Aug/2002:22:41:43] INFO (27179): CORE3282: stdout: MessageBase(Thread[ORB Client-side Reader, conn to 192.18.80.118:1050,5,main]): ORB Max GIOP Version: 1.2
[29/Aug/2002:22:41:43] INFO (27179): CORE3282: stdout: Message(Thread[ORB Client-side Reader, conn to 192.18.80.118:1050,5,main]): createFromStream: message construction complete.
[29/Aug/2002:22:41:43] INFO (27179): CORE3282: stdout: com.sun.corba.ee.internal.iiop.MessageMediator(Thread[ORB Client-side Reader, conn to 192.18.80.118:1050,5,main]): Received message:
[29/Aug/2002:22:41:43] INFO (27179): CORE3282: stdout: ----- Input Buffer -----
[29/Aug/2002:22:41:43] INFO (27179): CORE3282: stdout: Current index: 0
[29/Aug/2002:22:41:43] INFO (27179): CORE3282: stdout: Total length : 340
[29/Aug/2002:22:41:43] INFO (27179): CORE3282: stdout: 47 49 4f 50 01 02 00 04 0 0 00 01 48 00 00 00 05 GIOP.......H....
Note
The flag -Dcom.sun.CORBA.ORBdebug=giop generates many debug messages in the logs. This should be used only when the user suspects message fragmentation.
Fragmented Messages
In this sample output above, the "createFromStream" type is shown as 4. This implies that the message is a fragment of a bigger message. One could change the fragment size to avoid fragmented messages. This would mean that messages would be sent as one unit and not as fragments thus saving the overhead of sending multiple messages and corresponding processing at the receiving end to piece the messages together. It might be more efficient to increase the fragment size if most messages being sent in the application turn out to be fragmented because of a low fragment size specification. On the other hand if only a few messages are fragmented, it might be more efficient to have a lower fragment size as this would mean smaller buffers would be allocated for writing messages and only the occasional message would end up getting fragmented.
Local Interfaces for EJB's
It is important to remember that the ORB is not used when using Local Interfaces for EJB's. In this situation, all arguments are passed by reference and no object copying is involved.
Tuning the Transaction ManagerA distributed transactional system writes transactional activity into transaction logs so that they can be recovered later. But writing transactional logs will have some performance penalty. This property can be used to disable the transaction logging, where the performance is of utmost importance more than the recovery. This property, by default, won’t exist in the server.xml.
The automatic-recovery and key-point-interval attributes have an impact on performance when using the transaction manager. When automatic-recovery is set to true, disable-distributed-transaction-logging will not be considered and transaction logging will always happen. If automatic-recovery is set to false, disable-distributed-transaction-logging will be considered to determine whether to write transaction logs or not.
automatic-recovery
This value, together with disable-distributed-transaction-logging attribute, has some impact on performance. Here is how it works.
- If automatic-recovery is true, transaction logs will always be written.
- If automatic recovery is false and disable-distributed-transaction-logging is off (default case), then the logs will be written.
- If automatic recovery is false and disable-distributed-transaction-logging is on, then the transaction logs will not be written. This will give approximately 20% improvement in performance but at the cost of not recovering as there won't be any transaction logs. In other words, transaction logging in case 1and 2 results in approximately 20% impact. All these results apply only to global transactions intensive tests. Gains in real applications may be less.
keypoint-interval
The default value of this attribute is 2048. Key pointing prevents the physical log for a process from growing indefinitely by defining the frequency at which the log file may be cleaned up by removing entries for completed transactions. Frequent checkpointing is deritmental for performance. In most of the cases, the default value is good enough.
The following figure shows the Administration interface for configuring the transaction manager.
Figure 4-22 Tuning the Transaction Service using the Administration Interface
Transaction Manager Monitoring
Users can monitor the Transaction Manager to obtain performance statistics. To generate these statistics, use the following command using the asadmin utility:
asadmin>export AS_ADMIN_USER=admin AS_ADMIN_PASSWORD=password AS_ADMIN_HOST=localhost
asadmin>get -m server1.transaction-service.*The following is the sample output of the above command:
********** Stats for JTS ************
total-tx-completed = 244283
total-tx-rolled-back = 2640
total-tx-inflight = 702
isFrozen = False
inflight-tx =
Transaction Id , Status, ElapsedTime(msec)000000000003C95A_00, Active, 999
References
- For details on profiling, see the Sun ONE Application Server Developer’s Guide, chapter on Developing J2EE Applications; specifically the section titled Profiling Tools.
- For more details on SNMP monitoring see the Sun ONE Application Server Administrator’s Guide, the chapter on Monitoring and Managing Sun ONE Applications.
- for more details on the server.xml file see the Sun ONE Application Server Configuration File Reference