 To Connect to Your Node Agents
When the Monitoring Console is started for the first time, you must indicate where your monitored components are hosted. You specify the location of each node agent in your Java ES deployment, and the console will automatically display all of the components in each node agent. You will also need to repeat this procedure if you later add Java ES components to your deployment by installing them on new hosts.
Once you add a node agent, the Monitoring Console will reconnect to it every time you access the console until you remove it explicitly. If a node agent you previously added is not responding, follow the procedure To Restart a Node Agent.
-
Synchronize the date and time between the logical host where the Monitoring Console is installed and the host containing the node agent and Java ES components you wish to monitor. Regardless of whether you synchronize automatically or manually, the time on each host must be within approximately 10 minutes of each other.
-
If necessary, navigate to the Deployment level display by clicking the “Deployment” link at the root of the hierarchy in the left-hand side of the Monitoring Console. Now select the Hosts tab in the right-hand pane and click Add.
-
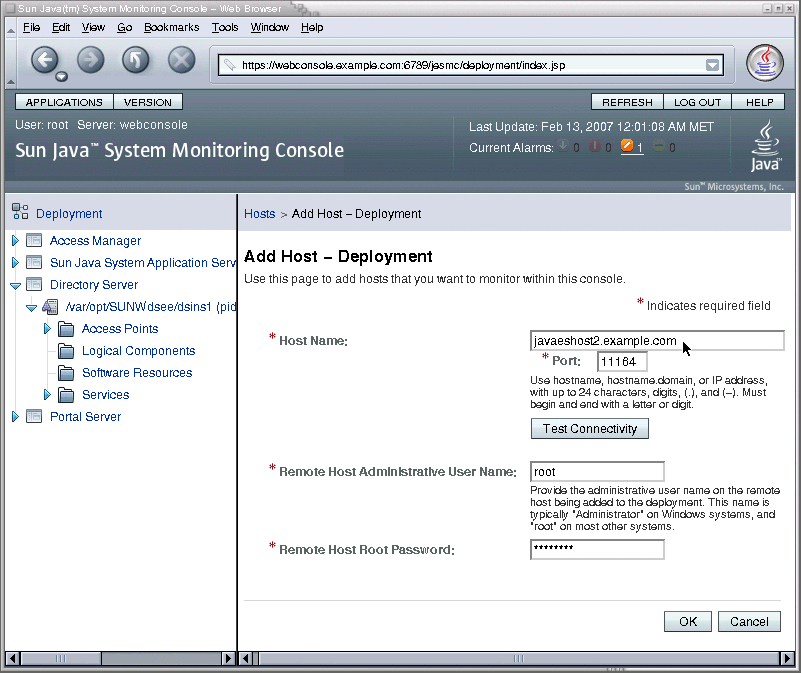
In the Add Host dialog that appears, enter the required information as shown in the following screen capture:

-
Host Name: enter the fully qualified host name of a node agent where you have configured monitored components.
-
Port: 11164, unless you have otherwise configured the Monitoring Framework on the host where the node agent resides.
-
Remote Host Root Password: enter the root password for the system where the node agent resides.
-
-
Click Test Connectivity.
If the connection information is correct and your host agent is configured and running, the dialog will indicate that it is now connected.
-
Click OK to finish the Add Host dialog, and the new name appears in the list of Hosts. All of the monitored components in that host's node agent now appear in the left column as well.
-
Repeat this procedure for every host in your Java ES deployment where monitored components are installed.
Next Steps
You can now browse the components listed in the left-hand column to view their operational status, the monitored attributes they expose, and any alarms they have triggered.
- © 2010, Oracle Corporation and/or its affiliates
