| C H A P T E R 2 |
|
Diagnostics |
This chapter describes the diagnostics that are available for monitoring and troubleshooting the Sun Blade T6340 server module. This chapter is intended for technicians, service personnel, and system administrators who service and repair computer systems.
The following topics are covered:
There are a variety of diagnostic tools, commands, and indicators you can use to monitor and troubleshoot a Sun Blade T6340 server module.
The LEDs, ILOM, Solaris OS PSH, and many of the log files and console messages are integrated. For example, when the Solaris software detects a fault, it will display the fault, log it, pass information to ILOM where the fault is logged, and depending on the fault, one or more LEDs might be illuminated.
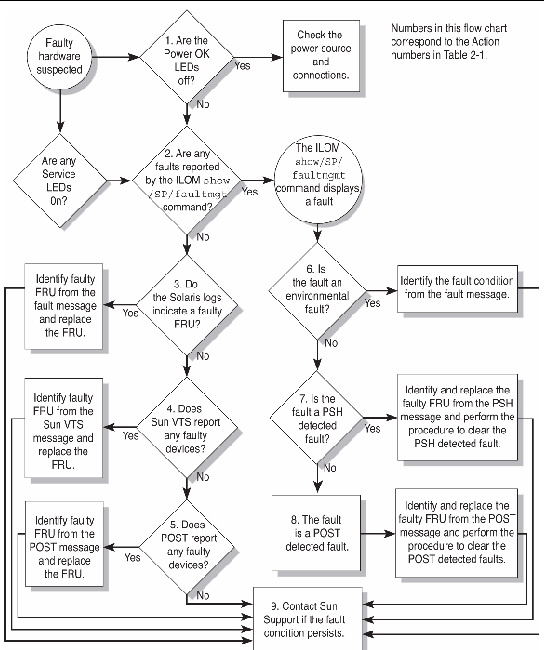
The diagnostic flowchart in FIGURE 2-1 and TABLE 2-1 describes an approach for using the server module diagnostics to identify a faulty field-replaceable unit (FRU). The diagnostics you use, and the order in which you use them, depend on the nature of the problem you are troubleshooting, so you might perform some actions and not others.
Use this flowchart to understand what diagnostics are available to troubleshoot faulty hardware, and use TABLE 2-1 to find more information about each diagnostic in this chapter.
FIGURE 2-1 Diagnostic Flowchart
|
The OK LED is located on the front of the Sun Blade T6340 server module. If the LED is not lit, check that the blade is properly connected and the chassis has power. |
|||
|
The faultmgmt command displays the following types of faults: Faulty FRUs are identified in fault messages using the FRU name. For a list of FRU names, see TABLE 1-3. |
|||
|
The Solaris message buffer and log files record system events and provide information about faults.
|
Section 2.8, Collecting Information From Solaris OS Files and Commands |
||
|
SunVTS can exercise and diagnose FRUs. To run SunVTS, the server module must be running the Solaris OS.
|
|||
|
POST performs basic tests of the server module components and reports faulty FRUs.
|
|||
|
If the fault listed by the show faulty
|
|||
|
If the fault message displays the following text, the fault was detected by the Solaris Predictive Self-Healing software:
If the fault is a PSH detected fault, identify the faulty FRU from the fault message and replace the faulty FRU. After the FRU is replaced, perform the procedure to clear PSH detected faults. |
Section 2.7, Using the Solaris Predictive Self-Healing Feature Section 4.2, Common Procedures for Parts Replacement |
||
|
POST performs basic tests of the server module components and reports faulty FRUs. When POST detects a faulty FRU, it logs the fault and if possible takes the FRU offline. POST detected FRUs display the following text in the fault message: FRU-name deemed faulty and disabled In this case, replace the FRU and run the procedure to clear POST detected faults. |
|||
|
The majority of hardware faults are detected by the server module diagnostics. In rare cases it is possible that a problem requires additional troubleshooting. If you are unable to determine the cause of the problem, contact Sun for support. |
Sun Support information:
|
This section describes how the memory is configured and how the server module deals with memory faults.
The Sun Blade T6340 server module has 32 connectors (slots) that hold fully-buffered DIMMs (FB-DIMMs) in the following FB-DIMM capacities:
The Sun Blade T6340 server module performs best if all 32 connectors are populated with 32 identical DIMMs. This configuration also enables the system to continue operating even when a DIMM fails, or if an entire channel fails.
| Note - All installed FB-DIMMs will be seen by the system as having the capacity of the smallest installed FB-DIMM. |
For example, suppose that you have installed 32 8-Gbyte FB-DIMMs for a total of 256 Gbytes of memory. If you were to replace one of those 8-Gbyte FB-DIMMs with a functioning 1-Gbyte FB-DIMM, the system will now treat all installed FB-DIMMs as 1 Gbyte FB-DIMMs and thus see only 32 Gbytes of installed memory, .

|
Caution - The following FB-DIMM rules must be followed. The server module might not operate correctly if the FB-DIMM rules are not followed. Always use FB-DIMMs that have been qualified by Sun. |
Use these FB-DIMM configuration rules to help you plan the memory configuration of your server:
See Section 4.3.1, Removing the DIMMs for DIMM installation instructions.
FIGURE 2-2 DIMM Installation Rules
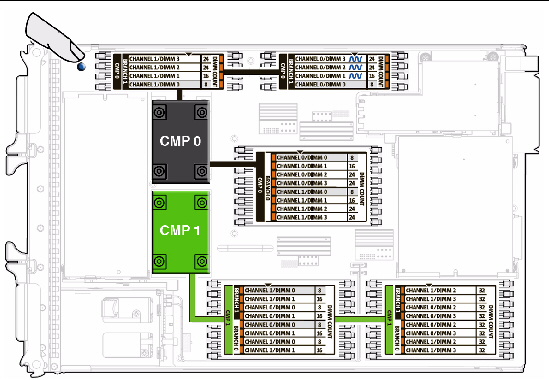
You can also use TABLE 2-2 to identify the DIMMs you want to remove.
|
FB-DIMM Installation Order[1] |
|||||
|---|---|---|---|---|---|
The Sun Blade T6340 server module uses advanced ECC technology, also called chipkill, that corrects up to 4-bits in error on nibble boundaries, as long as they are all in the same DRAM. If a DRAM fails, the DIMM continues to function.
| Note - The chipkill function is only supported on DIMMs that use “x4” DRAMs. |
The following server module features manage memory faults independently.
If a memory fault is detected, POST displays the fault with the FRU name of the faulty DIMMs, logs the fault, and disables the faulty DIMMs by placing them in the Automatic System Recovery (ASR) blacklist. For a given memory fault, POST disables half of the physical memory in the system. When this occurs, you must replace the faulty DIMMs based on the fault message and enable the disabled DIMMs with the ILOM command set /SYS/component component_state=enabled .
If you suspect that the server module has a memory problem, follow the flowchart (FIGURE 2-1). Type the ILOM command: show faulty . The faultmgmt command lists memory faults and lists the specific DIMMs that are associated with the fault. Once you have identified which DIMMs to replace, see Chapter 4 for DIMM removal and replacement instructions. You must perform the instructions in that chapter to clear the faults and enable the replaced DIMMs.
The Sun Blade T6340 server module has LEDs on the front panel and the hard drives. The behavior of LEDs on your server module conforms to the American National Standards Institute (ANSI) Status Indicator Standard (SIS). These standard LED behaviors are described in TABLE 2-3.
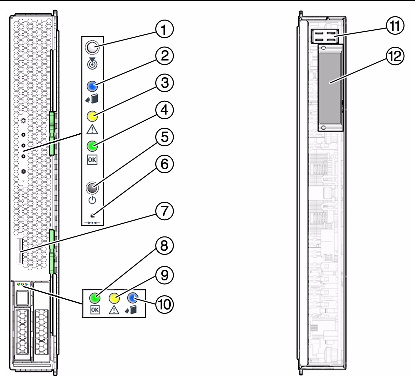
The front panel LEDs and buttons are located in the center of the server module (TABLE 2-4, and TABLE 2-5). The functions of their respective devices are displayed as follows:
The front panel LEDs on the Sun Blade T6340 are shown in FIGURE 2-3:
FIGURE 2-3 Front Panel and Hard Drive LEDs
|
Turns the host system on and off. Use a non-conductive stylus to completely press this button. |
||
For information about Ethernet LEDs see the service manual for your modular system chassis or ethernet device at:
http://docs.sun.com/app/docs/prod/blade.6000mod
The Oracle Integrated Lights Out Manager (ILOM) is contained on firmware on the service processor in the Sun Blade T6340 server module. ILOM enables you to remotely manage and administer your server module.
| Note - ILOM also contains an ALOM-CMT compatibility shell. For more information about ALOM-CMT compatibility see the Sun Integrated Lights Out Manager 2.0 Supplement for Sun Blade T6340 Server Modules, 820-3904. Appendix G of this service manual also provides some information about the ALOM CMT CLI. |
ILOM enables you to run remote diagnostics such as power-on self-test (POST), that would otherwise require physical proximity to the server module serial port. You can also configure ILOM to send email alerts of hardware failures, hardware warnings, and other events related to the server module or to ILOM.
The ILOM circuitry runs independently of the server module, using the server module standby power. Therefore, ILOM firmware and software continue to function when the server module operating system goes offline or when the server module is powered off.
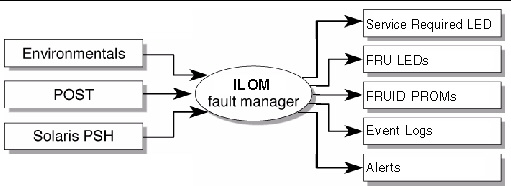
Faults detected by ILOM, POST, and the Solaris Predictive Self-healing (PSH) technology are forwarded to ILOM for fault handling (FIGURE 2-4).
In the event of a system fault, ILOM ensures that the Service Action Required LED is lit, FRU ID PROMs are updated, the fault is logged, and alerts are displayed (faulty FRUs are identified in fault messages using the FRU name. For a list of FRU names, see TABLE 1-3).
FIGURE 2-4 ILOM Fault Management
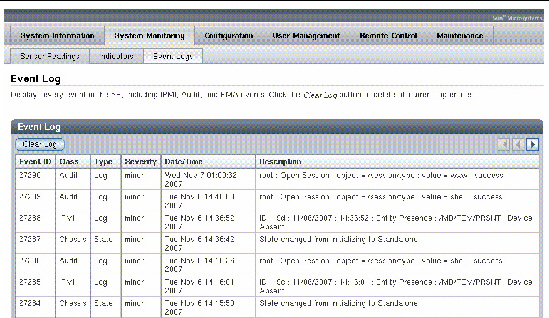
In ILOM you can view the ILOM logs to see alerts. FIGURE 2-5 is a sample of the ILOM web interface. Using the CLI you can type the show /SP/logs/event/list/ command.
FIGURE 2-5 Sample Event Log in ILOM Web Interface
ILOM can detect when a fault is no longer present and clears the fault in several ways:
Many environmental faults can automatically recover. For example, a temperature that is exceeding a threshold might return to normal limits when you connect a fan. The recovery of environmental faults is automatically detected. Recovery events are reported using one of two forms:
There are three thresholds for an environmental fault:
Environmental faults can be repaired through hot removal of the faulty FRU. The FRU removal is automatically detected by the environmental monitoring and all faults associated with the removed FRU are cleared. The message for that case, and the alert sent for all FRU removals is:
fru at location has been removed.
These instructions use the ILOM web interface. To use the command line interface (CLI), see Appendix G of this manual, the ILOM documentation collection.
1. Connect to the ILOM web interface by typing the IP address for the Sun Blade T6340 server module service processor in a web browser.
If you do not know the IP address for the server module, you can obtain the service processor IP address from the following:
2. Type the username and password to access the diagnostics menus in the ILOM web interface. The default user name is root, and the default password is changeme.
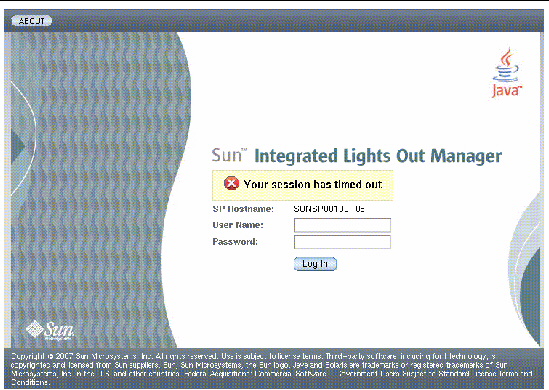
ILOM displays the following faults with the web interface and CLI:
Use the web interface or type the show faulty command for the following reasons:
In the ILOM web interface, you can view the system components currently in a fault state using the Fault Management page.
FIGURE 2-7 Fault Management Page Example
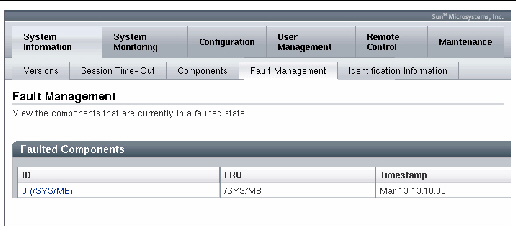
The Fault Management page lists faulted components by ID, FRU, and TimeStamp. You can access additional information about the faulted component by clicking the faulted component ID. For example, if you clicked the faulted component ID, 0 SYS/MB/, a dialog window similar to the following one appears, displaying additional details about the faulted component.
FIGURE 2-8 Faulted Component ID Window

Figure shows the Fault Properties Dialog screen.
Alternatively, in the ILOM web interface, you can identify the fault status of a component on the Component Management page.
FIGURE 2-9 Component Management Page - Fault Status
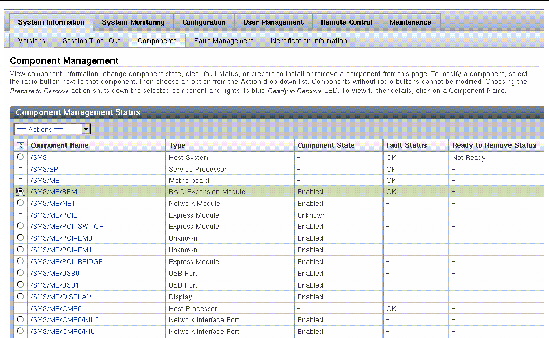
In the ILOM CLI, you can view the fault status of component(s) by using the show command. For example:
The ILOM show command displays a snapshot of the server module environmental status. This command displays system temperatures, hard drive status, power supply and fan status, front panel LED status, voltage, and current sensors. The output uses a format similar to the Solaris OS command prtdiag (1M).
At the -> prompt, type the show command.
The output differs according to your system model and configuration.
| Note - Some environmental information might not be available when the server module is in standby mode. |
1. Open a web browser and type the IP address of the server module service processor in the browser.
2. Select the top System Monitoring tab and the lower Sensor Readings tab (FIGURE 2-10).
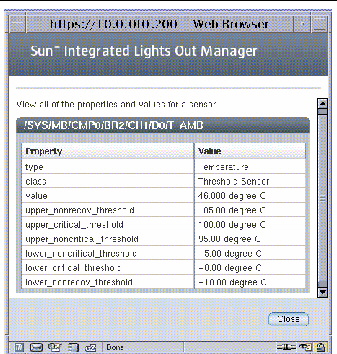
3. Click on the sensor reading that you want to check (FIGURE 2-10).
FIGURE 2-10 Obtaining Sensor Readings and Environmental Status With the ILOM Web Interface
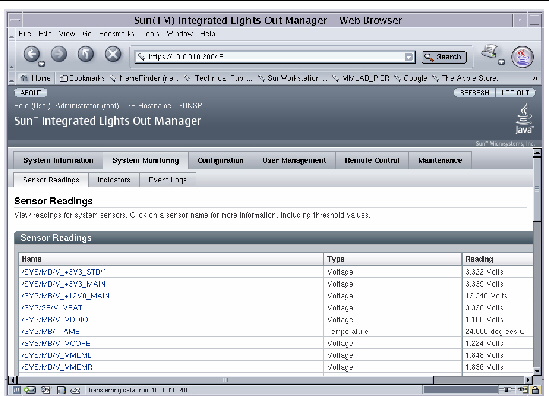
FIGURE 2-11 Sensor Reading Window for an FB-DIMM in Channel 1
ILOM can display static FRU information such as the FRU manufacturer, serial number and some FRU status information (FIGURE 2-12).
| Note - To view dynamic FRU information you must type the ALOM CMT showfru command. The dynamic FRU information provides more details about FRUs. |
1. Select the System Information and Components tabs.
2. Click on the component to view the FRU information (FIGURE 2-12).
FIGURE 2-12 Static FRU Information in the ILOM Web Interface
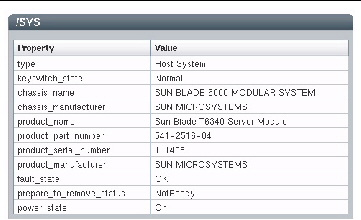
The show /SYS/MB command displays static information about the FRUs in the server module. Use this command to see information about an individual FRU.
 At the -> prompt, type the show command.
In the following example, the show command displays information about the motherboard (MB).
This example shows a portion of the more detailed dynamic FRU information provided by the ALOM CMT showfru command.
Use POST to test and verify server module hardware. Power-on self-test (POST) is a group of PROM-based tests that run when the server module is powered on or reset. POST checks the basic integrity of the critical hardware components in the server module (CPU, memory, and I/O buses).
If POST detects a faulty component, the component is disabled automatically, preventing faulty hardware from potentially harming any software. If the system is capable of running without the disabled component, the system will boot when POST is complete. For example, if one of the processor cores is deemed faulty by POST, that core will be disabled, and the system will boot and run using the remaining cores.
You can use POST as an initial diagnostic tool for the system hardware. In this case, configure POST to run in diagnostic service mode for maximum test coverage and verbose output.
| Note - Devices can be manually enabled or disabled using ASR commands (see Section 2.9, Managing Components With Automatic System Recovery Commands). |
The server module can be configured for normal, extensive, or no POST execution. You can also control the level of tests that run, the amount of POST output that is displayed, and which reset events trigger POST by using diag variables.
TABLE 2-6 lists the DIAG variables used to configure POST and FIGURE 2-13 shows how the variables work together.
|
The system can power on and run POST (based on the other parameter settings). For details see FIGURE 2-13. This parameter overrides all other commands. |
||
|
The system can power on and run POST, but no flash updates can be made. |
||
|
Runs POST with preset values for diag_level and diag_verbosity. |
||
|
If diag_mode = normal, runs all the minimum tests plus extensive CPU and memory tests. |
||
|
POST output displays functional tests with a banner and pinwheel. |
||
|
POST displays all test, informational, and some debugging messages. |
FIGURE 2-13 Flowchart of ILOM Variables for POST Configuration
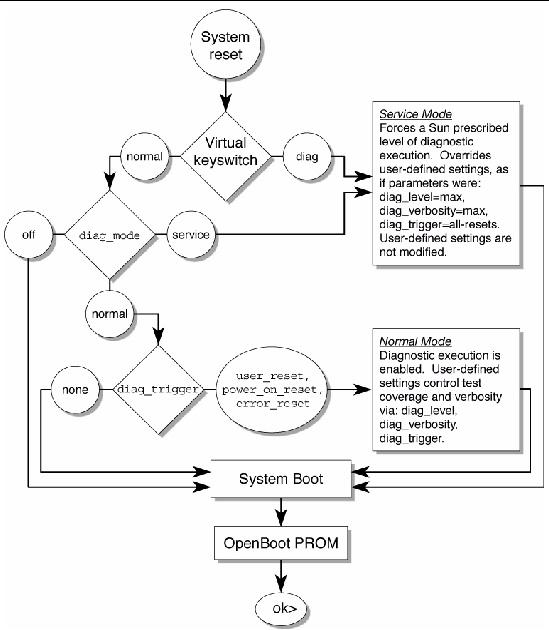
TABLE 2-7 shows typical combinations of ILOM variables and associated POST modes.
|
keyswitch_state[2] |
||||
|
This is the default POST configuration. This configuration tests the system thoroughly, and suppresses some of the detailed POST output. |
POST does not run, resulting in quick system initialization, but this is not a suggested configuration. |
POST runs the full spectrum of tests with the maximum output displayed. |
POST runs the full spectrum of tests with the maximum output displayed. |
You can use the web interface or the CLI to change the POST parameters.
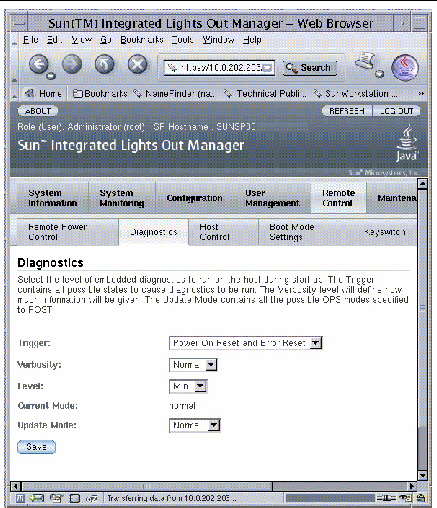
1. From the ILOM web interface, select the Remote Console tab (FIGURE 2-14).
2. Select the Diagnostics Tab.
3. Select the POST settings that you require.
TABLE 2-7 describes how the POST settings will execute.
| Note - If you do not have a console window open, you should open one. POST will only display output to a console window, not the web interface. |
FIGURE 2-14 Setting POST Parameters With the ILOM Web Interface
5. Select the Remote Power Control Tab.
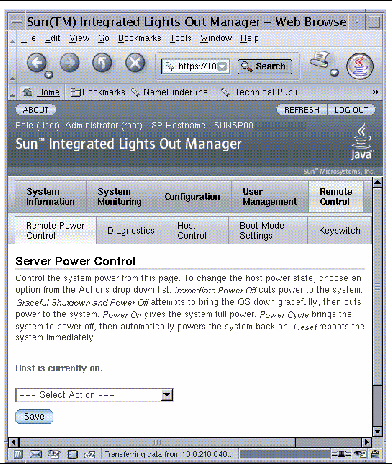
6. Select a power control setting and Select Save (FIGURE 2-15).
FIGURE 2-15 Changing Power Settings With the ILOM Web Interface
When you power cycle the server module, POST runs and displays output to the service processor console window:
7. Read the POST output to determine if you need to perform service actions.
See Section 2.6.3, Interpreting POST Messages.
1. Verify the current post parameters with the show command. Type:
-> show /HOST/diag /HOST/diag Targets: Properties: level = min mode = normal trigger = power-on-reset error-reset verbosity = normal Commands: cd set show -> |
2. Type the set command to change the POST parameters.
TABLE 2-7 describes how the POST settings will execute. This example shows how to set the verbosity to max.
3. Power cycle the server module to run POST.
There are several ways to initiate a reset. The following example uses the ILOM reset command.
4. Read the POST output to determine if you need to perform service actions. See Section 2.6.3, Interpreting POST Messages.
When POST is finished running and no faults were detected, the system will boot.
If POST detects a faulty device, the fault is displayed and the fault information is passed to ILOM for fault handling. Faulty FRUs are identified in fault messages using the FRU name. For a list of FRU names, see TABLE 1-3.
1. Interpret the POST messages:
POST error messages use the following syntax:
c:s > ERROR: TEST = failing-test
c:s > H/W under test = FRU
c:s > Repair Instructions: Replace items in order listed by H/W under test above
c:s > MSG = test-error-message
c:s > END_ERROR
In this syntax, c = the core number, s = the strand number.
Warning and informational messages use the following syntax:
The following example shows a POST error message report for a missing PCI device:
2. Type the show faulty command to obtain additional fault information.
The fault is captured by ILOM, where the fault is logged. The Service Action Required LED is lit, and the faulty component is disabled.
In this example, /SYS/MB/CMP0/BR0/CH0/D0 is disabled by a user. The system can boot using memory that was not disabled until the faulty component is replaced.
| Note - You can use ASR commands to display and control disabled components. See Section 2.9, Managing Components With Automatic System Recovery Commands. |
In most cases, when POST detects a faulty component, POST logs the fault and automatically takes the failed component out of operation by placing the component in the ASR blacklist.
See Section 2.9, Managing Components With Automatic System Recovery Commands).
After the faulty FRU is replaced, the fault is normally automatically cleared. In some cases it might be necessary to manually clear the fault by removing the component from the ASR blacklist.
This procedure describes how to enable components after a POST fault has been generated. The POST fault log is not actually cleared.
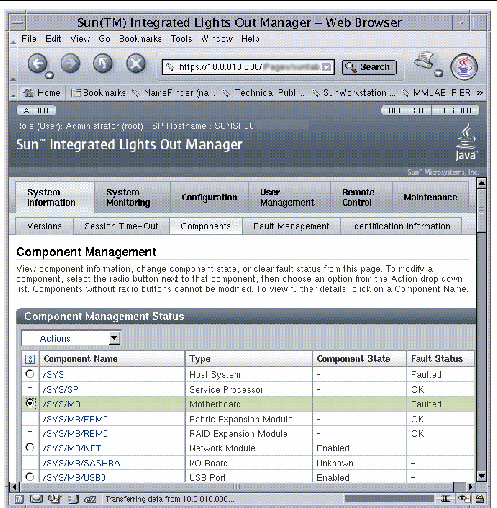
1. Select the tabs: System Information and Components tabs (FIGURE 2-16).
2. Select the radio button for the component that you must clear.
3. In the Actions menu, select: Enable Component.
FIGURE 2-16 Enabling Components With the ILOM Web Interface
| Note - The Clear Faults command in the Action menu will only clear the PSH-generated faults, and will not enable a component. |
1. At the ILOM prompt, type the show faulty command to identify POST detected faults.
POST detected faults are distinguished from other faults by the text:
deemed faulty and disabled, and no UUID number is reported.
2. Type the set component_state=enabled command to clear the fault and remove the component from the ASR blacklist.
Type the cd command with the FRU name that was reported in the fault in the previous step.
This example shows how to change directory to thread P32 on the CPU and enable it.
The fault is cleared and should not show up when you type the show faulty command. Additionally, the Service Action Required LED is no longer illuminated.
You must reboot the server module for the enablecomponent command to take effect.
4. At the ILOM prompt, type the show faulty command to verify that no faults are reported.
-> show faulty Last POST run: THU MAR 09 16:52:44 2006 POST status: Passed all devices No failures found in System |
The ILOM set /SYS/clear_fault_action=enabled command allows you to manually clear certain types of faults without replacing a FRU. It also allows you to clear a fault if ILOM was unable to automatically detect the FRU replacement.
ILOM can detect hard drive replacement. However, to configure and unconfigure a hard drive, you must type the Solaris cfgadm command. See Section 3.1, Hot-Plugging a Hard Drive. ILOM does not handle hard drive faults. Use the Solaris message files to view hard drive faults. See Section 2.8, Collecting Information From Solaris OS Files and Commands.
The Solaris Predictive Self-Healing (PSH) technology enables the Sun Blade T6340 server module to diagnose problems while the Solaris OS is running. Many problems can be resolved before they negatively affect operations.
The Solaris OS uses the fault manager daemon, fmd(1M), which starts at boot time and runs in the background to monitor the system. If a component generates an error, the daemon handles the error by correlating the error with data from previous errors and other related information to diagnose the problem. Once diagnosed, the fault manager daemon assigns the problem a Universal Unique Identifier (UUID) that distinguishes the problem across any set of systems. When possible, the fault manager daemon initiates steps to self-heal the system and take the component offline. The daemon also logs the fault to the syslogd daemon and provides a fault notification with a message ID (MSGID). You can use the message ID to get additional information about the problem from Sun’s knowledge article database.
The Predictive Self-Healing technology covers the following Sun Blade T6340 server module components:
The PSH console message provides the following information:
If the Solaris PSH facility has detected a faulty component, type the fmdump command to identify the fault. Faulty FRUs are identified in fault messages using the FRU name. For a list of FRU names, see TABLE 1-3.
| Note - Additional Predictive Self-Healing information is available at: http://www.sun.com/msg |
1. Use the fmadm faulty command to identify a faulty component.
# fmadm faulty STATE RESOURCE /UUID faulted cpu:///cpuid=8/serial=FAC006AE4515C47 8856153f-6f9b-47c6-909a-b05180f53c07 |
The output shows the UUID of the related fault and provides information for clearing the fault.
2. Use the output of this command to clear the fault as shown in Section 2.7.2, Clearing PSH Detected Faults.
If fmadm faulty does not identify a faulty component or if you need more detailed information, type the fmdump command.
The fmdump command displays the list of faults detected by the Solaris PSH facility. Use this command for the following reasons:
If you already have a fault message ID, go to Step 2 to obtain more information about the fault from the Sun Predictive Self-Healing Knowledge Article web site.
| Note - Faults detected by the Solaris PSH facility are also reported through ILOM alerts. In addition to the PSH fmdump command, the ILOM show faulty command also provides information about faults and displays fault UUIDs. See Section 2.5.1, Displaying System Faults. |
1. Check the event log by typing the fmdump command with -v for verbose output.
In this example, a fault is displayed, indicating the following details:
2. Use the Sun message ID to obtain more information about this type of fault.
a. In a browser, go to the Predictive Self-Healing Knowledge Article web site: http://www.sun.com/msg
b. Type the message ID in the SUNW-MSG-ID field, and press Lookup.
In this example, the message ID SUN4U-8000-6H returns the following information for corrective action:
c. Follow the suggested actions to repair the fault.
When the Solaris PSH facility detects faults, the faults are logged and displayed on the console. After the fault condition is corrected, for example by replacing a faulty FRU, you might have to clear the fault.
1. After replacing a faulty FRU, boot the system.
# fmadm faulty STATE RESOURCE /UUID faulted cpu:///cpuid=8/serial=FAC006AE4515C47 8856153f-6f9b-47c6-909a-b05180f53c07 |
3. Clear the fault from all persistent fault records.
In some cases, even though the fault is cleared, some persistent fault information remains and results in erroneous fault messages at boot time. To ensure that these messages are not displayed, perform the following command:
# fmadm repair cpu:///cpuid=8/serial=FAC006AE4515C47 fmadm: recorded repair to cpu:///cpuid=8/serial=FAC006AE4515C47 # fmadm faulty STATE RESOURCE/UUID |
| Note - You can also use the FRU fault UUID instead of the Fault Management Resource Identifier (FMRI). |
Typing fmadm faulty after the repair command verifies that there are no more faults.
When the Solaris PSH facility detects faults, the faults are also logged by the ILOM software.
| Note - If you clear the faults using Solaris PSH, you do not have to clear the faults in ILOM. If you clear the faults in ILOM, you do not have to clear them with Solaris PSH. |
| Note - If you are diagnosing or replacing faulty DIMMs, do not follow this procedure. Instead, perform the procedure in Section 4.3.2, Replacing the DIMMs. |
1. After replacing a faulty FRU, at the ILOM prompt, type the ILOM -> show faulty command to identify PSH detected faults.
PSH detected faults are distinguished from other faults by the text:
Host detected fault.
2. Use the ILOM clear_fault command to clear the fault on the component provided in the show faulty output:
With the Solaris OS running on the Sun Blade T6340 server module, you have all the Solaris OS files and commands available for collecting information and for troubleshooting.
In the event that POST, ILOM, or the Solaris PSH features did not indicate the source of a fault, check the message buffer and log files for fault notifications. Hard drive faults are usually captured by the Solaris message files.
Type the dmesg command to view the most recent system message.
Use the /var/adm/messages file to view the system messages log file.
The dmesg command displays the most recent messages generated by the system.
The error logging daemon, syslogd, automatically records various system warnings, errors, and faults in message files. These messages can alert you to system problems such as a device that is about to fail.
The /var/adm directory contains several message files. The most recent messages are in the /var/adm/messages file. After a period of time (usually every ten days), a new messages file is automatically created. The original contents of the messages file are rotated to a file named messages.1. Over a period of time, the messages are further rotated to messages.2 and messages.3, and then deleted.
2. Type the following command.
3. If you want to view all logged messages, type:
The Automatic System Recovery (ASR) feature enables the server module to automatically unconfigure failed components to remove them from operation until they can be replaced. In the Sun Blade T6340 server module, the following components are managed by the ASR feature:
The database that contains the list of disabled components is called the ASR blacklist (asr-db).
In most cases, POST automatically disables a component when it is faulty. After the cause of the fault is repaired (FRU replacement, loose connector reseated, and so on), you must remove the component from the ASR blacklist.
The ASR commands (TABLE 2-8) enable you to view and manually add or remove components from the ASR blacklist. These commands are run from the ILOM -> prompt. For information about ALOM CMT commands, see the Sun Integrated Lights Out Manager 2.0 Supplement for Sun Blade T6340 Server Modules, 820-3904.
|
Select the following tabs: System Information, Components, Actions,
|
showcomponent [3] |
||
|
Removes a component from the asr-db blacklist, where asrkey is the component to enable. |
|||
|
Adds a component to the asr-db blacklist, where asrkey is the component to disable. |
|||
| Note - The components (asrkeys) vary from system to system, depending on how many cores and memory are present. Type the showcomponent command to see the asrkeys on a given system. |
To see examples of ILOM web interface and CLI commands that show component status, see Section 2.5.2, Displaying the Environmental Status with the ILOM CLI.
The show command displays the system components (asrkeys) and reports their status.
1. At the -> prompt, type the show command.
An example with no disabled components.
Sometimes a system exhibits a problem that cannot be isolated definitively to a particular hardware or software component. In such cases, it might be useful to run a diagnostic tool that stresses the system by continuously running a comprehensive battery of tests. Sun provides the SunVTS software for this purpose.
This procedure assumes that the Solaris OS is running on the Sun Blade T6340 server module, and that you have access to the Solaris command line.
1. Check for the presence of SunVTS packages using the pkginfo command.
TABLE 2-9 lists some SunVTS packages.
If SunVTS is not installed, you can obtain the installation packages from the following resources:
The SunVTS 7.0 software, and subsequent compatible versions, are supported on the Sun Blade T6340 server module.
SunVTS installation instructions are described in the Sun VTS 7.0 User’s Guide, 820-0012.
Before you begin, the Solaris OS must be running. You should verify that SunVTS validation test software is installed on your system. See Section 2.10.1, Checking SunVTS Software Installation.
The SunVTS installation process requires that you specify one of two security schemes to use when running SunVTS. The security scheme you choose must be properly configured in the Solaris OS for you to run SunVTS.
SunVTS software features both character-based and graphics-based interfaces.
For more information about the character-based SunVTS TTY interface, and specifically for instructions on accessing it by TIP or telnet commands, refer to the Sun VTS 7.0 User’s Guide.
Finally, this procedure describes how to run SunVTS tests in general. Individual tests might presume the presence of specific hardware, or might require specific drivers, cables, or loopback connectors. For information about test options and prerequisites, refer to the following documentation:
1. Log in as superuser to a system with a graphics display.
The display system should be one with a frame buffer and monitor capable of displaying bitmap graphics such as those produced by the SunVTS BI.
where test-system is the name of the server you plan to test.
3. Remotely log in to the server as superuser.
Type a command such as rlogin or telnet.
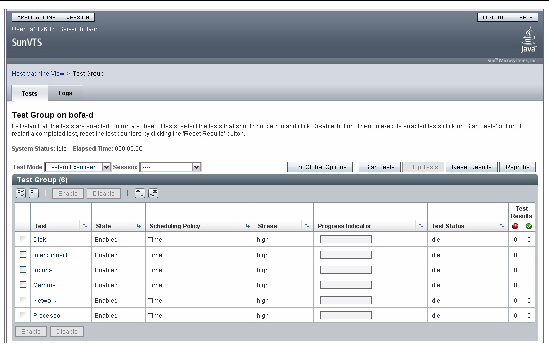
As SunVTS starts, it prompts you to choose between using CLI, BI, or tty interfaces. A representative SunVTS BI is displayed below (FIGURE 2-17).
5. (Optional) Select the test category you want to run.
Certain tests are enabled by default, and you can choose to accept these.
Alternatively, you can enable or disable test categories by clicking the checkbox next to the test name or test category name. Tests are enabled when checked, and disabled when not checked.
TABLE 2-10 lists tests that are especially useful to run on this server.
6. (Optional) Customize individual tests.
You can customize test categories by right-clicking on the name of the test.
Click the Start button that is located at the top left of the SunVTS window. Status and error messages appear in the test messages area located across the bottom of the window. You can stop testing at any time by clicking the Stop button.
During testing, SunVTS software logs all status and error messages. To view these messages, click the Log button or select Log Files from the Reports menu. This action opens a log window from which you can choose to view the following logs:
The procedure for resetting the ILOM root password to the factory default (changeme) requires installation of a jumper on the service processor. This procedure should be performed by a technician, a service professional, or a system administrator who services and repairs computer systems. This person should meet the criteria described in the preface of the Sun Blade T6340 Server Module Service Manual.
1. Remove the server module from the modular system chassis.
Prepare for removal using ILOM or ALOM CMT commands and ensure that the blue OK to Remove LED is lit, indicating that it is safe to remove the blade.
2. Open the server module and install a standard jumper at location J0601, pins 11 and 12.
3. Close the server module, install it in the modular system chassis, and boot the server module.
Refer to the Sun Blade T6340 Server Module Installation and Administration Guide for instructions.
The ILOM root password is now reset to the factory default (changeme).
Refer to the Sun Blade T6340 Server Module Installation and Administration Guide for instructions.
5. Remove the server module from the modular system chassis and remove the jumper.
As in Step 1, prepare for removal using ILOM or ALOM CMT commands and ensure that the blue OK to Remove LED is lit, indicating that it is safe to remove the blade.
6. Close the server module, install it in the modular system chassis, and boot the server module.
Refer to the Sun Blade T6340 Server Module Installation and Administration Guide for instructions.
Copyright © 2010, Oracle and/or its affiliates. All rights reserved.