Defining Data Series for Diagrams
Two ways to define the data series for a diagram are:
-
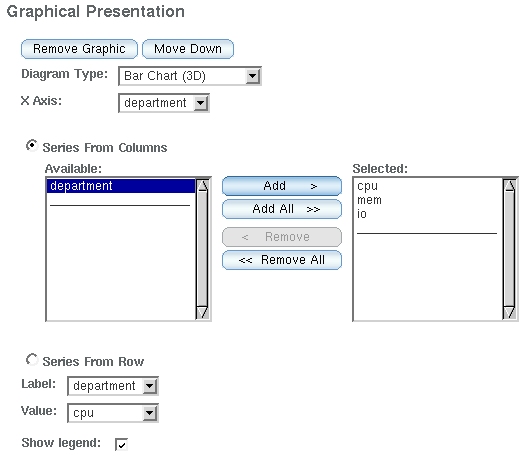
Series from columns: All column values are added to a series. The name of the series is the column header
-
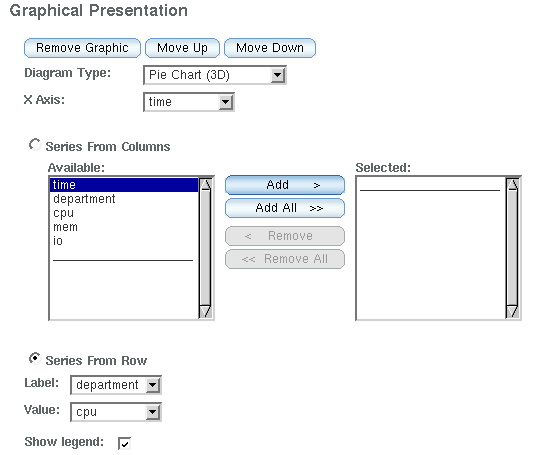
Series from rows: All column values define the series. The names of the series is defined by the values of the label column. The values of the series are defined by the value column.
Example 5–1 Accounting per Department Pie Chart
The query “Accounting per Department” results in a table with the columns: time, department, and cpu.
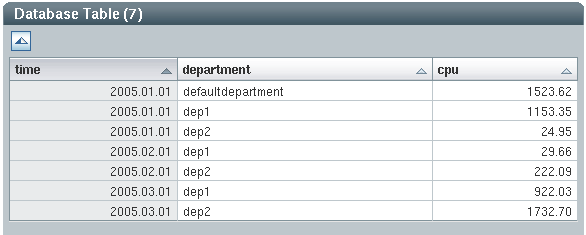
To display the result in a pie chart, select the following configuration:
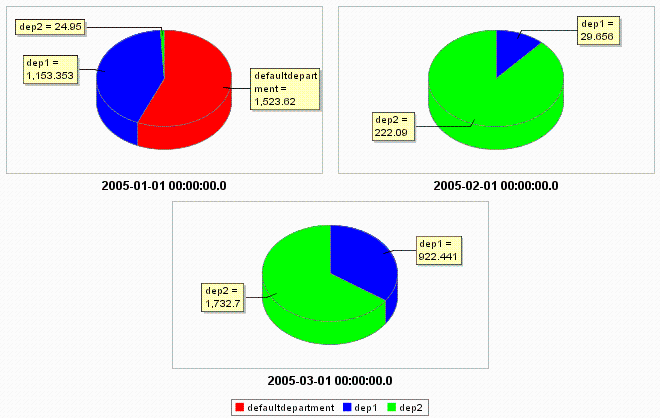
The result will be multiple pie charts
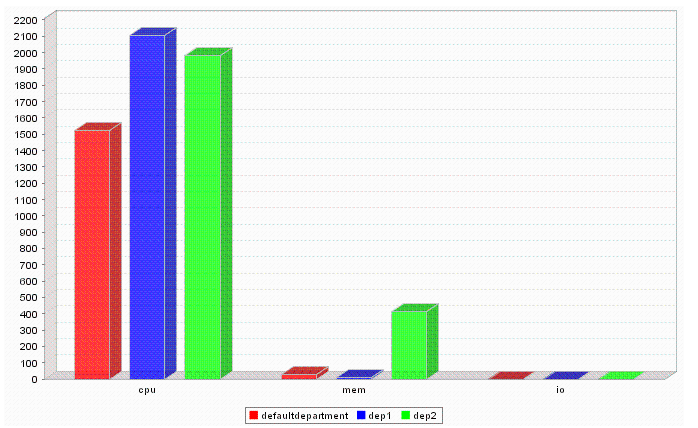
Example 5–2 CPU, Input/Output, and Memory Usage Over All Departments Bar Chart
A query summarizes CPU, IO, and Mem usage over all departments:

To display the results in a bar chart, select the following configuration
The results will be a bar chart with three bars for each department:
- © 2010, Oracle Corporation and/or its affiliates
