| Skip Navigation Links | |
| Exit Print View | |

|
Monitoring Java EE Components in Oracle Java CAPS Java CAPS Documentation |
| Skip Navigation Links | |
| Exit Print View | |

|
Monitoring Java EE Components in Oracle Java CAPS Java CAPS Documentation |
Starting the Enterprise Manager Server
To Start the Enterprise Manager Server
Logging In to Enterprise Manager
To Log In to Enterprise Manager
Adding an Application Server Domain to Enterprise Manager
To Add an Application Server Domain to Enterprise Manager
Adding an Application Server Instance to Enterprise Manager
To Perform Prerequisite Steps on the Application Server
To Add an Application Server Instance to Enterprise Manager
Using the Connectivity Map Controls
To Adjust the Position of the Connectivity Map
To Zoom In on the Connectivity Map
To Zoom Out from the Connectivity Map
To Specify an Exact Zoom Percentage
Stopping the Enterprise Manager Server
To Stop the Enterprise Manager Server
Monitoring Application Servers
Viewing Basic Information About an Application Server
To View Basic Information About an Application Server
Viewing Summary Information For an Application Server
To View Summary Information for an Application Server
Stopping Application Server Domains
To Stop an Application Server Domain
Hiding, Showing, and Removing Application Servers
To Make All of the Hidden Application Servers Reappear
To Remove an Application Server
Viewing Basic Information About a Collaboration
To View Basic Information About a Collaboration
Viewing Consumption Information For a Collaboration
To View Consumption Information For a Collaboration
Viewing Summary Information For a Collaboration
To View Summary Information For a Collaboration
Stopping and Restarting Collaborations
Displaying Information About an Adapter
To Display Information About an Adapter
Stopping and Starting Inbound Adapters
Viewing the Application Server Log File
To View the Application Server Log File
Viewing the Message Server Log File
To View the Message Server Log File
To Change the Status of an Alert
To Delete More Than One Alert at a Time
To Delete All Alerts For the Selected Component
To Configure the Alert Table Name (Databases Other Than Derby)
To Set Up Database Access (Databases Other Than Derby)
To Run the Database Scripts (Databases Other Than Derby)
To Log In to the Configuration Agent
About Enterprise Manager Topic and Queue Management
Monitoring Topics and Queues for JMS IQ Manager
Sending and Publishing Messages for JMS IQ Manager
Viewing Message Properties for JMS IQ Manager
Viewing and Editing Message Payload for JMS IQ Manager
Monitoring Java System Message Queue
Monitoring Topics and Queues for Java System Message Queue
Sending and Publishing Messages for Java System Message Queue
Viewing Message Properties for Java System Message Queue
Viewing and Editing Message Payload for Java System Message Queue
Monitoring Oracle Advanced Queueing
Monitoring Topics and Queues for Oracle Advanced Queueing
Sending and Publishing Messages for Advanced Queueing
Viewing Message Payload for Advanced Queueing
To View the Payload of Text and Byte Messages
Monitoring WebLogic Server JMS
Monitoring Topics and Queues for WebLogic Server JMS
Sending and Publishing Messages for WebLogic Server JMS
Viewing Message Properties for WebLogic Server JMS
Viewing Message Payload for WebLogic Server
To View the Payload of Text and Byte Messages
Monitoring Java Message Service Grid
Monitoring Application Servers, Collaborations, and Alerts (Command Line)
Enterprise Manager Command-Line Client Syntax
Monitoring Application Servers and Collaborations (Command Line)
Listing the Available Methods For the Runtime Service
Displaying the List of Components
Starting and Stopping Collaborations
Monitoring Alerts (Command Line)
Enterprise Manager enables you to monitor alerts at runtime. You can perform the following tasks:
View alerts
Filter alerts
Delete alerts
Java CAPS provides an Alert Management API. For detailed information about the Alert Management API, see Oracle Java CAPS Management and Monitoring APIs.
An alert is triggered when a specified condition occurs in a Project component. The condition might represent a problem that must be corrected, or the condition might be informational.
The following table lists the predefined alerts for Java CAPS Enterprise Service Bus. Each predefined alert is identified by a code, such as COL-00001. The alert also includes a description, such as Collaboration running.
Table 1 Predefined Alerts for Java CAPS Enterprise Service Bus
|
To view information about the predefined alerts for Adapters, see Alert Codes for Oracle Java CAPS Adapters. Project developers can add custom alerts.
The initial status of an alert is Unobserved. You can change the status to Observed or Resolved. Observed indicates that you looked at and acknowledged the alert. Resolved indicates that you fixed the problem that caused the alert.
By default, alerts are not persisted to an external database. For information about configuring persistence, see Configuring Alert Persistence.
You can view alerts at runtime. In addition, you can change the status of an alert.

The alerts for the selected component appear. The summary row below the tabs displays the total number of alerts for each alert type (Fatal, Critical, Major, Minor, Warning, and Info). The toolbar appears below the summary row.
The Alert Details dialog box appears.
You can also reset the status to Unobserved by clicking the Reset icon.
You can control which alerts appear in Enterprise Manager.
The alerts for the selected component appear.
The Alerts Filter dialog box appears. The fields that appear in the dialog box depend on the type of component that you selected in the Explorer panel.
You can delete a single alert, or multiple alerts at a time.
The alerts for the selected component appear.
A confirmation dialog box appears.
To select all of the alerts, click the Select All icon.
To select alerts that may or may not be contiguous, use the CTRL key.
To select a contiguous range of alerts, click an alert at one end of the range, press the SHIFT key, and click the alert at the other end of the range.
A confirmation dialog box appears.
A confirmation dialog box appears.
Note - If an alert does not currently appear because of a filter, then the alert is not deleted. See Filtering Alerts.
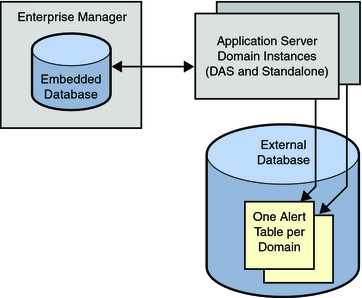
The alert persistence architecture includes the following databases.
Enterprise Manager's embedded database.
An external database that you can use to persist alerts. The external database contains one alert table per domain.

By default, alerts are not persisted to the external database. This topic describes how to enable persistence. Be sure to understand the behavior of the various persistence configurations.
If persistence is disabled, then alerts are generated and sent to any monitoring instances that are currently running. The monitoring instances can include no more than one instance of Enterprise Manager, as well as any number of clients that use the Alert Management API. For detailed information about the Alert Management API, see Oracle Java CAPS Management and Monitoring APIs.
If persistence is enabled and journaling is disabled, then the alerts are stored temporarily in the external database. The system makes a best effort to send the alerts to all monitoring instances. When the reliable client indicates that it received an alert, the alert is deleted from the database.
There can be only one reliable client at a time. The most recent client to request reliable delivery becomes the reliable client. Enterprise Manager requests reliable delivery when you start the server. Clients that use the Alert Management API can request reliable delivery when they subscribe to the alert notification service.
Note - If the reliable client is shut down, then there is no reliable client until the next request for reliable delivery is made.
If persistence and journaling are both enabled, then alerts are stored permanently in the external database. When a client consumes an alert, the alert is not deleted from the database.
You can use any of the following database types for the external database. The Derby database is included with GlassFish Application Server. The other database types are not included.
DB2
Derby
Oracle
PointBase
Sybase
If you want to use a database type other Derby, then you must perform additional configuration tasks. For example, you must use Java Database Connectivity (JDBC) software and the Java Naming and Directory Interface (JNDI) API to set up access to the database.
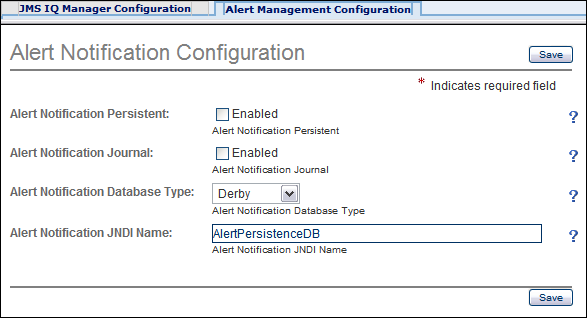
For all database types, you must log in to the Configuration Agent and modify the alert notification fields.
Perform the following tasks to configure alert persistence:
You might need to change the default value to match your organization's naming conventions, or to comply with the database server's character limit for table names.
You can make the driver accessible to the common class loader or the system class loader.
For detailed information about how to integrate a JDBC driver, click Help in the Admin Console.
For detailed information about how to create a JDBC connection pool, click Help in the Admin Console.
You will enter the JNDI name of the JDBC resource in a later procedure. Set the pool name to the JDBC connection pool that you just created.
For detailed information about how to create a JDBC resource, click Help in the Admin Console.
Ensure that the table name matches the value in the eventmanagement.properties file.
http://hostname:portnumber/configagent
Set the hostname to the TCP/IP host name of the computer where the application server is installed. Set the port number to the administration port number of the application server. For example:
http://myserver.company.com:4848/configagent
The Configuration Agent Security Gateway appears.
The Configuration Agent appears.

You can archive the alerts in Enterprise Manager's embedded database. The archive process writes the alerts to .csv files in the JavaCAPS-install-dir/emanager/EventRepositoryDb directory.
The eventdb_archive.properties file in the JavaCAPS-install-dir/emanager/server/shared/classes directory enables you to configure the archive process. The following table describes the properties.
Table 2 Alert Archive Properties
|
If you change the value of one or more properties, then you must restart the Enterprise Manager server in order for the changes to take effect. See Enterprise Manager Basics.
In certain situations, a large number of alerts can be generated in a short period of time. For example, a system goes down and messages are repeatedly attempted to be processed. You can use a property to reduce the number of alerts that appear. The property value is expressed in milliseconds. The default value is 5000, which equals 5 seconds. If multiple instances of an alert arrive during this period of time, then only one instance of the alert will appear.
A string is added to the beginning of the alert details field. The string indicates the number of duplicate alerts that were processed. For example:
[3x] Collaboration CMap1_jcdFileToJMS1 is RUNNING