| Skip Navigation Links | |
| Exit Print View | |

|
Monitoring Java EE Components in Oracle Java CAPS Java CAPS Documentation |
| Skip Navigation Links | |
| Exit Print View | |

|
Monitoring Java EE Components in Oracle Java CAPS Java CAPS Documentation |
Starting the Enterprise Manager Server
To Start the Enterprise Manager Server
Logging In to Enterprise Manager
To Log In to Enterprise Manager
Adding an Application Server Domain to Enterprise Manager
To Add an Application Server Domain to Enterprise Manager
Adding an Application Server Instance to Enterprise Manager
To Perform Prerequisite Steps on the Application Server
To Add an Application Server Instance to Enterprise Manager
Using the Connectivity Map Controls
To Adjust the Position of the Connectivity Map
To Zoom In on the Connectivity Map
To Zoom Out from the Connectivity Map
To Specify an Exact Zoom Percentage
Stopping the Enterprise Manager Server
To Stop the Enterprise Manager Server
Monitoring Application Servers
Viewing Basic Information About an Application Server
To View Basic Information About an Application Server
Viewing Summary Information For an Application Server
To View Summary Information for an Application Server
Stopping Application Server Domains
To Stop an Application Server Domain
Hiding, Showing, and Removing Application Servers
To Make All of the Hidden Application Servers Reappear
To Remove an Application Server
Viewing Basic Information About a Collaboration
To View Basic Information About a Collaboration
Viewing Consumption Information For a Collaboration
To View Consumption Information For a Collaboration
Viewing Summary Information For a Collaboration
To View Summary Information For a Collaboration
Stopping and Restarting Collaborations
Displaying Information About an Adapter
To Display Information About an Adapter
Stopping and Starting Inbound Adapters
Viewing the Application Server Log File
To View the Application Server Log File
To Change the Status of an Alert
To Delete More Than One Alert at a Time
To Delete All Alerts For the Selected Component
To Configure the Alert Table Name (Databases Other Than Derby)
To Set Up Database Access (Databases Other Than Derby)
To Run the Database Scripts (Databases Other Than Derby)
To Log In to the Configuration Agent
To Modify the Alert Notification Fields
About Enterprise Manager Topic and Queue Management
Monitoring Topics and Queues for JMS IQ Manager
Sending and Publishing Messages for JMS IQ Manager
Viewing Message Properties for JMS IQ Manager
Viewing and Editing Message Payload for JMS IQ Manager
Monitoring Java System Message Queue
Monitoring Topics and Queues for Java System Message Queue
Sending and Publishing Messages for Java System Message Queue
Viewing Message Properties for Java System Message Queue
Viewing and Editing Message Payload for Java System Message Queue
Monitoring Oracle Advanced Queueing
Monitoring Topics and Queues for Oracle Advanced Queueing
Sending and Publishing Messages for Advanced Queueing
Viewing Message Payload for Advanced Queueing
To View the Payload of Text and Byte Messages
Monitoring WebLogic Server JMS
Monitoring Topics and Queues for WebLogic Server JMS
Sending and Publishing Messages for WebLogic Server JMS
Viewing Message Properties for WebLogic Server JMS
Viewing Message Payload for WebLogic Server
To View the Payload of Text and Byte Messages
Monitoring Java Message Service Grid
Monitoring Application Servers, Collaborations, and Alerts (Command Line)
Enterprise Manager Command-Line Client Syntax
Monitoring Application Servers and Collaborations (Command Line)
Listing the Available Methods For the Runtime Service
Displaying the List of Components
Starting and Stopping Collaborations
Monitoring Alerts (Command Line)
Enterprise Manager enables you to view the log files for the following components:
GlassFish Application Server
Java System Message Queue
Java CAPS JMS IQ Manager
Oracle Advanced Queue (if installed)
WebLogic JMS (if installed)
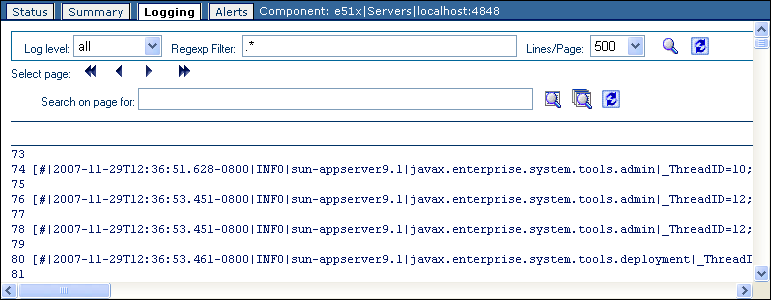
Enterprise Manager enables you to view the server log file for the GlassFish Application Server.

The application server log file appears.
For example, if you select the WARNING log level, then Enterprise Manager displays any WARNING and SEVERE log messages.
The search is case sensitive.
You can enter multiple filters by using an ampersand (&). Here are two examples:
INFO & MBean
Project1 & Service1
The string must be at least three characters.
The Clear Results icon enables you to remove the highlighting of the search results.
Enterprise Manager enables you to view the log file for Java System Message Queue and Java CAPS JMS IQ Manager.
The log file appears.
For example, if you select the WARNING log level, then Enterprise Manager displays any WARNING and SEVERE log messages.
The search is case sensitive. You can enter multiple filters by using an ampersand (&). Here are two examples:
INFO & MBean
Project1 & Service1
The string must be at least three characters.
The Clear Results icon lets you remove the highlighting of the search results.