| Oracle® Communications Service Broker Netra 6000 High Availability Manager Administrator's Guide Release 6.0 Part Number E26770-01 |
|
|
View PDF |
| Oracle® Communications Service Broker Netra 6000 High Availability Manager Administrator's Guide Release 6.0 Part Number E26770-01 |
|
|
View PDF |
This chapter describes how to view Oracle Communications Service Broker Netra 6000 High Availability Manager (HA Manager) logs.
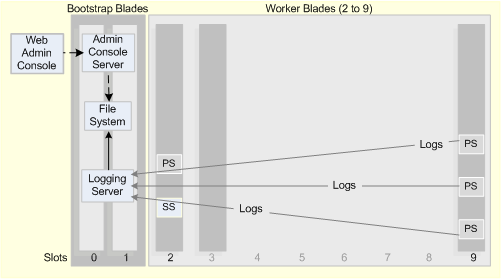
The HA Manager Logging Server, located on the primary Bootstrap Blade, collects the logs generated by the Signaling Servers and the Processing Servers. It also groups log messages into files, assigns file names, and writes the log files to the file system.
Logging is based on a standard log4j configuration. See "log4j Configuration" for more information.
Figure 8-1 shows the flow of log messages to the Logging Server, where they are managed and stored.
Figure 8-1 Logging Server Log Aggregation
The Logging Server process is started automatically when the HA Manager is started. You can manage Logging Server life cycle tasks through the System Administration Console, System tab. See "Managing and Monitoring Hardware and Processes" for more information.
The Logging Server writes logs collected from the Signaling Servers and the Processing Servers to a shared file system on the two Bootstrap Blades.
Log files are stored in separate directories dedicated to the server from which the logs originated. Directory names are based on the slot number and server identity of the Worker Blade from which the log events were generated.
See "Viewing Log Files from the File System" for more information.
When logs from a specific server reach a preconfigured size of 10 MB, the logs are rolled over into a single file. A default maximum of 90 MB of log files from the source server are stored at any one time.
The first 10-MB file in the directory is automatically assigned the name server.log.1. When the second 10-MB file is rolled over, the numeric suffix to the first file is changed to 2 and the newer file is assigned the suffix 1.
This rollover of files continues until by default, the ninth file is created, that is, server.log.9, and the oldest (or tenth) file in the chain is removed from the system.
Logging Server and file aggregation processes are controlled by the following:
Table 8-1 describes the parameters and default values in the Logging Server properties file.
Table 8-1 Logging Server Properties Files
| Parameter | Description | Default Value |
|---|---|---|
|
axia.loggingserver.listenhost |
Specifies the host or IP address that listens for incoming logging events. |
None. Defaults to all local address. |
|
axia.loggingserver.port |
Specifies the port the Logging Server uses to listen for incoming logging events. |
4560 |
|
axia.loggingserver.log4j.configuration |
Points to the log4j configuration file. |
properties/loggingserver-configuration.xml |
|
axia.loggingserver.root.log.directory |
Specifies the root log directory for directories and files. Defaults to the logs directory in the Logging Server directory. |
Logs |
|
log4j.configuration |
log4j configuration file that the Logging Server uses for its own log events. |
log4j.xml |
|
axia.platform |
Specifies an internal property used for the Logging Server process setup. |
Used for platform properties setup |
|
axia.loggingserver.aggregate.logs |
Specifies how logs are aggregated. |
False Setting this value to True would collate logs from different servers into a single file. |
Logging is based on the standard log4j logging framework.
The log4j configuration for the Logging Server and each of the Signaling Servers and Processing Servers is as follows:
Logging Server: Configured in the loggingserver-configuration.xml file
Signaling Servers and Processing Servers: Logs of each server are configured in a standard log4j.xml configuration file, located under directories dedicated to specific servers
Note:
It is recommended not to modify the logging configuration files. If it is necessary for you to change any element in the files, please first contact Oracle Consulting for assistance.For detailed information about log4J and the configuration files, see log4J documentation at:
You can view the logs in either of the following ways:
You can view the log files using the System Administration Console. Up to 100 log events are displayed per page.
To view log files using the System Administration Console:
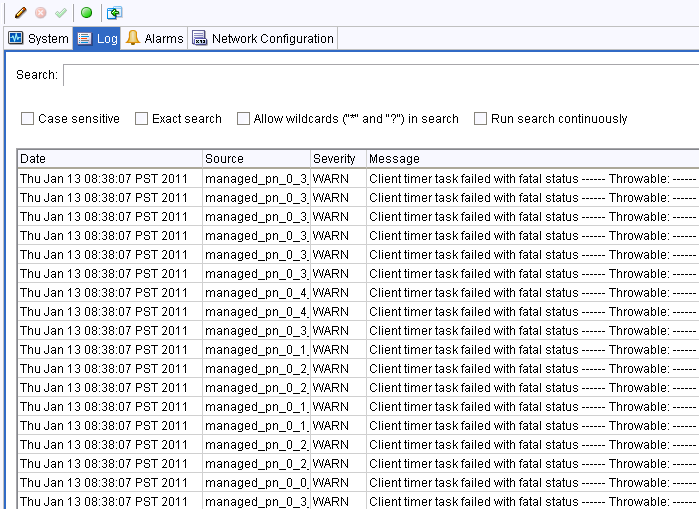
In the System Administration Console main screen, click the Log tab to display a list of log messages.
Figure 8-2 shows how log messages are displayed in the Log tab.
The active logs are displayed in the Log window with the newest message at the top of the page and the oldest at the end of the page, under the following columns:
Date: The date the event was logged
Source: The server from which the log message originated
Severity: The level of the log event
Message: The message contained in the log event
You can filter the log messages that are displayed by typing a search string in the Search field and selecting any of the following search criteria:
Case sensitive
Exact search
Allow wildcards: The following wild cards are supported:
* Any number of characters from 0 up
? One character only
Run search continuously: The system re-reads the log files every two seconds and turns off pagination.
You can search for specific logs based on date and time, using the formats for date and time used in the log4j configuration file.
You can also specify a severity to display all logs matching the specified severity level.
Click Update.
The filtered view you specified is now displayed.
You can view the log files directly by connecting to the Bootstrap Blade to the following default location:
/var/ocsb/ocsb/logging_server/logs
Under this directory, the log files are split among sub-directories with names based on the Signaling Server or the Processing Server that generated the logs. For example, log messages generated by a Processing Server on Worker Blade 2 would appear under the directory named managed_pn_0_1_0.
See "Bootstrap Blades and Worker Blades" for information on identifying Worker Blade slots and servers.
You can also access the Bootstrap Blade using Secure Shell (SSH). See "Accessing the Bootstrap Blade Using SSH" for information.
If the Logging Server fails, the HA Manager process management system detects if the Logging Server terminates and attempts to restart it automatically. Alternatively, you can restart the Logging Server using the System Administration Console.
If a hard drive or system error jeopardizes the ability of the Logging Server to handle the logs, an ERROR log message is printed to System.err.
When the log files stored in the system exceed the size configured for each Signaling Server and Processing Server, the older files are deleted. A default aggregate of 90 MBs of the most current log events per server are stored at any time.
If you want to back up older log files destined for deletion, you can use any of the standard archiving methods supported by your individual system.
|
Copyright © 2011, 2012, Oracle and/or its affiliates. All rights reserved. Legal Notices |
|